Andrews Pitchfork is one great trading tool for technical traders. Those looking to learn how to use Andrews Pitchfork will find it extremely easy and straightforward. Moreover, the Andrews Pitchfork mt4 indicator is visible and helps traders spotting the right place to enter/exit the market.
Few know the origins of this indicator. Developed by Dr. Alan Andrews, the indicator is also known as Dr. Andrews Pitchfork.
However, for traders, its history doesn’t matter. What’s important is to find ways to profitable trade with it.
The starting point is to understand this is a different indicator. It is not a trend one. Nor an oscillator.
In fact, there is a strong controversy surrounding it. How come?
At a closer look, the Andrews Pitchfork has only three lines. Parallel ones. There’s nothing fancy and unusual about it so far. Anyone can draw three parallel lines.
The problem comes from their starting point. From where to draw the lines? What is the starting point?
That’s what the big controversy is about. These starting points (so-called pivots) have different rules, depending on the strategy used.
Each trend line starts from a pivot point, and Andrews called them P0, P1, and P2. When you apply the Andrews Pitchfork mt4 indicator on a chart, the platform asks you to make three clicks.
The first click represents, P0, the second one P1 and the last one P2. They show the Andrews Pitchfork starting point.
Some traders use arbitrary places for these pivots. Others, combine them with different trading theories.
This article aims to show the power of the Andrews Pitchfork mt4 indicator and how to use Andrews Pitchfork when trading the Forex market. Furthermore, it will incorporate new ways to think of trading concepts.
Introducing the Andrews Pitchfork MT4 Indicator
Because of its simplicity, every retail trader has heard of the Andrews Pitchfork tool. In fact, it is so popular, the MetaTrader platform gave it an individual tab.
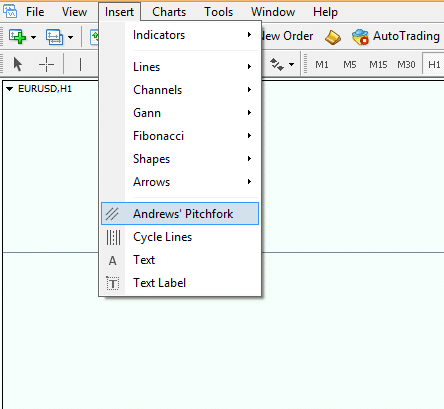
After selecting it, traders must make three clicks on a chart. Those clicks are the pivot points. And, they show the nature of the Andrews Pitchfork.
A rising Pitchfork is, of course, bullish. Hence, a falling one shows weakness.
However, the Andrews Pitchfork mt4 indicator can form horizontally too. In any case, the resulting lines are parallel. And, they show future support and resistance levels.
We’ve treated support and resistance in previous articles. As such, traders know that when they form on the horizontal, the market meets classical support/resistance.
On the other hand, if they aren’t horizontal, they’re called dynamic support/resistance levels. The later is more powerful.
Traders that know how to use Andrews Pitchfork will have a competitive advantage ahead of the market. They’ll know the dynamic support and resistance levels in advance.
Moreover, not all three trend lines that make the Andrews Pitchfork react the same. They offer different levels of support and resistance.
The Andrews Pitchfork mt4 indicator has three lines. That is, in its simplistic form.
Each line starts from a pivot. Andrews called them UML (Upper Median Line), ML (Median Line) and LML (Lower Median Line). But, they don’t have the same importance.
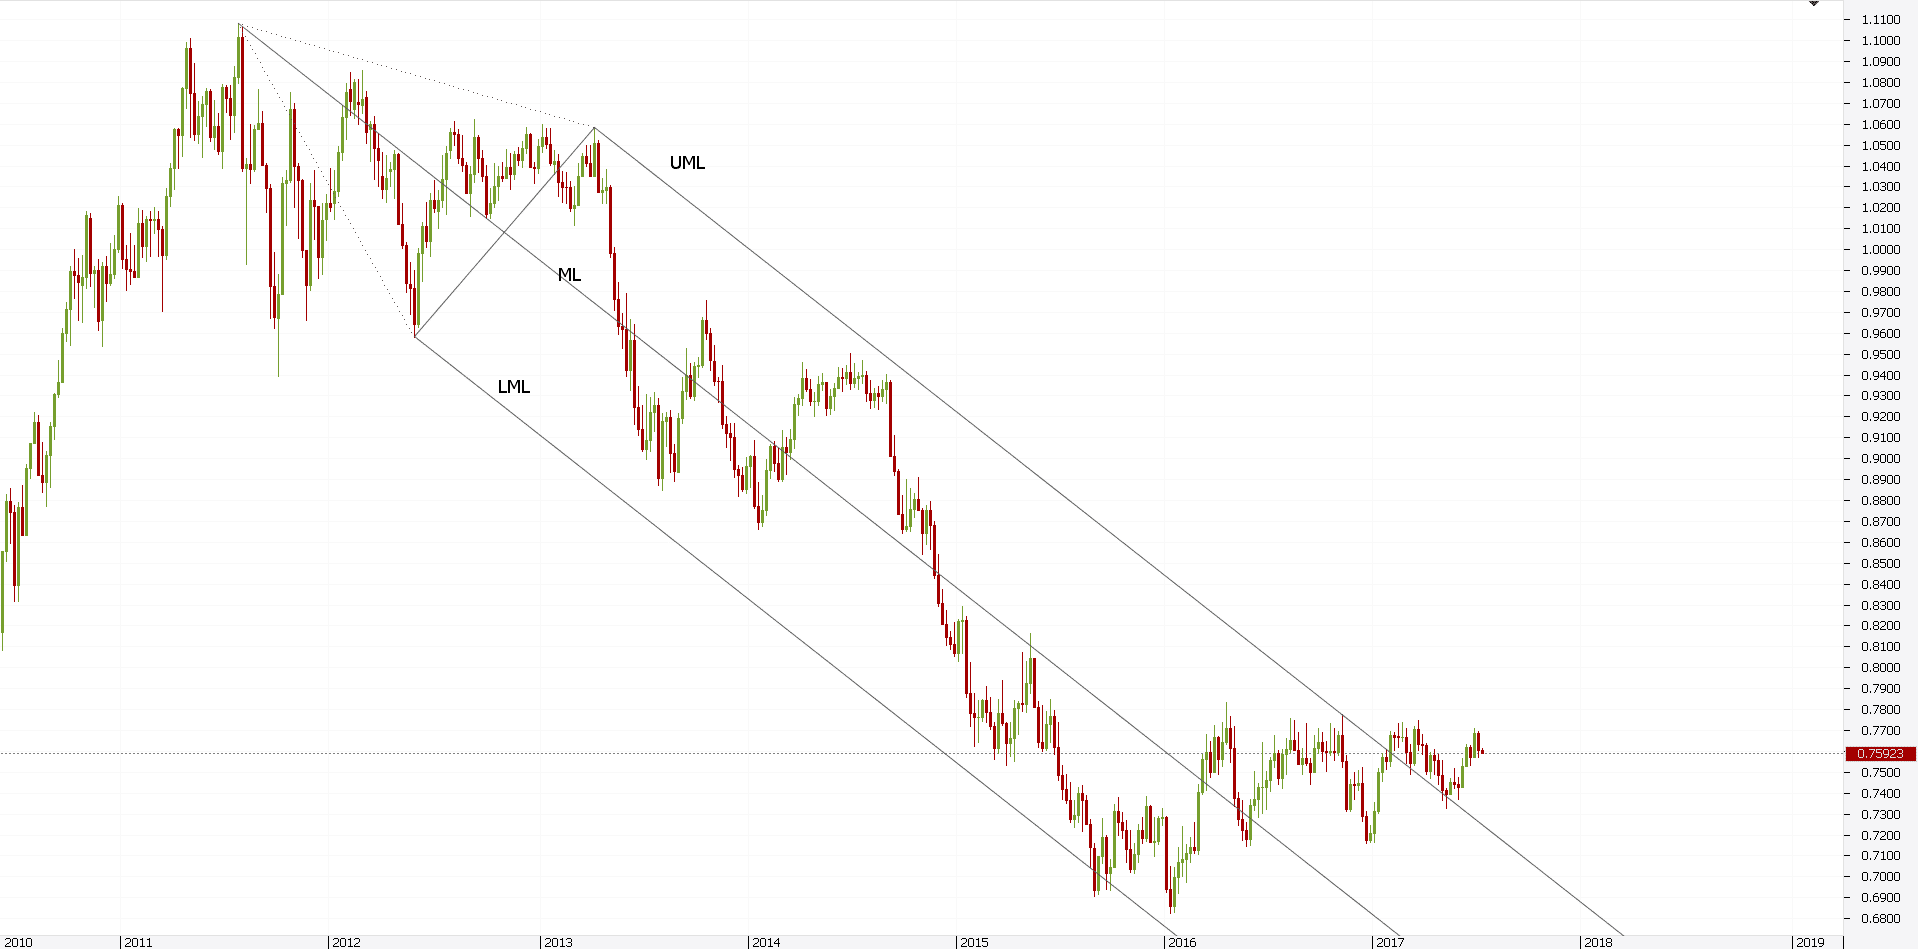
By far, the most important one is the ML. It has one big characteristic: it attracts price.
As such, it acts like a magnet. Because of that, traders use it to adjust their trading strategies.
How to Use Andrews Pitchfork
There are many ways to use this powerful trading tool. Some traders use it as a single indicator.
Others integrate the Pitchfork with other trading tools. In any case, there’s not one Andrews Pitchfork strategy that works all the time.
Like anything in trading, the interpretation is relative. However, because trading is a probability game when using the Andrews Pitchfork mt4 indicator, traders have better chances to find profitable trades.
The classical way to use this trading tool is to look after support and resistance levels. Both classic and dynamic support/resistance levels form. But, as we all know by now, the dynamic ones are more valuable.
The bigger the time frame, the more powerful the reaction from the levels will be. The idea is to integrate the dynamic support/resistance rules with Andrews Pitchfork power.
Together, as part of a trading strategy, they’ll end up offering great results. However, they must be part of a money management system.
Without managing the risk, trading results become random. That’s not something a trader wants.
Rules and discipline in following them matter most. However, any trading system that ends with an idea where the price goes, is a plus.
The Andrews Pitchfork mt4 indicator is easy to edit. In fact, it allows adding Fibonacci ratios. The indicator plots parallel lines with the ML, UML, and LML.
The distance between the lines is a Fibonacci ratio. As such, traders use further dynamic support/resistance levels.
But, the most powerful characteristic is the way ML attracts the price. Everything should be centered around it.
Dynamic Support and Resistance Levels with Andrews Pitchfork
The most important attribute of Andrews Pitchfork mt4 indicator is the dynamic support and resistance levels that form. Furthermore, traders know them in advance.
Remember the Andrews Pitchfork rules? The three lines start from the three pivots. As such, by the moment traders identify them, the tool projects the three lines further on the right side of the chart.
Hence, traders know beforehand the future support and resistance levels. Check the EURGBP daily chart below.
The three pivots (P0, P1, P2) give the angle and the shape of Andrews Pitchfork. The resulting UML, ML, and LML act as future dynamic support/resistance levels.
As always, once a level gets broken, resistance turns into support. And, the other way around too.
Judging by the current prices, the EURGBP pair looks bullish. The price is in the rising Pitchfork. Moreover, considering the ML attracts the price, traders assume the current consolidation will break to the upside.
This is just one way how to use Andrews Pitchfork. But, it is very powerful. Especially on the bigger time frames.
The key here is the ML. Many traders misinterpret how to use Andrews Pitchfork’s ML.
While it attracts the price, it doesn’t offer any support. Nor resistance.
Just the fact that it pierces it is enough for a strong trend.
Keep in mind that the chart above shows the daily time frame. As such, those dynamic support and resistance levels were impossible to be ignored.
Traders had all the time in the world to adapt their strategy to the Andrews Pitchfork tool.
Using Andrews Pitchfork – ML Attracts Price
The ML is the one line that matters the most. Traders focus on it when analyzing a trading.
Because of that, strong trends see the ML guiding the price action. Eventually, the price will pierce it multiple times.
As a rule of thumb, while the price stays within Andrews Pitchfork mt4 edges, the trend will keep going. The fact that it pierces the ML multiple times shows strength. Hence, traders don’t use this as support or resistance.
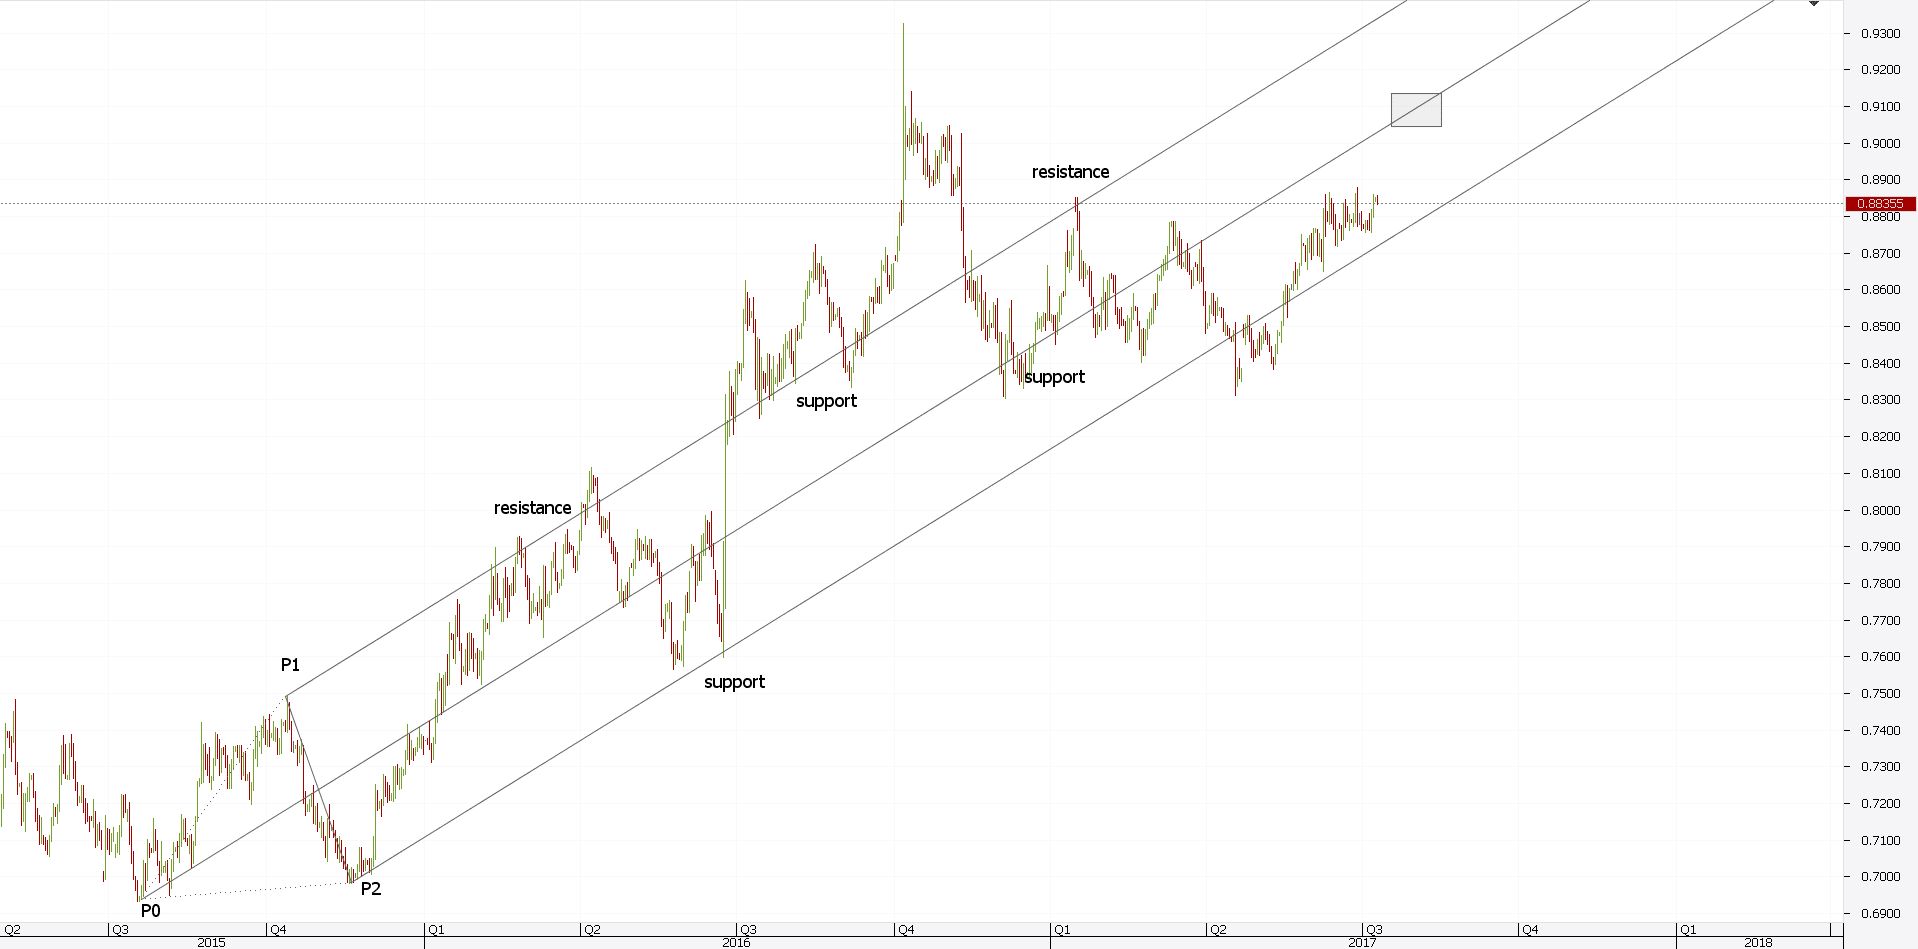
Above is the EURUSD daily chart. It shows the drop from the 1.40 area to almost parity.
Fundamentally speaking, the ECB (European Central Bank) moved the interest rate in negative territory. Moreover, it started a quantitative easing program.
These two were enough to send Euro lower across the board. How to use Andrews Pitchfork to spot the trend?
That’s very simple. The idea is to consider the first swing to place the pivots.
As such, the P0 is the start of the move. Next, the P1 is the end of the first drop. Finally, the P2 is the end of the first swing higher.
The resulting Andrews Pitchfork shows a very strong trend. Even if the price gets above the UML, the bearishness is overwhelming.
On top of it, the ML attracts the price on a constant basis. Furthermore, the UML and LML act as strong support and resistance levels.
Using Andrews Pitchfork this way gives dynamic support and resistance levels. But, this is valid only for the UML and LML.
For the ML, multiple piercings simply show how strong the trend is. In this case, very strong.
However, how do we know when the trend ends? When should bulls consider a bottom is in place? And, what changes to the Andrews Pitchfork mt4 strategy?
Andrews Pitchfork Trading Strategies – Using the Schiff Line
The way to answer the above questions is to use the Schiff line. This is a line that connects the P0 and P1 pivots.
As such, traders know in advance where the Schiff line is. In strong trends, the price has a strong tendency to move away from it.
As a rule of thumb, in a bearish trend keeps going as long as the price stays below the Schiff line. Of course, the opposite happens in a bullish trend.
This shows how to use Andrews Pitchfork Schiff line to divide the market into bullish and bearish trends. That is if the market trends.
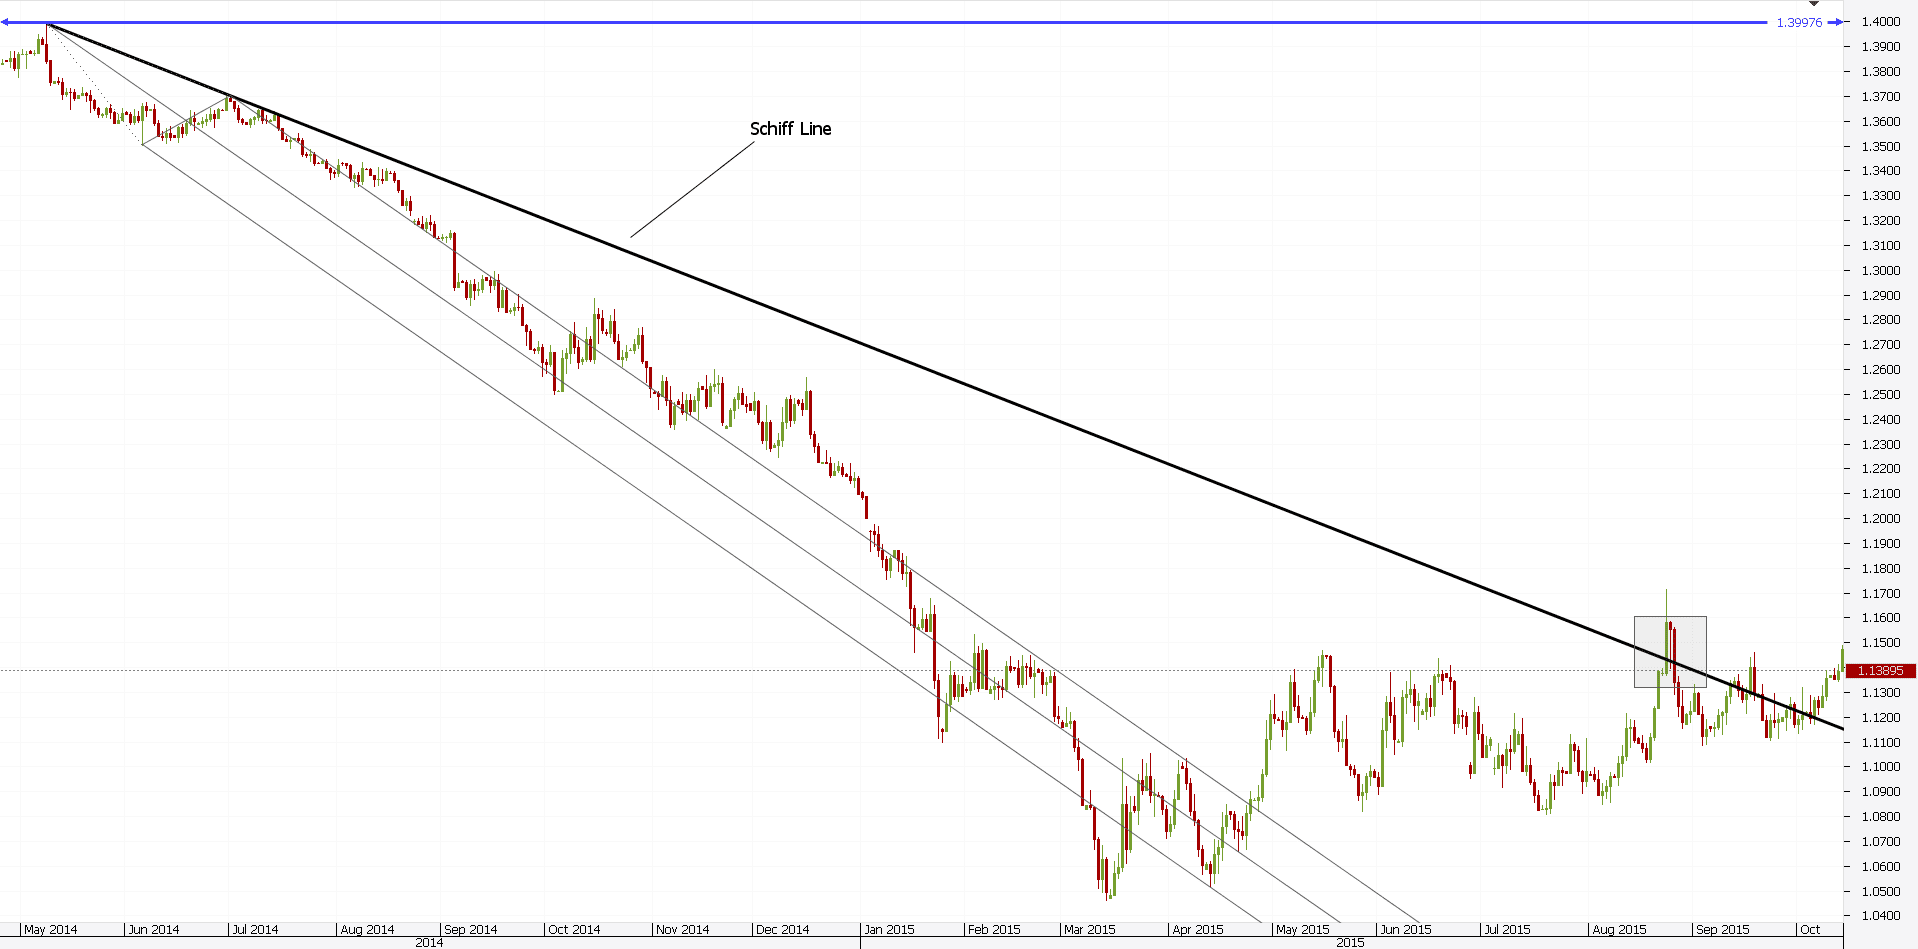
Here’s the Schiff line on the earlier EURUSD chart. It shows when the bearish trend ended.
In fact, it shows when bears should NOT consider selling anymore. Because the Schiff line gets broken, it means bulls will step in on any future pullbacks.
Few traders know about the Schiff line’s existence. Moreover, they misinterpret the price action.
This is no wonder. As the Andrews Pitchfork tool from above shows, the price breaks away from the three lines. Multiple times.
However, until the Schiff line gets broken, there is not much traders should do. Inexperienced ones will change the Pitchfork with a bullish one.
That is incorrect. They should wait for the Schiff line’s break.
What’s interesting is that the pair makes a double bottom first. Next, it jumps to the ML. Then, it finds no resistance anymore.
It simply consolidates, until time passes and the Schiff line breaks. That’s the confirmation the double bottom is in place. This is just a way how to use Andres Pitchfork in a trending market.
However, Andrews Pitchfork mt4 indicator is more than that. Especially when Fibonacci ratios get involved…
Andrews Pitchfork with Fibonacci
Technical traders know the power of Fibonacci ratios. As such, they use them as often as possible.
Various trading strategies use the Fibonacci levels. Andrews Pitchfork couldn’t simply ignore them.
The most famous ratio, the 61.8% is the one that stands out of the crowd. Because of this golden ratio, traders find the right angle in a trend. Even if the Schiff line gets broken!
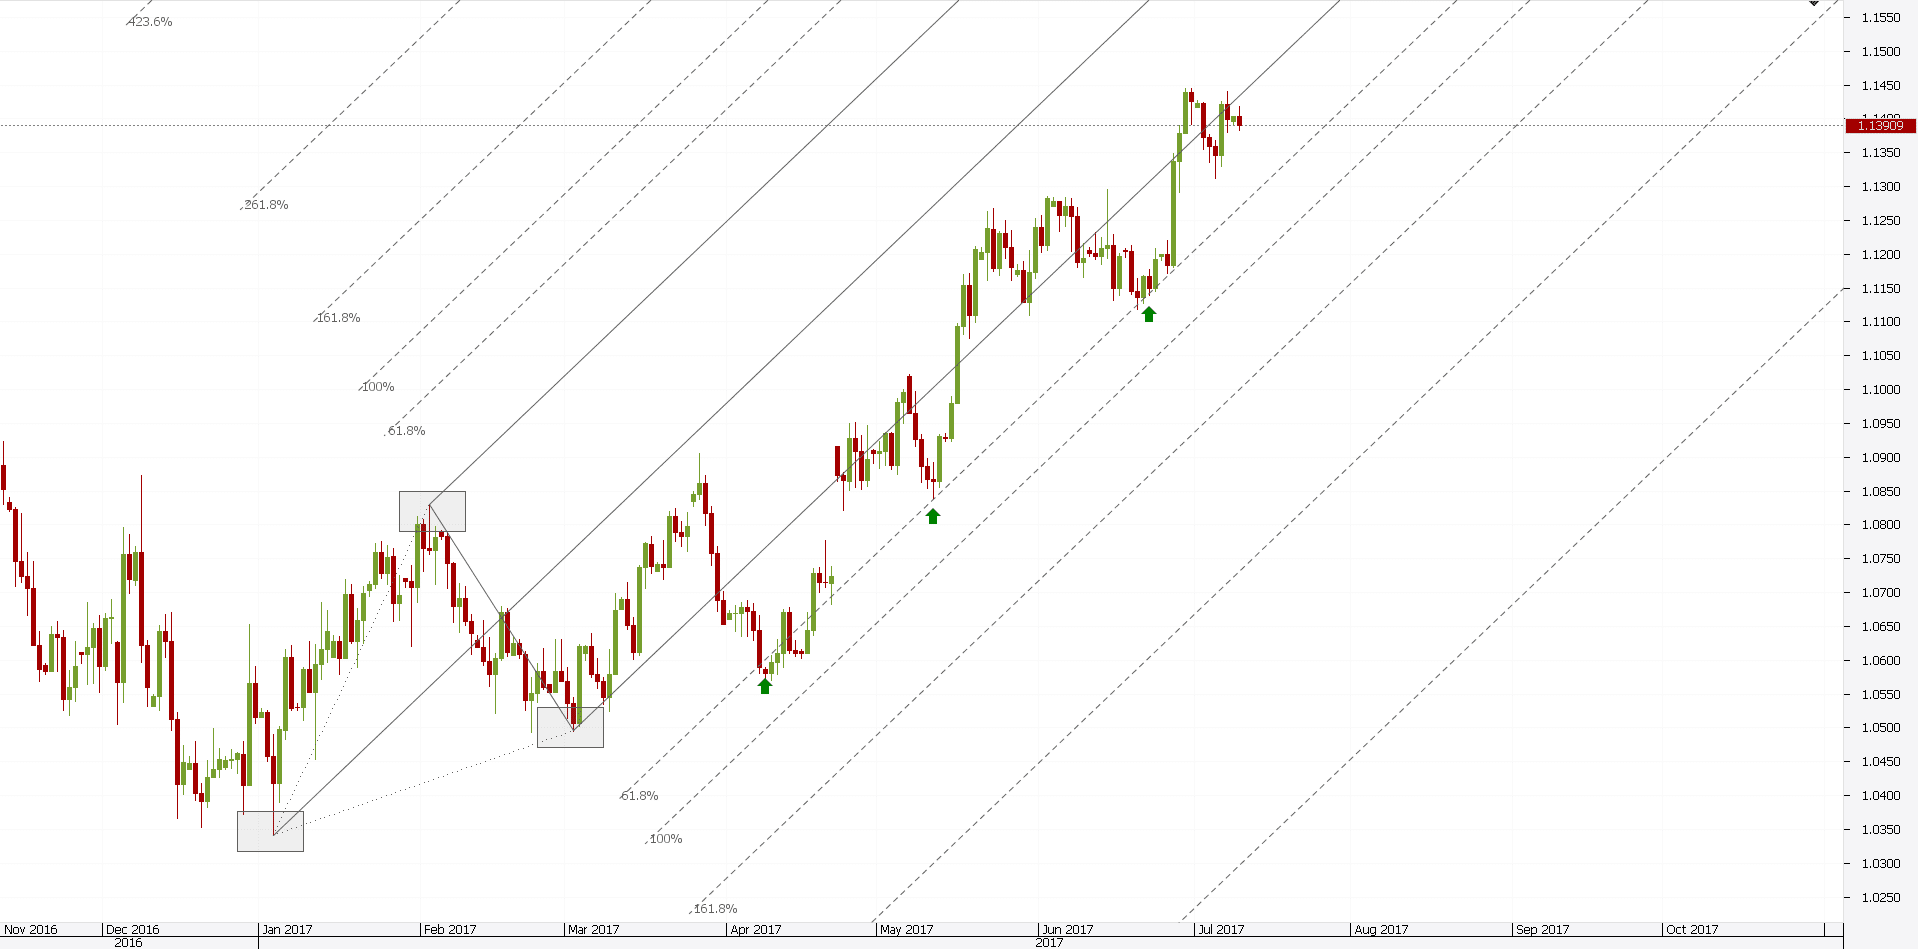
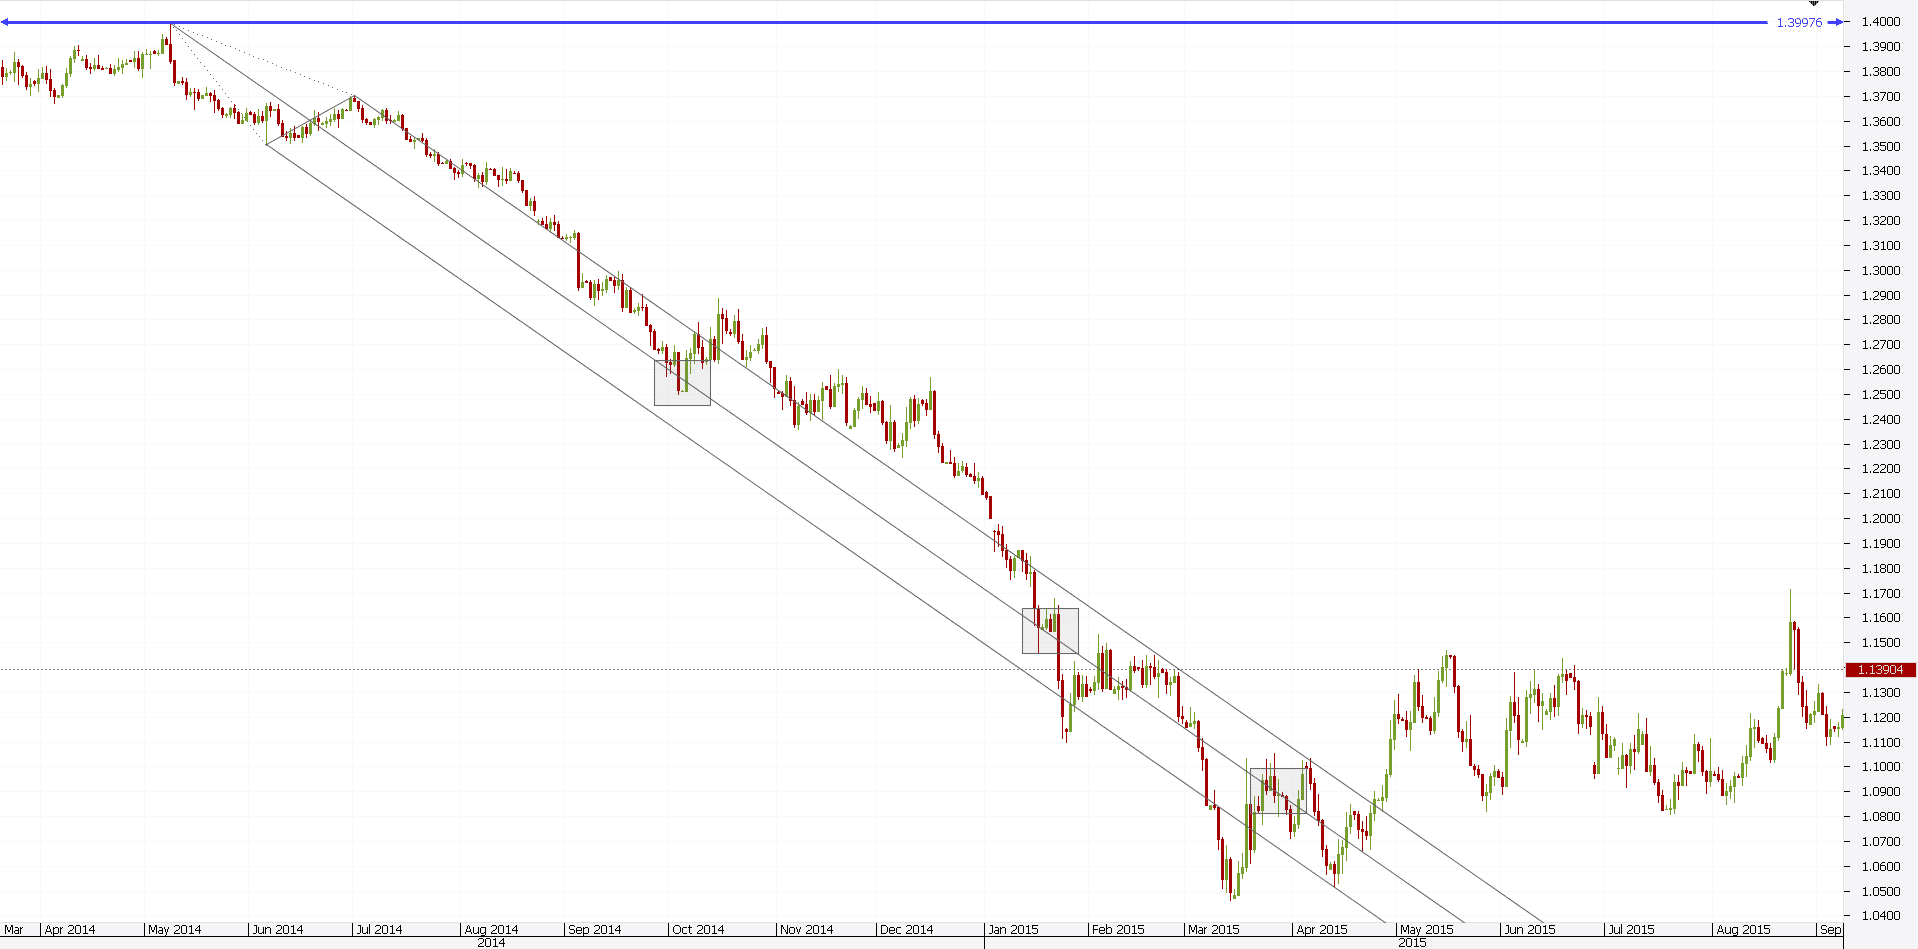
Above is the current EURUSD daily chart. It shows a rising Andrews Pitchfork mt4 indicator applied from the bottom.
While the Schiff line doesn’t appear on the chart, one can imagine it. Simply imagine a line connecting the P0 and P2 points.
It seems to be broken. But, in doing that, the price was at a strong support level. How to use Andrews Pitchfork when the Schiff line gets pierced?
Watch to see if there’s a support/resistance level in that area. In this case, bulls had a major ally. The golden ratio.
The 61.8% dynamic support shows a parallel line with the ones that make the Pitchfork. So far, it gave three perfect long trades. At the same time, the LML acts as resistance.
Other Fibonacci levels show different dynamic support/resistance with the Andrews Pitchfork mt4 indicator. However, the golden ratio is the one that stands out of the crowd.
In this case, the price didn’t even get to the ML. It doesn’t mean it won’t. Just that the LML attracted it so far. As such, it is difficult to be broken.
At this point, the Andrews Pitchfork trading on the EURUSD should focus on what the price will form at the LML. If it forms a continuation pattern (pennant, triangle, flag, etc.), the next target will be the ML.
How to Use Andrews Pitchfork with Other Trading Tools
These are not the only ways to trade with Andrews Pitchfork. Multiple trading theories and strategies use it.
Elliott Waves traders use it too. When counting impulsive or corrective waves, Elliott Waves traders look for the perfect trade.
Such a trade must have an entry, stop loss and take profit. The Andrews Pitchfork mt4 indicator gives the last one.
Elliott allows setting the stop loss using clear and concise rules. However, when it comes to the take profit things get complicated. Especially when the analysis comes from the bigger time frames.
As such, the fact that the price has a strong tendency to reach the ML helps. Elliott Waves traders first look at the extension in an impulsive move. It must be there.
But, the extension, or the litmus test, represents the minimum distance the price travels. Therefore, Andrews Pitchfork ML helps with finding the extended wave’s end.
When using Andrews Pitchfork, Forex traders look at a trend. Or, expect one. However, that’s not all the tool can do.
How to use Andrews Pitchfork with an oscillator? Is it even possible?
The answer is yes. Consider the RSI (Relative Strength Index) oscillator. It is the most popular oscillator that exists.
The overbought and oversold levels with the RSI help to find the pivot points. The fact that the price hesitates there helps.
From the moment the pivots are in place, trading with the Andrews Pitchfork indicator mt4 becomes easy.
Conclusion
The Andrews Pitchfork as a trading tool has a bit of mystery for retail traders. While everyone knows to use it in a trend, few know how to master it.
The key stays with the pivot points. If a trader can draw them correctly, the Andrews Pitchfork mt4 indicator works like a charm.
But, even the Forex market doesn’t trend all the time. In fact, it consolidates prices most of it.
As such, Andrews Pitchfork works best on bigger time frames. However, even on the lower ones, when the market consolidates, the Andrews Pitchfork shows when the trend changes.
The Schiff line is part of it. And it shows how to use Andrews Pitchfork when the market consolidates on lower time frames.
A top/down analysis gives great insights on how to use Andrews Pitchfork. Such an analysis allows traders to study all time frames.
It starts from the biggest one (monthly) and continues with the weekly chart. Next, daily and the four-hours ones. Finally, the hourly completes the sequence.
When applying the Andrews Pitchfork mt4 indicator on all these time frames, traders have an edge. Multi-timeframes analysis results in a better understanding of market conditions.
The price may trend on the bigger time frames. And, show consolidation on lower ones. Andrews Pitchfork allows both trends and consolidations to be integrated into the trading decision.
When combined with Fibonacci, the initial Andrews Pitchfork mt4 indicator becomes more powerful.
The 161.8% and 61.8% projected from the main Andrews Pitchfork lines give strong levels to buy or sell a market. The bigger the time frame is, the stronger the levels are.
All in all, Andrews Pitchfork shows the stance of a market. It tells if it trends or not. And, more importantly, it gives great trades from dynamic support and resistance levels.
START LEARNING FOREX TODAY!
share This:


Leave a Reply