As long as daily closing price remains above $266, BCH/USD will be attempting to move up, potentially to test one of the key resistance levels supported by Fibonacci retracement levels.
Disclaimer: The analysis presented in this article is for educational purposes only and should not be considered as financial advice.
This analysis was done on MetaTrader 4.
Click below to open a Free Demo Account with our trusted brokers:
Analysis Details:
BCH/USD symbol on the MT4 platform
Type: Bullish
Key support levels: 266, 240, 215
Key resistance levels: 325, 417, 455
Price Action:
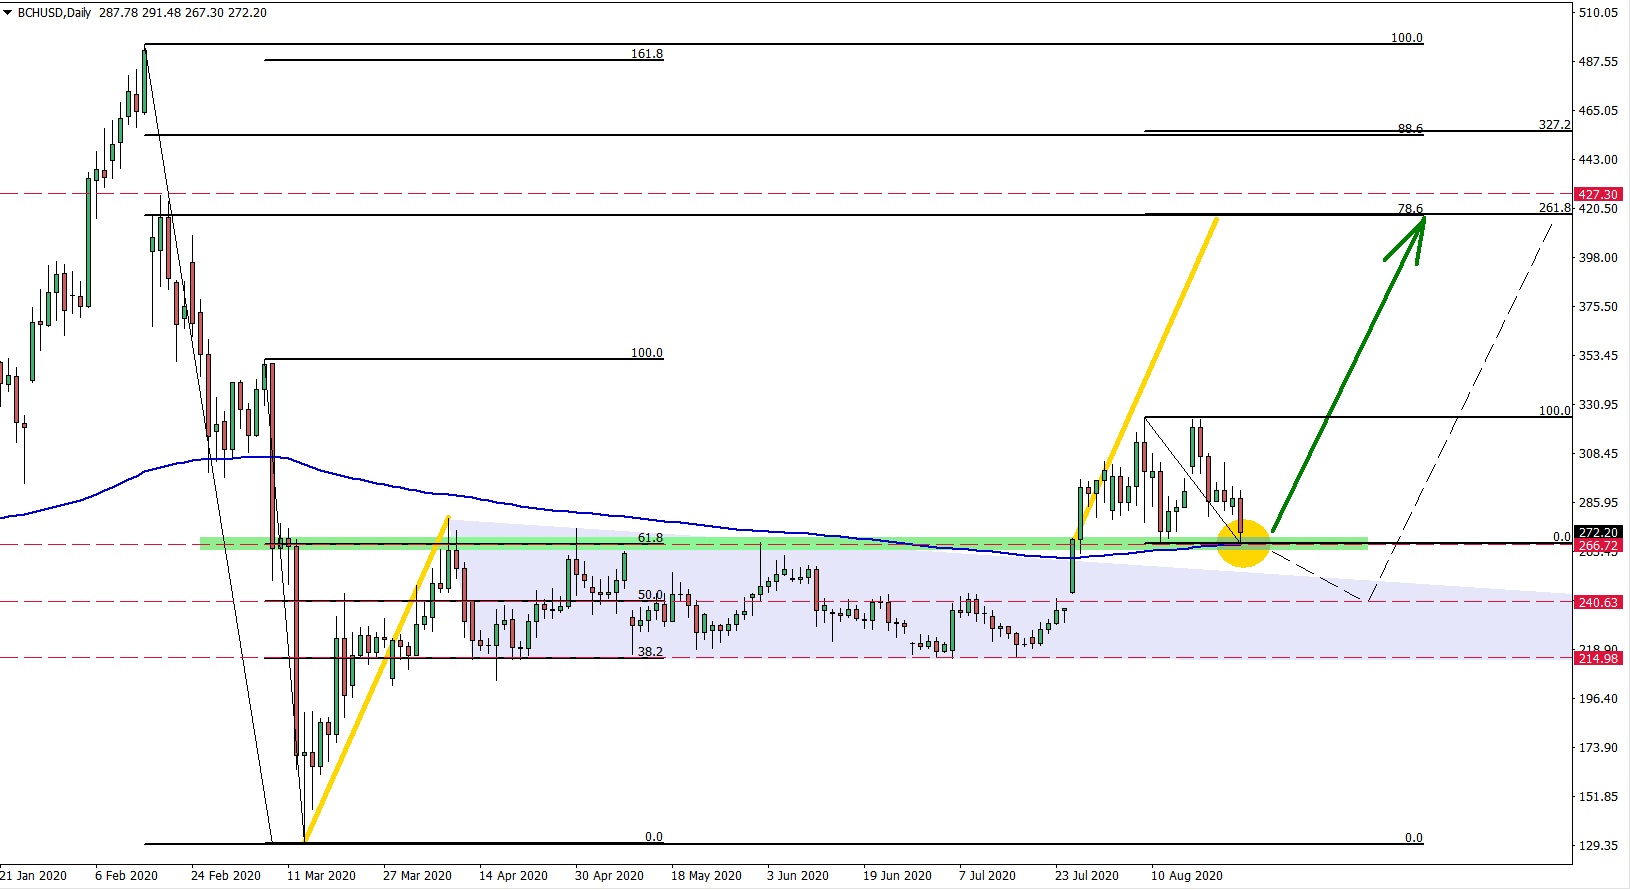
The BitcoinCash could have established a long term uptrend after price broke above multiple resistances. During April – July 2020 price has formed a triangle pattern and massive support area near $215. This support is confirmed by the 38.2% Fibs applied to the last wave down, and there were at least 4 bounces off this level. On the other hand, the resistance has been formed at $266, which is 61.8% Fibonacci retracement level. The price has traded between $215 support and $265 resistance areas during 4 consecutive months, but then breakout occurred.
On July 27, BCH broke above the $265 resistance, triangle pattern as well as the 200 Exponential Moving Average. This was a huge bullish sign for BCH/USD after which price tested $325 high and formed a double top at this level. Currently, the price corrected down and rejecting the $265 support along with the 200 EMA. This is a strong demand area and a very attractive buying area, which might invite long term investors.
As long as daily closing price remains above $266, BCH/USD will be attempting to move up, potentially to test one of the key resistance levels supported by Fibonacci retracement levels. The first resistance is at $417, which is confirmed by 78.6% Fibs applied to the overall downtrend, and 261.8% Fibs applied to the current corrective wave down. But when/if this resistance will be reached and broken, BitcoinCash might move even higher to test next strong resistance at $455, which is also confirmed by two Fibs, 88.6%, and 327.2%.
In regards to the downside risk, only daily break and close below $265 might invalidate a bullish outlook where BCH/USD could be heading down to test either $240 or $215 support level.
To get exclusive Trading Signals, join our Premium Channel just for $29 per month


Leave a Reply