The Bollinger Bands indicator is perhaps the most popular trend indicator when analyzing a currency pair. Like any trend indicator, it is applied directly to the chart. Also, it is mostly used to find entries for riding a trend. These could be buying dips in a rising trend or selling spikes in a falling one.
John Bollinger developed the indicator with the idea to show the difference between a ranging environment and a breakout. The Bollinger band is made from three lines plotted on the screen. These are two standard deviations and one moving average.
Usually, the moving average is a simple one (SMA). However, recently it has been proved that using an exponential moving average (EMA) is more lucrative for riding a trend. In any case, the moving average is also called MBB (Middle Bollinger Band), and two standard deviations are above (UBB – Upper Bollinger Band) and below (LBB – Lower Bollinger Band) it.
The two standard deviations (UBB and LBB) are a measure of volatility. A typical Bollinger Bands strategy is to look for a break when the two standard deviations are moving away from each other.
How to Read Bollinger Bands
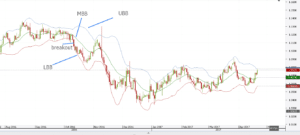
There are multiple ways to use the indicator. The most popular one being to look for a breakout when the bands are becoming closer to one another. This indicates a period of low volatility and a break is imminent.
Contrary to the general belief, the Forex market spends most of the time in consolidation. Over seventy percent of the time, prices are moving in a range.
Therefore, it is no wonder that over 90% of the time price is spending between the Bollinger bands. Only the rest 10% represents a Bollinger bands breakout. As a definition, a breakout is when a candlestick closes above the UBB or below the LBB lines.
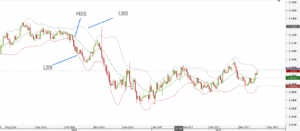
Using the same EURUSD daily chart as previously, we can see that a breakout occurred on October 11, 2015. And from that moment on, the Bollinger Bands indicator didn’t show a bullish breakout anymore.
A sound Bollinger Bands strategy would be to stay short on the EURUSD pair until a bullish breakout appears above the UBB. Doing that would result in being on the right side of the market for over six months and avoid the noise caused by the fundamental news.
How to Add to a Bollinger Bands Breakout Strategy
There are two ways to deal with an underlying trend with Bollinger Bands strategies. Both are the result of knowing how to use Bollinger Bands. One is to use the MBB line as entries in the direction of the trend. The other one is to use the UBB (in a bearish trend) and the LBB (in a bullish trend) to trade aggressively.
If a Bollinger Bands squeeze occurs, and the price breaks above or below one of the bands, the initial position should be reversed. The red arrows in the chart below show bearish Bollinger Bands signals given by the Bollinger Bands settings mentioned earlier.
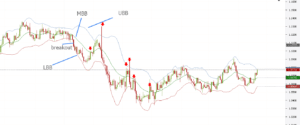
The big red candle caused by the U.S. Presidential election and the Trump effect is nothing but another opportunity that shows how to read Bollinger Bands indicator. While many bears were squeezed, the fact that price was not able to close above the UBB and the previous breakout was bearish, should be enough for another short position to be open at the candle’s closing.
As for the take profit, a classical one would be when the price is reaching the opposite Bollinger Band. In this example, as the underlying trend is bearish, the opposite band would be the LBB.
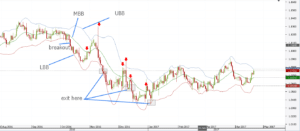
For the trades illustrated so far, the target area or the exit point are highlighted in the picture above. If you use a disciplined approach when trading the Forex market there is little or no room for error.
The key to this Bollinger Bands technical analysis approach is to wait for the candle to close. Of course, the examples above use the daily time frame, but the same principle can be successfully used on lower time frames too.
Therefore, the drawdown, in case the Bollinger Bands parameters are set on a lower time frame, is not that big like on the daily chart. However, the idea regarding how to interpret Bollinger Bands indicator is the same, no matter the time frame used.
So far, we saw the Bollinger Bands interpretation on a breakout strategy. It is based on how to calculate Bollinger Bands and interpret the standard deviations that indicate how volatile a market is. However, does a Bollinger Bands reversal strategy exists?
The answer is yes, and for this, we need to look for reversal pattern that forms when the price is reaching the extremes (UBB and LBB). The perfect reversal patterns are the Japanese candlestick techniques.
Reversal Patterns with Bollinger Bands Indicator
A great way to learn how does Bollinger Bands work is to look for reversal patterns given by Japanese candlestick techniques. Such reversal patterns are Doji candles, bullish or bearish engulfing, morning and evening stars, dark-cloud cover and piercing, hammer reversal and hanging man, and so on.
These are the most representatives and are forming all the time. Like anything related to trading, there is a trick here too.
The best Bollinger Band strategy with Japanese candlestick techniques is to look for the reversal pattern to reach the UBB or the LBB lines. You should ignore all other reversal patterns that are not touching the two volatility lines.
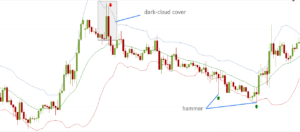
The example above shows a dark-cloud cover forming at the end of a bullish trend, with both candles that are part of the reversal pattern touching the UBB volatility line. This is enough to take a short trade.
As a take profit and finding your risk-reward ration, you can use the length of the dark-cloud cover To calculate it, simply measure the highest and the lowest point in the dark-cloud cover pattern. Then multiply it by 2.5 or 3 to find the take profit.
The stop loss should be the highest point of the reversal pattern. You can use a bigger risk-reward ratio, but that would not be a realistic approach.
In the example above, you seethat the dark-cloud cover acted as a Bollinger Band squeeze indicator as the price action that followed reached the take profit and some more.
The same is valid for the hammer reversal pattern that follows. By definition, a hammer is a bullish reversal pattern, meaning a bearish trend must be in place.
The idea is to use the hammer and other reversal patterns with clear rules, to develop a Bollinger Bands tutorial. Such a tutorial is like a trading plan that has both entry and exit levels. And it is a must have for every trader interested in mastering the Bollinger Bands width indicator.
Bollinger Bands Breakout with Elliott Waves
Another great way to use Bollinger Bands is to integrate the indicator with the Elliott Waves theory. This is one of the most popular trading theories that exists. It is well-known for the fact that it is incorporating human behavior/nature in the analysis.
After all, what is Bollinger Bands indicator if not one that looks for reversals or continuation patterns when crowds are on the other side of the market? A very good question we’re going to answer here is “what are Bollinger Bands, if not a trading tool that incorporates volatility ahead of a major break?”.
This is exactly what the Elliott Waves theory is for. Incorporating crowds’ behavior in a theory that allows gaining a competitive advantage ahead of the market.
The basic definition of Elliot Waves theory states that the market is advancing or declining in a five-wave structure that corrects with a three-wave counter move. A bullish trend, therefore, will have five waves to the upside, corrected with three waves to the downside.
The key to understanding how Elliott Waves works is to know that even within the five-waves that are defining a bullish move, there are two waves that move in the opposite direction. Bollinger Bands trading works in both the five-wave structure and the three-wave structure that corrects it.
Bollinger Bands with Corrective Waves
According to Elliott, a 5-wave structure is impulsive and is labeled with numbers. The name of the three-wave structure is a corrective move and is labeled with letters. Therefore, if ever seeing an Elliott wave count, you should be able to identify if it is corrective or impulsive. This should happen based on the letters or numbers that appear on the screen.
The Bollinger Bands bandwidth acts both as a reversal pattern, when fake breakouts appear, as well as a continuation pattern. The example below is relevant.
In an impulsive move, at least one wave should be extended. That means that one wave should stand out of the crowd, to be the longest.
Typically, that wave is the 3rd one, but this is not mandatory. Traders have the tendency to look for a pullback to come, as the second wave. And then to buy that pullback (if the impulsive wave or the five-wave structure is bullish) or to sell a spike (if the impulsive wave or the five-wave structure is bearish).
Such a retracement is almost always coming after a breakout that suggests volatility is on the rise and the ranging environment ended. A solid Bollinger Bands trading strategy lays on such a pullback to come after a breakout occurred.
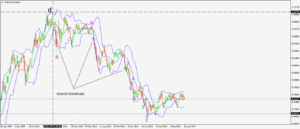
The chart above shows a flat pattern labeled a-b-c in magenta. Elliott found that the c-wave in a flat is always an impulsive move.
Therefore, it is obvious that the waves within the c-wave must be labeled with numbers. However, a closer look shows that the first bearish breakout appeared way before the start of the c-wave. It formed when the a-wave in magenta ended.
In other words, educated traders knew in advance that the pattern is bearish and any pullback in the MBB and UBB helps to short the pair. The chart below shows the opportunities given by Bollinger Bands if used in conjunction with a corrective wave within the Elliott Waves theory.
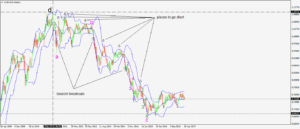
The arrows on the chart show possible places to add in an already bearish trend. They can be part of a trend following or a Bollinger Bands scalping strategy.
Bollinger Bands with Impulsive Waves
In the example above, the Bollinger Bands indicator works to find entries in a corrective wave of a bigger degree. However, the same works in an impulsive move.
The c-wave is a so-called “pattern within a pattern” in the sense that there is two first wave extension impulsive move of different degrees that make up for the c-wave of the elongated flat. A Bollinger Band scalping strategy applies easily, and you can trade the whole move until its end.
We should mention here that despite the general belief, impulsive waves are not that common. They are most likely part of a bigger degree corrective wave, like a zigzag or a zigzag family pattern.
Combining Bollinger Bands and the Elliott Waves, you increase the chances to trade corrective waves more than impulsive moves. In both cases, a breakout shows the right direction.
Bollinger Bands in Today’s Trading
As mentioned earlier, the price is spending most of the time, more than ninety percent of it, within the UBB and LBB lines. A breakout, therefore, is a heads up for the move to come.
However, fake moves can appear. Algorithmic traders or robots govern trading these days. They execute thousands of trades per second and run on supercomputers.
Humans are following robots for a few decades now, and this is not going to change anytime soon. Technological advances and the speed the industry is changing will allow for more and more spikes in volatility to occur.
Based on this article, volatility is best measured with the Bollinger Bands indicator. The key to staying profitable is to quickly reverse a position when a fake breakout occurs.
In the best Bollinger Bands trading strategies the ndicator is so visible that it is practically impossible to miss a trend. What traders are doing is they try to identify ranging and trending conditions with the Bollinger Bands.
For this, the distance between the UBB and the LBB is key. The chart below shows the EURUSD daily time frame and the examples used in this article.
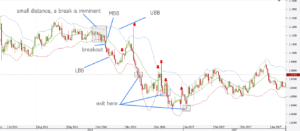
Before the bearish breakout, check the distance between the UBB and the LBB. It is the smallest distance on the whole chart, signaling the fact that a break is imminent.
It shows a period more than two months where price simply consolidated, between August and October 2015. For traders using pattern recognition to spot trades, that period shows a triangle. It forms on the EURUSD pair and the small distance between the UBB and LBB coincides with the end of the triangle.
The next step is to go and do some back-testing on historical data. But have two conditions in mind: use the same currency pair and the same time frame. The idea behind back-testing this is to see if similar small distances between the UBB and LBB lead to important breakouts that you can trade just like the example above shows.
Different currency pairs have different volatility levels, as not all pairs are moving in the same way. Liquidity plays an important role, and the trading session as well.
Successful Bollinger Bands Trading Example
Below you will see a trading example that includes the Bollinger Bands indicator. This is a video that shows how to use the indicator successfully. I entered a long trade based on bullish signals of the Bollinger Bands.
I suggest that you all see the video in order to understand how the indicator works. This is an opportunity to observe the Bollinger Bands indicator in action. And the best thing is that you can see the video for free. You only need to add your email and names to play the video.
The price started shooting up hitting the upper Bollinger Band. At the same time, the two bands were expanding signalizing that the volatility is increasing. I opened a long trade placing a Stop Loss order on a relative distance. Then, I stayed in the trade until the price broke the middle band in bearish direction. Notice that I didn’t wait for the price to break the lower band. It was enough for me to see a break through the middle band. And the reason for this is that the two bands were shrinking at that time, meaning that the volatility was decreasing.
Bottom line, I generated 0.17% profit for about 5 hours of trading.
Conclusion
To sum up, the Bollinger Bands indicator is a great tool to analyze a currency pair. It works both for scalping and for trend riding. Best results aappear by using it together with other technical analysis tools.
This way, the Bollinger Bands will act as a confirmation and will bring more confidence to the overall trading process. In the end, trading is a game of probabilities. And it is not possible to have one hundred percent winning trades.
What matters is the trading account to grow in time. Profitable trading is the result of mastering the available trading tools. The Bollinger Bands indicator is perfect for that.
START LEARNING FOREX TODAY!
share This:


Leave a Reply