Among the Japanese candlestick patterns, two stand out of the crowd: the bullish and bearish engulfing. Like almost all candlestick patterns, the bullish engulfing and the bearish counterpart, reverse trends.
Therefore, they form at the end of a trend. Either rising or falling, the trend must exist.
The Japanese candlesticks techniques have an exciting story. While traders mostly know about the Western patterns, the Japanese ones exist from a long time ago.
Back in 1700’s, the Japanese used to trade rice futures. Hence, they kept track of bullish and bearish patterns.
In documenting them, the Japanese put the base of one of the oldest trading techniques. As a comparison, the Western pattern recognition approach appeared much later.
After the Western world encountered the candlestick patterns, everything changed. Even the charting did.
Moreover, the strategies used changed too. How come to explain that today the candlestick chart patterns are so popular?
And, that the most used chart has candles? Hardly anyone uses the old Western bar chart.
In this article we’ll look at:
- The Western vs. The Japanese approach to trading
- What are the most important Japanese candlestick patterns
- Generalities of bullish and bearish engulfing patterns
- How to trade the bullish engulfing setup
- How to spot resistance for the bearish engulfing pattern
- Double tops with bearish and bullish engulfing
- Tips for trading the two patterns
And much, much more. Above all, we’ll discuss what makes the bullish engulfing and the bearish engulfing so important.
Moreover, we’ll set a concrete trading plan. Hence, the entry, the stop loss, and the take profit levels will come with the setup.
However, before going into technical setups, let’s have a look at technical analysis. What is it and what approach works best?
The Western vs. Japanese Approach in Technical Analysis
Technical analysis is the art of forecasting. More precisely, the art of using what’s on the left side of the chart.
Or, the art of looking for patterns. After all, any trading theory or concept looks at patterns.
In time, patterns formed a trading theory. The Elliott Waves Theory is the perfect example.
Ralph Elliott documented patterns like:
-
- Flats
- Impulsive waves
- Zigzags
- Triangles
- Double and triple combinations
- Double and triple flats
- Double and triple zigzags
And many other ones. Moreover, he put everything together in one of the most complex trading theory of them all.
But in the end, a closer look shows nothing but patterns that connect each other for the greater goal. What goal? Apparently, to make a profit.
Others like Gann used astrology and the power of numbers. But the aim was the same: to document patterns.
The Western approach also used:
- Head and shoulders
- Rising and falling wedges
- Triangles
- Bullish and bearish flags
And, everything above still exists today. Despite the markets changing so fast, traders still used them.
Despite trading algorithms changing the execution speed, traders confide in them. The drawdown?
Timing. Or, the time needed for a trade is too long.
As such, traders block resources and margin. Moreover, pay negative swaps and other costs only to wait until the pattern unfolds.
How about the Japanese approach? Are they different?
Do they offer a competitive advantage over the Western ones? If yes, which ones?
Generalities of Japanese Candlestick Patterns
It all starts with understanding a candle. Here we go…
The differences between a candlestick chart and the traditional Western bar chart come from the candle itself. What makes a candlestick chart so unique?
Because the Japanese place an emphasis on the opening and closing price, that’s the starting point. A candle stick pattern starts with at least one candle.
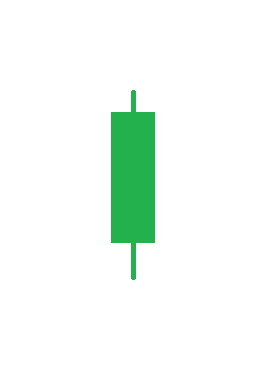
See the candle above? It has two parts:
- The real body (the thick, big, green part)
- Two shadows (the two upper and lower green lines).
Because traders associate green with bullish and red with bearish, this is a bullish candle. Hence, the opening price is at the lower part of the candle and the closing price at the top.
Hence, the next candle starts from where this one ends. And, naturally, a bearish candle has a red body and shadows.
The sum of all candles forms a candlestick chart. Simple, isn’t it?
The beauty of Japanese candlestick patterns come from the number of candles used. Typically, only two or three, or even one candle is enough for dominant reversal patterns.
Here’s a comparison:
- Hammer – one-candle reversal pattern
- Morning and evening stars – two-candle reversal pattern
- Piercing and dark-cloud cover – two-candle reversal pattern
How about the bullish engulfing and bearish engulfing? Well, two candles are enough here too.
Yes, two candles and we have the potential for a trade. How many candles a pattern like the head and shoulders needs? Or, like a wedge?
The time frame matters when dealing with bullish candlestick patterns or bearish one. The more significant, the more powerful the implications.
Most of the Japanese candlestick patterns show reversal conditions. Or, a change in the market psychology.
The Bullish and Bearish Engulfing Patterns
While the hammer, the hanging man or the Doji are individual patterns, for the bullish engulfing and its counterpart we need two.
Moreover, they must belong to opposite trends. As such:
- A bullish engulfing has a bearish (red) candle followed by a bullish (green) one
- A bearish engulfing has a bullish (green) candle followed by a bearish (red) one
In other words, the engulfing is one of the candlestick reversal patterns that have two different color real bodies.
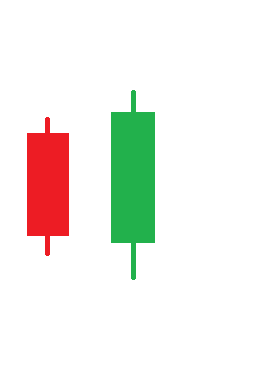
Just like above, where a bullish engulfing appears. But, there’s more to this pattern!
The market must fall. Hardly!
Any bullish engulfing pattern MUST form at the end of a bearish trend. Naturally, a bearish engulfing pattern creates at the end of a bullish one.
If no trend exists, you can scrap the pattern. How come?
The answer comes from the battle these patterns show. In a bearish trend, bulls try to take control.
As such, a robust and opposite candle forms. However, bears are unlikely to give up that easily.
The same in a bullish pattern. Bulls won’t give up that easy after such a reversal pattern.
What Makes the Engulfing Candlestick?
The engulfing candlestick happens when the second candle entirely engulfs the prior candle’s body. More precisely, it starts from the close of the previous candle and ends beyond the start of it.
Moreover, there’s a catch few traders know. The second candle’s real body must NOT engulf the previous candle’s shadow too.
When it happens, the entire bullish engulfing or bearish one losses its significance.
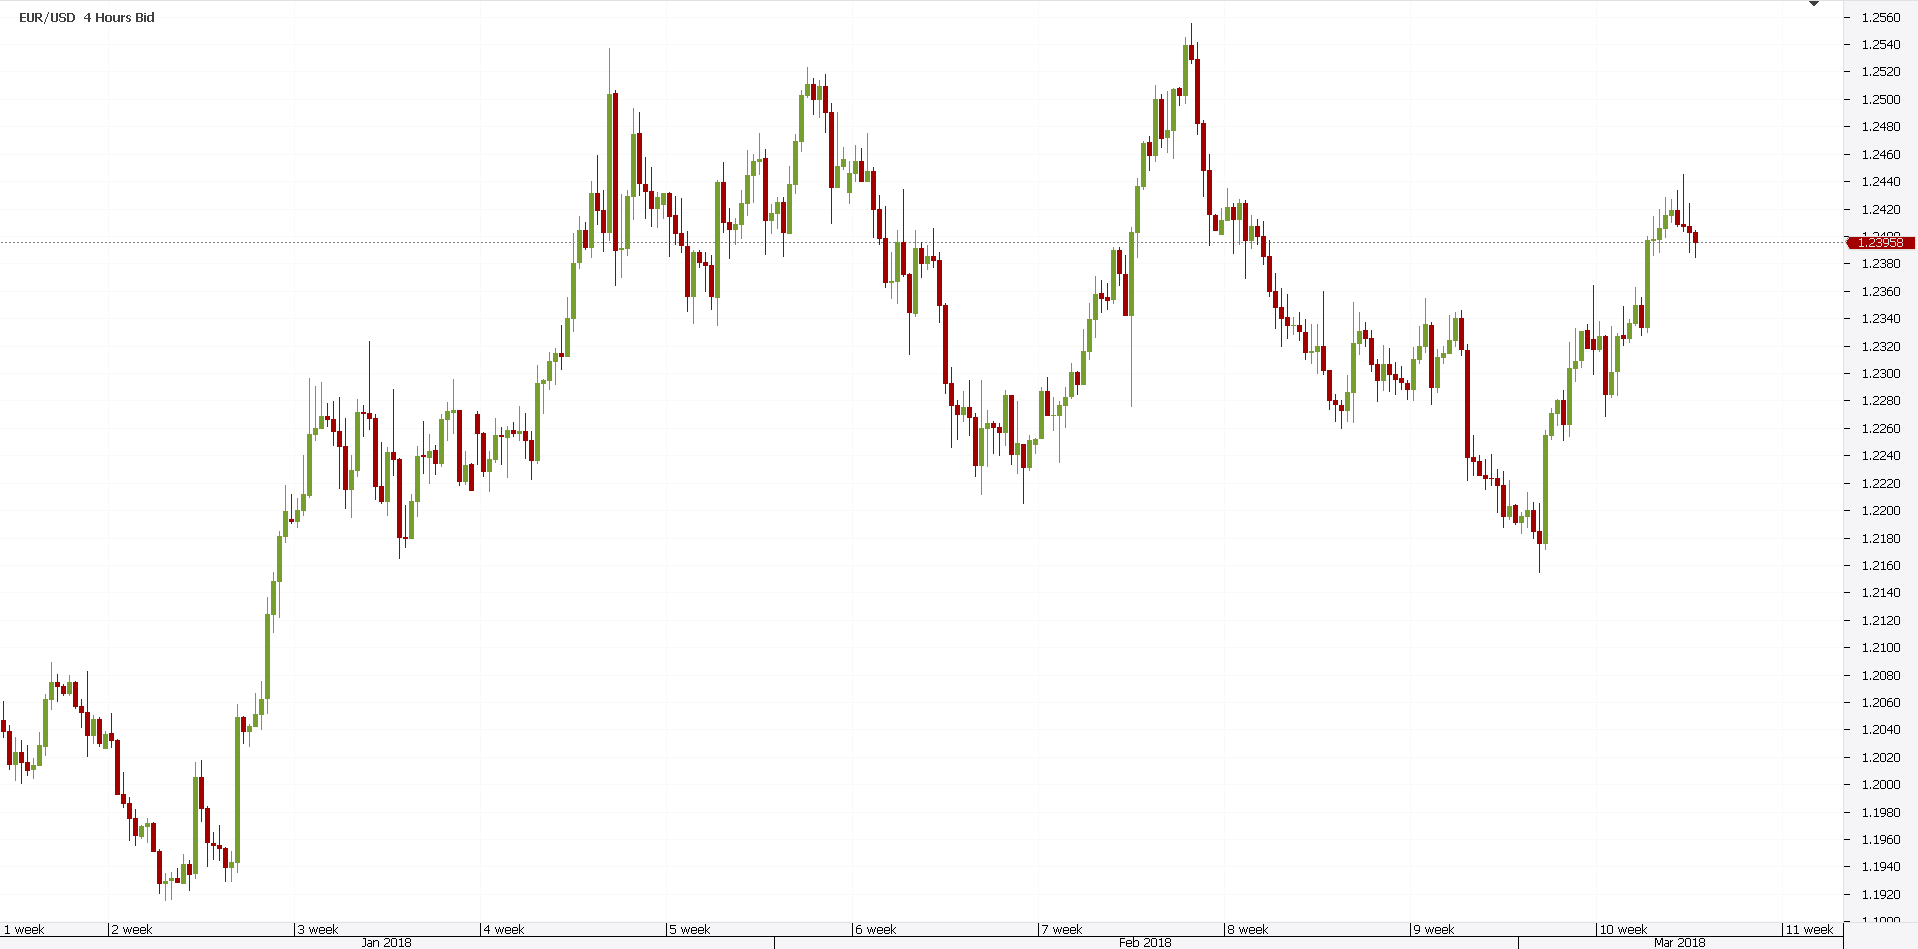
See the chart above? It shows the EURUSD four-hour time frame.
While the two patterns look like two bearish engulfing ones, look again. Pay attention to the second candle.
First, a bullish trend is present. That’s mandatory.
Second, the red candle engulfs the prior candle’s body. Excellent!
However, it closes below the previous candle’s low. Thus, engulfs the shadow too.
While in the second case the market did the reverse, in the first instance it formed merely a correction.
A small trick like the one above is enough to disqualify plenty of fake patterns. Unfortunately, many traders don’t go that deep into studying candlestick patterns. Hence, the important stuff gets lost.
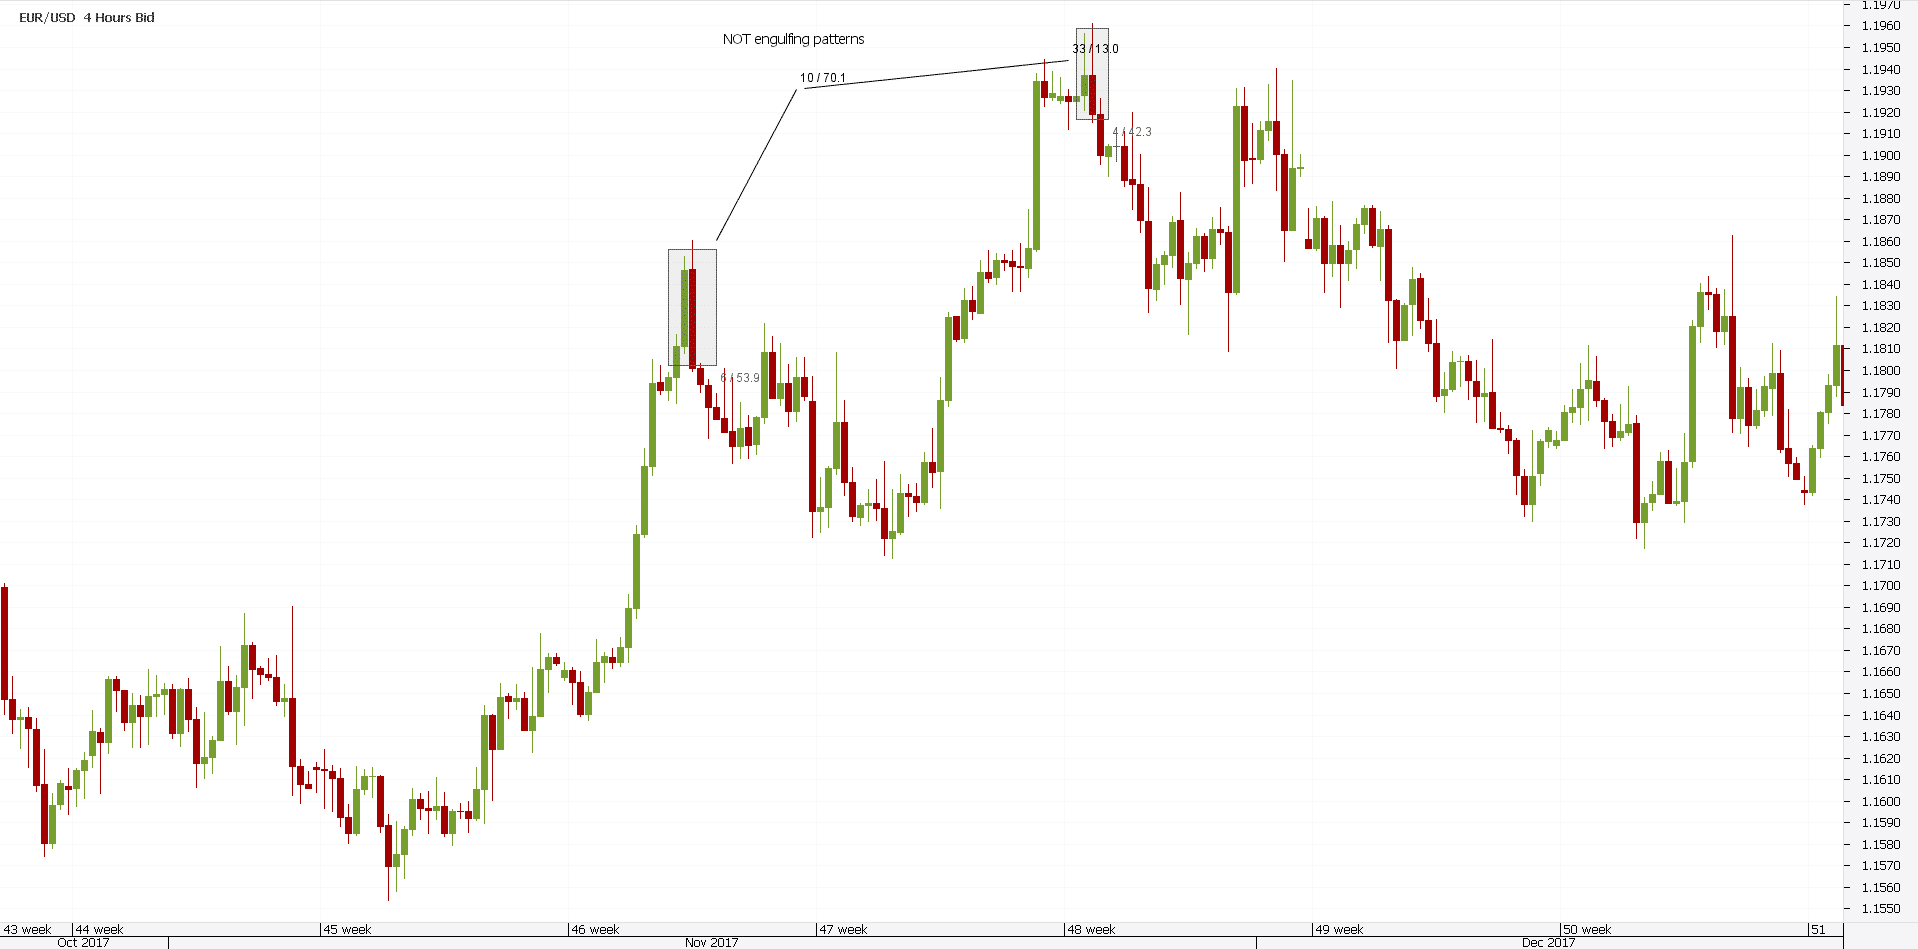
So how does the correct pattern look like? Just like below:
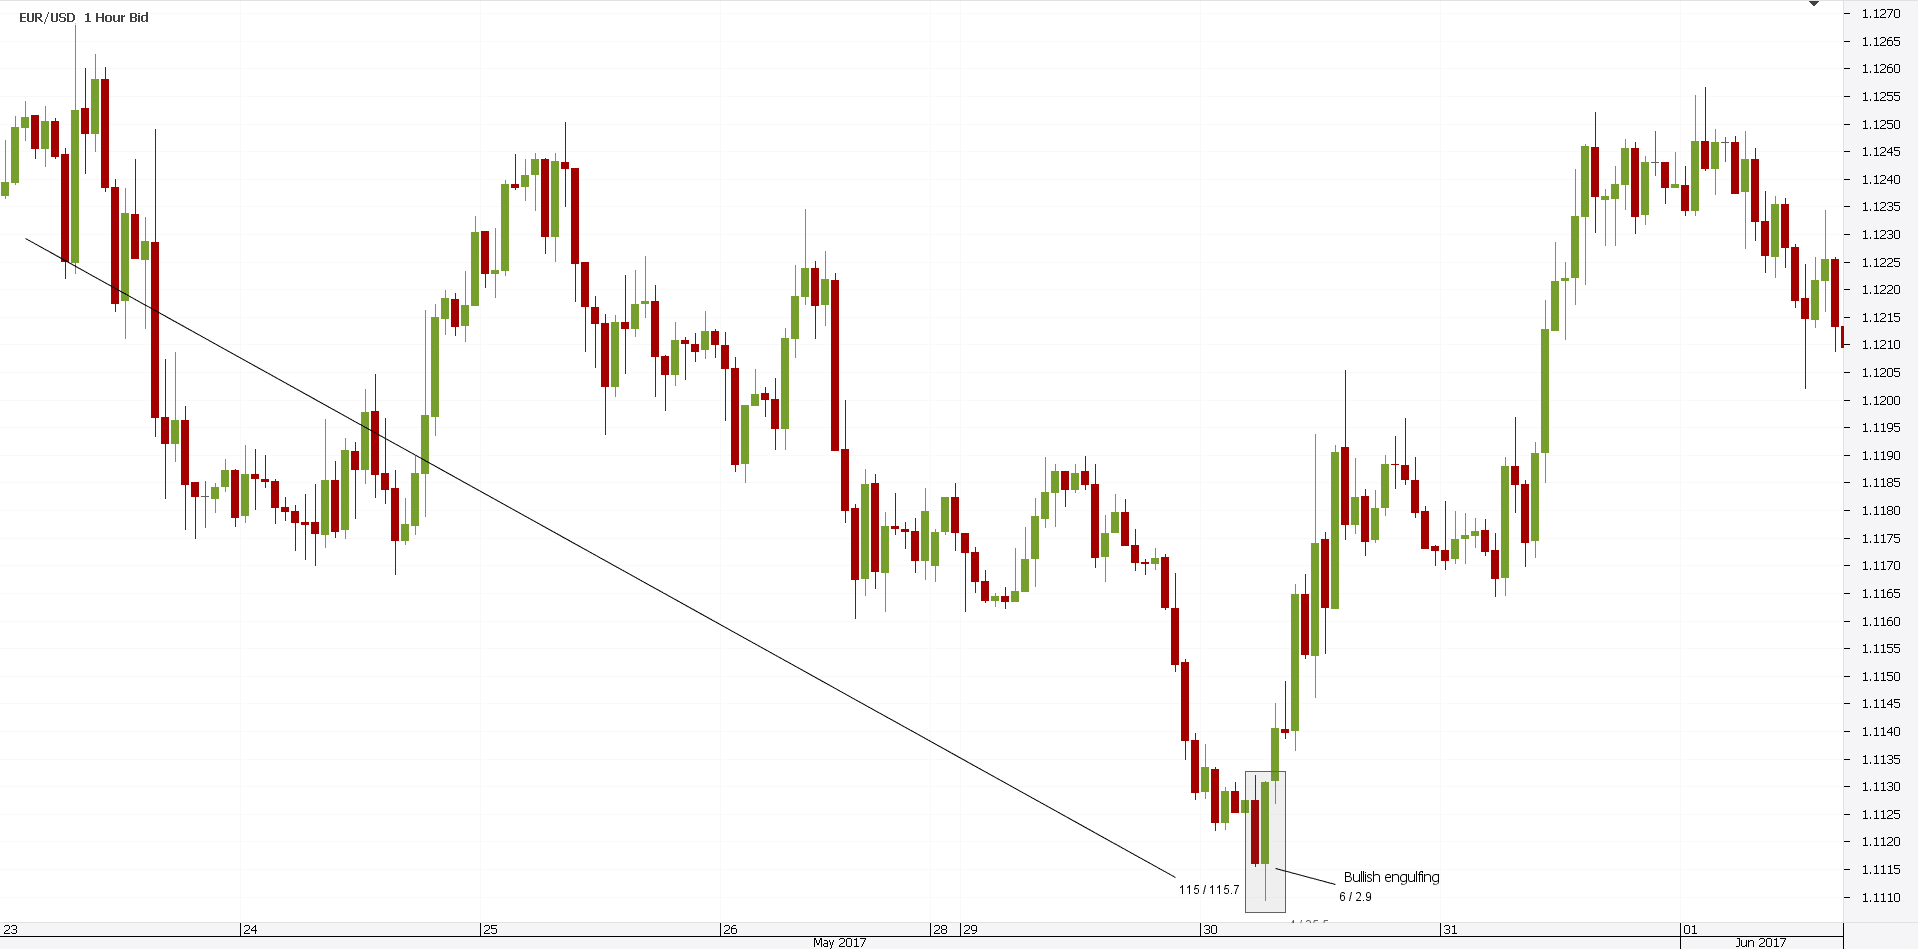
A bearish trend does exist. Next, the market forms a bullish, green candle.
It engulfs the previous candle’s body. Moreover, it closes below the highest point in the last candle’s shadow.
That, ladies and gentlemen, is one of the most powerful bullish chart patterns. A bullish engulfing!
How to Trade Such Candlestick Patterns
Let’s use the same chart like the one above. However, for proper understanding, I zoomed in to have a clearer picture.
Any trade part of any approach to market must have a:
- Defined entry
- Clear stop loss
- A target that meets specific risk-reward ratios
For the Forex market, anything between 1:2 and 1:2.5 as a risk-reward ratio will work. Greed has no place here.
If you want more, just trail the stop loss on your trade. Keep in mind that success in Forex trading comes mostly from a disciplined approach, rather than being right all the times.
Based on the above, the target depends on the risk. So, the focus shifts to the entry level. And, the stop loss.
Only after we define the risk, we apply the proper reward to it. Naturally, the bigger the time frame, the bigger the opportunities. And, the risks.
Don’t despair, though. Money management is a beautiful concept and traders adapt it to any situation. This one included.
A bullish engulfing or a bearish one are powerful patterns. Sometimes, the bears/bulls have the power to react.
When that happens, a pullback follows. However, some other times, they’re taken entirely by surprise. Hence, no pullback.
Therefore, the right approach requires a technique called scaling. To scale in a position, traders split the original entry into two parts.
FOMO (Fear of Missing Out) trade is a good enough driver to use scaling. So, the two entries are:
- One at the very close of the second candle.
- The other one comes only if the market pulls back 50% – 61.8%. Hence, traders wait for the trade or place a pending order.
Scaling into a Bullish Engulfing Pattern
Scaling has multiple advantages. Firstly, it gives trading a logical approach.
Secondly, it offers a disciplined approach. The market must come to the entry level, or else.
However, the engulfing pattern has even more qualities. Basically, after such a pattern, the trader can move on.
There’s no need to watch the market, no nothing. Just take the first trade. Next, wait for the pullback, if any.
Place the stop loss at the lowest point of the bullish engulfing. Finally, set the 1:2.5 risk reward ratio based on the distance between the first entry point and the stop loss.
The chart below shows just this. While the pattern looks valid, the pullback didn’t come.
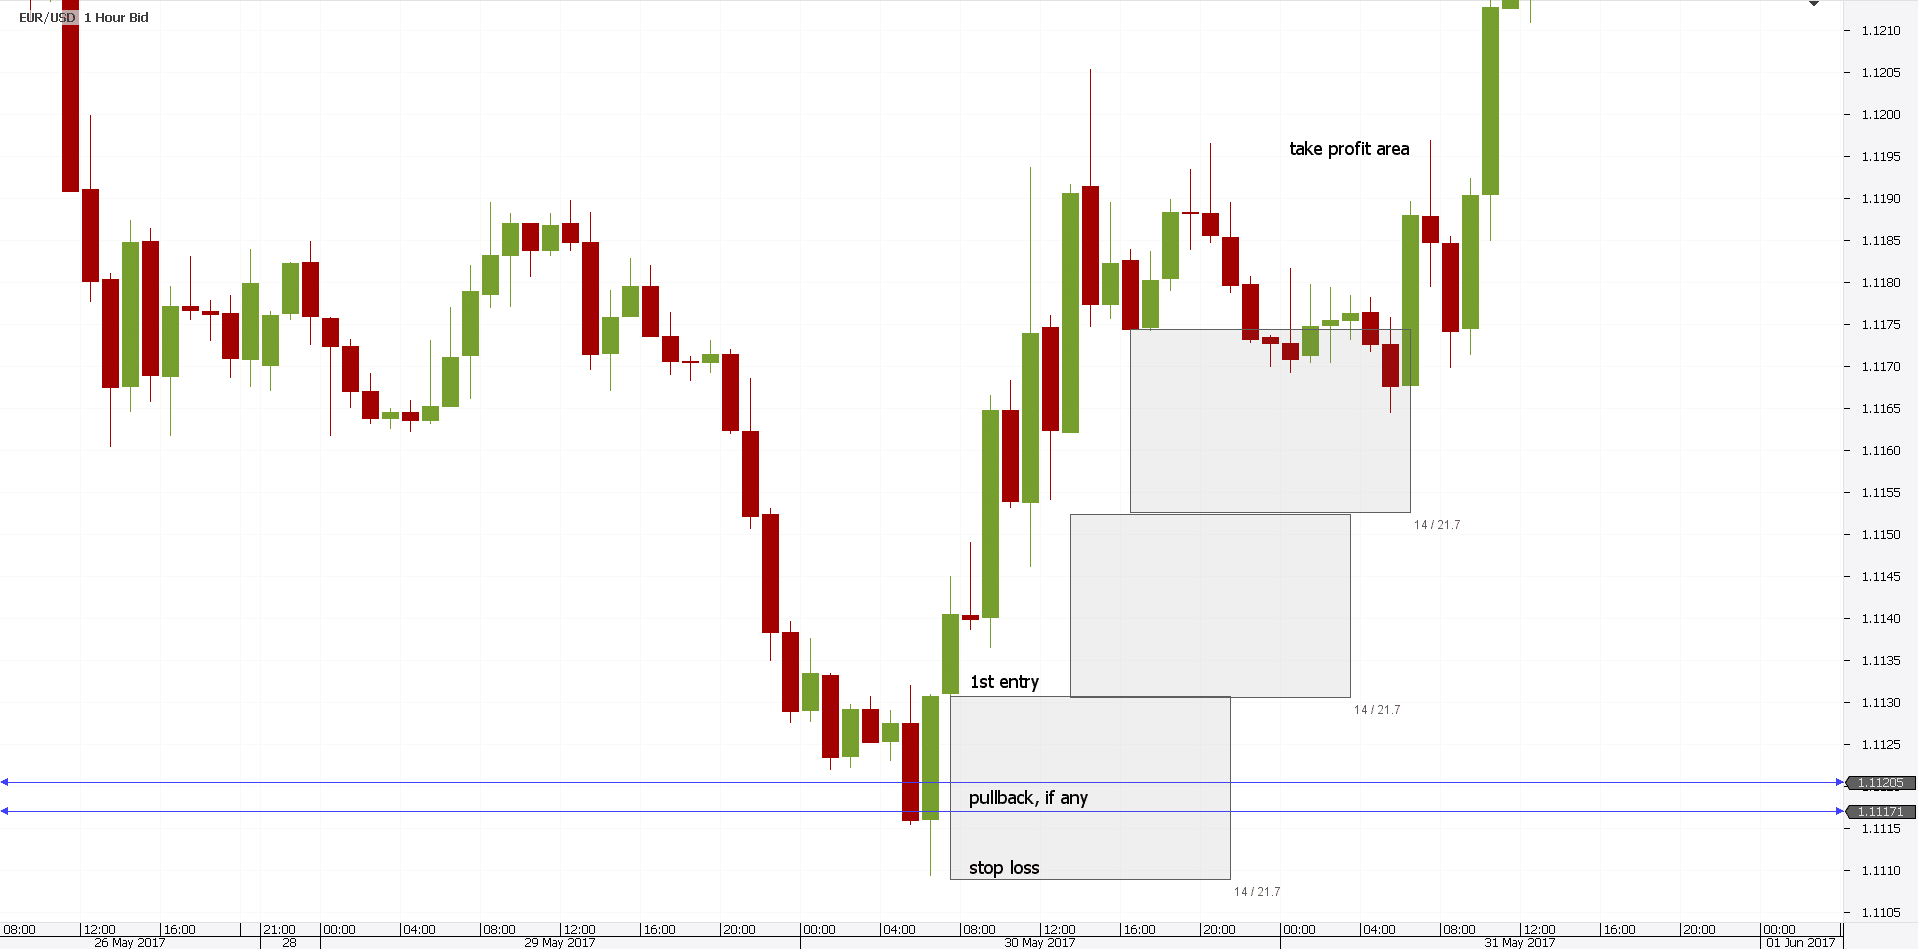
If traders waited for the pullback, they would have missed this trade. Not the case with scaling.
For the bullish and bearish engulfing patterns, the 50-50 or 60-40 represent proper ratios to scale. But, always in the first trade’s favor.
How come? Well, the example above shows it all: the risk is that the engulfing pattern is so dominant, the market won’t make any other pullback.
Confluence Areas with Candlestick Patterns
The idea behind this principle is simple. The more patterns form in an area, the better.
If you want, the principle resembles the one used in support and resistance areas. The price finds it difficult to break an area with multiple support and resistance levels surrounding it.
The same with candlestick patterns. Moreover, they work in combination with classic patterns too.
Let’s think of a double top, for instance. The price of a currency pair reverses after it makes two attempts to break higher. And, it failed both times, around the same price level.
If on any one of the tops, a bearish engulfing exists, the double top has more strength. Hence, traders combine the candlestick patterns trade with a regular double top trading.
More precisely, traders:
- Scale into a bearish engulfing trade
- Use the double top measured move to trade the classic pattern
The difference between comes from the time. Typically, the engulfing pattern reaches the take profit faster.
The same thing applies to the triple top, the head and shoulders, and even the rising and falling wedge. When an engulfing pattern forms too, the patterns confluence gives traders more faith in the upcoming trades.
Things to Consider when Trading Engulfing Candlestick Patterns
The last years saw the Forex market changing drastically. From a four-digit trading account to a five-digit quote, the leap happened virtually overnight.
Hence, the way the traders see the market changed too. Imagine how a candlestick chart changes, when the opening and closing levels change.
For this reason, candlestick patterns differ than other markets. Fantastic execution altered the patterns.
For example, a candlestick stock chart almost always has gaps. The stock market gaps frequently.
As such, the engulfing pattern appears relatively often. The second candle has enough room to engulf the previous one.
However, on the Forex market, liquidity makes such a thing impossible during the trading week. Only over the weekend the market gaps, and even then, not always.
Therefore, Forex traders must leave room for the engulfing pattern.
Another thing to remember is the Sunday candle. Some traders chose not to show the Sunday candle anymore.
Even though the market opens Sundays for a few hours in New Zealand, some brokers eliminated the Sunday candle.
Hence, before interpreting a bullish or bearish engulfing pattern on the daily chart, double and triple check if the Sunday candle appears. If yes, beware that every six candles, an engulfing pattern may emerge.
One last thing to consider. Going back to how to trade the bullish engulfing, the stop loss appears at the lows.
However, some traders disregard it on the Forex market. They use the stop-loss only if the market manages to close below that level.
Only then, in their opinion, the support in a bullish engulfing pattern disappears. Or, bears retake control of the market.
If this is true or not, it depends on your beliefs in the market. In any case, such an approach is riskier.
Conclusion
The bullish and bearish engulfing patterns offer great risk-reward ratios. On top of that, they provide a disciplined approach to trading.
Sometimes, this is what misses from a trader’s approach to market. Discipline.
The beauty of candlestick patterns is that they form on all time frames. And, on all markets that display a candlestick chart.
Keep in mind though, that the position size needs to follow the time frame. Apparently, a candlestick pattern on the monthly chart or even weekly requires a bigger stop loss than one on the four-hour chart.
However, that’s not an issue. Merely use a percentage of the trading account on any given trade (one or two percent). Next, adjust the risk to the number of pips needed for a stop loss.
Finally, calculate the right volume based on that distance. Simple, isn’t it?
The rules of trading a bullish engulfing apply to the bearish engulfing pattern too. Also, they both need the presence of a previous trending market.
If no trend exists, traders should skip the patterns. As simple as that.
To sum up, all candlestick reversal patterns show a tough battle between bulls and bears. The bigger the time frames, the tougher the war.
In the end, a part will break. Either bulls or bears, supply, and demand will rule.
But that is not a problem when a trading plan exists. Embracing losses is part of the trading game.
Learning how to lose becomes easier if you know you protect yourself from bigger losses. Otherwise, trading becomes random, and logic won’t prevail anymore.
Few patterns have the same qualities as the Japanese candlesticks ones. And, among them, the bullish and bearish engulfing patterns stand out of the crowd.
START LEARNING FOREX TODAY!
- Bearish Engulfing
- Bullish Engulfing
- Forex Analysis
- Forex candlestick patterns
- Forex Candlesticks
- FOREX Strategy
- FOREX trading
- Technical Analysis
share This:


Leave a Reply