Harmonic patterns are some of the most popular chart formations in Forex. They are characterized by geometric structures that are focused on generating a buy/sell signal for a trader.
The Butterfly pattern is defined as a harmonic reversal chart formation. After a series of measured moves, both in the direction of the overall trend and corrective moves, the price action generates a buy or sell signal. The endpoint offers a direct trading signal and marks the beginning of a correction or a new trend.
In this guide, you’ll learn:
- What the Butterfly pattern is
- How to recognize Butterfly
- What the difference between the Butterfly pattern and other harmonics is
- How to correctly draw a Butterfly pattern
- Tips on the Gartley pattern trading strategy
Table of Contents
The Butterfly Pattern
As noted earlier, the butterfly pattern is a harmonic chart formation. Harmonics are classified as geometric structures designed on Fibonacci’s sequence of numbers. As such, each leg is well-measured and has its role in the entire structure.
When all legs are combined, the Butterfly pattern is formed to generate a buy or sell signal at its endpoint. Due to its design, the Butterfly formation is less frequent than Gartley or ABCD patterns. Still, it’s a very powerful chart formation that likely signals an impending reversal in the price action.
As every harmonic pattern, the Butterfly pattern starts with the XA leg. It sets the pattern in motion with each next leg dependent on the developments during the prior leg. 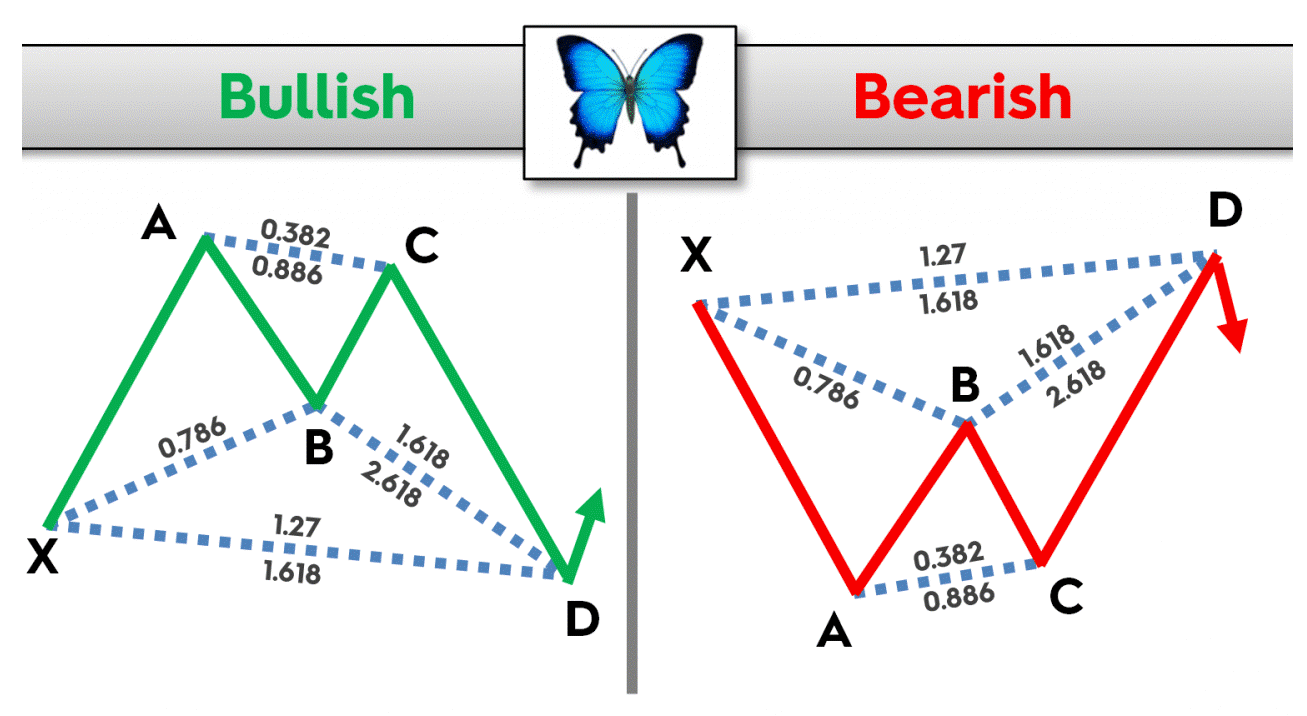
Bearish and Bullish Butterfly patterns
We make a distinction between the bearish and bullish Butterfly. The methodology in drawing both is the same, except for the fact that the former generates a sell signal, while a buy signal is initiated in the bullish version of the formation.
The structure of the Butterfly pattern is based on standard Fibonacci retracement and extension lines. As noted earlier, the XA is a trending move that sets the ground. One of its main characteristics is that the Butterfly chart formation ends outside of the initial XA move, unlike the Gartley formation, for instance.
In the next step, the point B should come as 78.6% retracement of the XA leg. In the Gartley pattern, the point B is drawn following the reversal at 61.8%. This is one of the reasons the Butterfly pattern is less frequent than Gartley, as a number of XA retracements ends before the price action reaches the 78.6% Fibonacci retracement point.
There are two potential destinations for the point C. It could either be 38.2% retracement, or alternatively, 88.6% retracement of the prior AB leg. Logically, the point D then depends on where the C was drawn.
In case the point C is 38.2% retracement of AB, then D comes around the 161.8% Fibonacci extension. Otherwise, a CD leg should end around 224.2% extension.
Ultimately, the point D is 127.2% Fibonacci extension, although deviations are extremely likely due to the wide range of possibilities for the point C. Also, don’t get confused if the point D extends up to 161.8% of the initial XA leg.
The complete structure should resemble a butterfly with widely-open wings.
Strengths and Weaknesses
When it comes to the Butterfly chart pattern’s advantages and limitations, it is no different from the rest of the harmonic chart patterns. The fact that harmonics are based on a set of rules and guidelines, this is both a strength and a weakness.
In the first case, traders are asked to simply follow this set of guidelines and wait until the point D (buy/sell) is generated. Therefore, there isn’t much work for a trader or analyst, except to mark the points on a chart.
Ultimately, the final guidelines should provide us with a trading setup. Traders get an entry point, where to exit, while a profit-taking order largely depends on their trading style and risk management. As always, we advise cross-checking generated signals with other technical indicators – Pivot points, moving averages, trend lines, etc. – before entering the market and exposing yourself to risk.
On the other hand, this rigid structure can also hurt Butterfly pattern traders. We already said that it’s not a frequent occasion to spot the Butterfly pattern. The fact that the retracement extends longer than in Gartley makes it less possible to occur. In most cases, you will see the price action fail at meeting the criteria for points B or C. This is why all harmonic patterns, and the Butterfly pattern is no different, require a lot of patience.
Ultimately, remember that harmonic patterns are usually a part of more advanced trading courses. The reason lies in the fact that it takes some time to identify and recognize these chart patterns. For this reason, harmonics – especially those that are not ABCD and Gartley – are associated with more experienced and advanced traders.
How to Spot and Trade The Butterfly Pattern
Here’s a recap of guidelines that are needed to draw the Butterfly pattern:
- XA – Trending leg that starts the trend.
- AB – The first retracement of the initial XA move is longer than in Gartley as it ideally ends at 78.6% Fibonacci retracement.
- BC – The BC leg is either 38.2% or 88.6% Fibonacci retracement of the prior leg.
- CD – If the point C is 38.2%, then the CD move should end at the 161.8% extension. If the BC leg ends at 88.6% of the prior leg, in that case the point D comes around 224.2% Fibonacci extension.
- XD – Ultimately, the point D should also correspond to the 127% or 161.8% Fibonacci extension of the initial XA leg.
Spotting and drawing the Butterfly pattern on TradingView
It is exactly for reasons that are outlined above that spotting and drawing the Butterfly pattern is not an easy exercise. However, as long as you follow the set of guidelines you should be more than fine.
As a first step, try to find a clean bullish or bearish move that can set the formation in motion. As a next step, look for any retracement of the XA move that ends around 78.6%. Of course, a certain degree of flexibility is needed in this case.
You will then continue to follow the set of guidelines described above until you identify a chart pattern that resembles the Butterfly pattern. Of course, the difficult part starts with the point C, which kind of eliminates a lot of potential harmonic formations up to that point.
In the image below, we show how to draw the Butterfly patterns on the TradingView, an easy-to-use platform that offers tools to draw harmonics. To select this tool, click on the left-side image showing the harmonic pattern which will show a drop-down menu with a list of harmonic options.
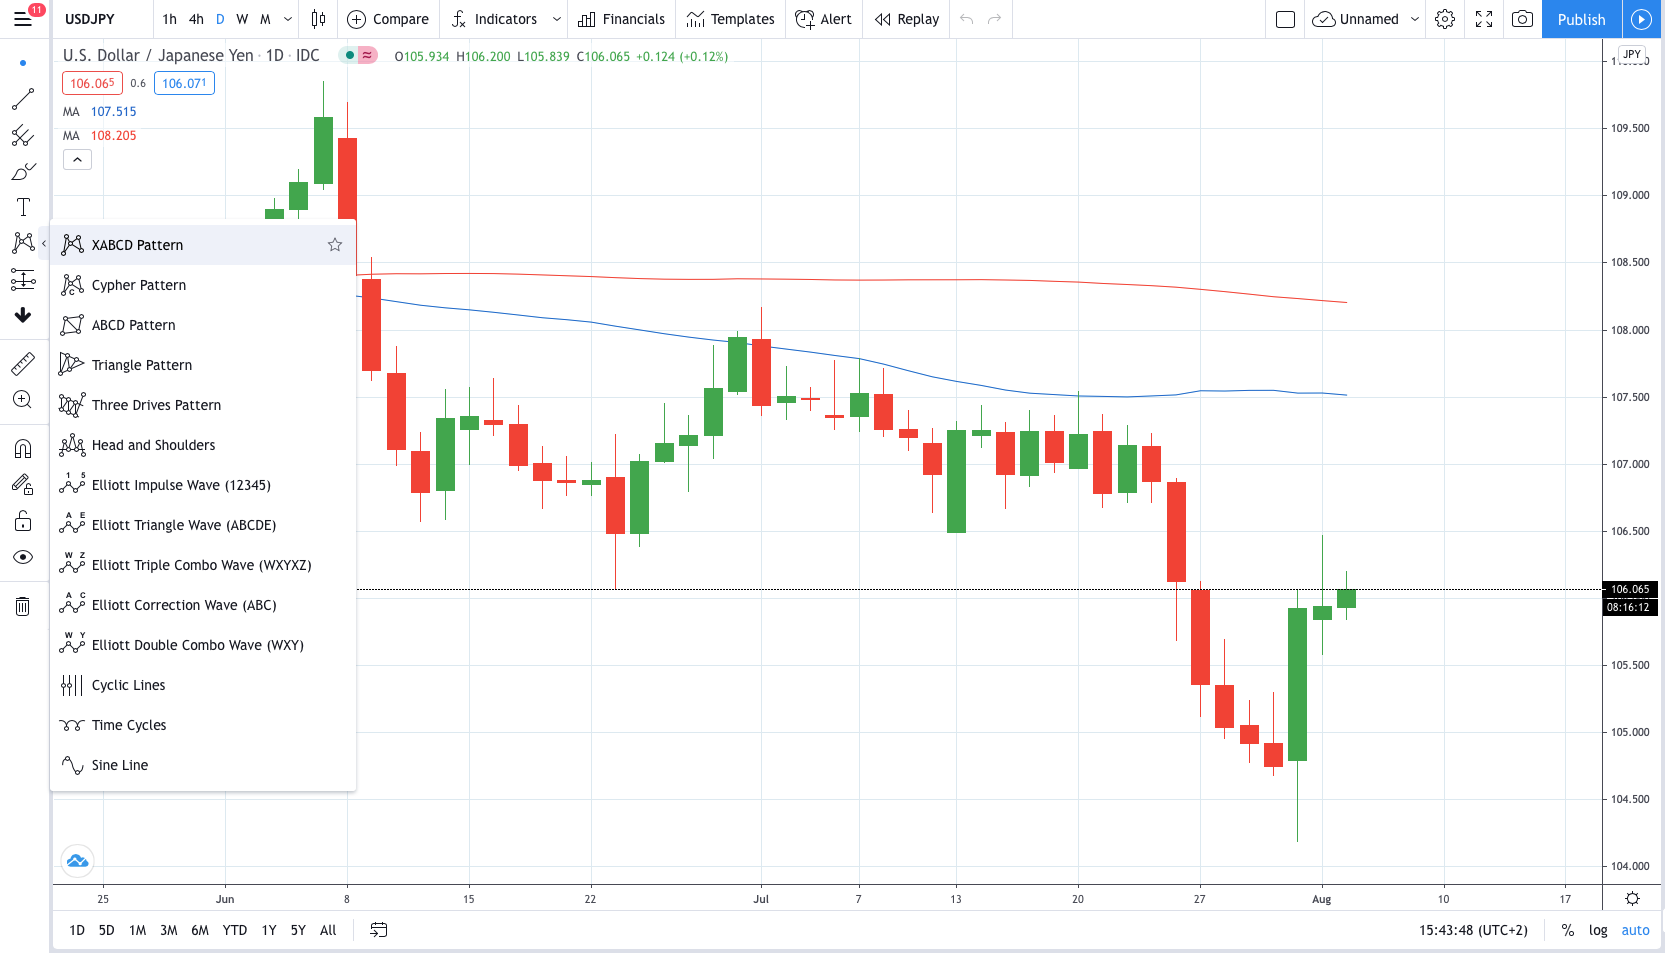
How to draw the Butterfly pattern on the TradingView platform
Select “XABCD Pattern” from the list as this is a general structure that can be applied for all harmonic patterns. You will be required to connect five dots before you can see where the point D appears.
As you move the cursor around the chart, the platform automatically calculates percentages of retracements and extensions. Follow the guidelines and see whether they correspond to moves on the chart. The drawn harmonic pattern should correspond to the set of guidelines as much as possible, in order for the point D to be a legitimate trading signal.
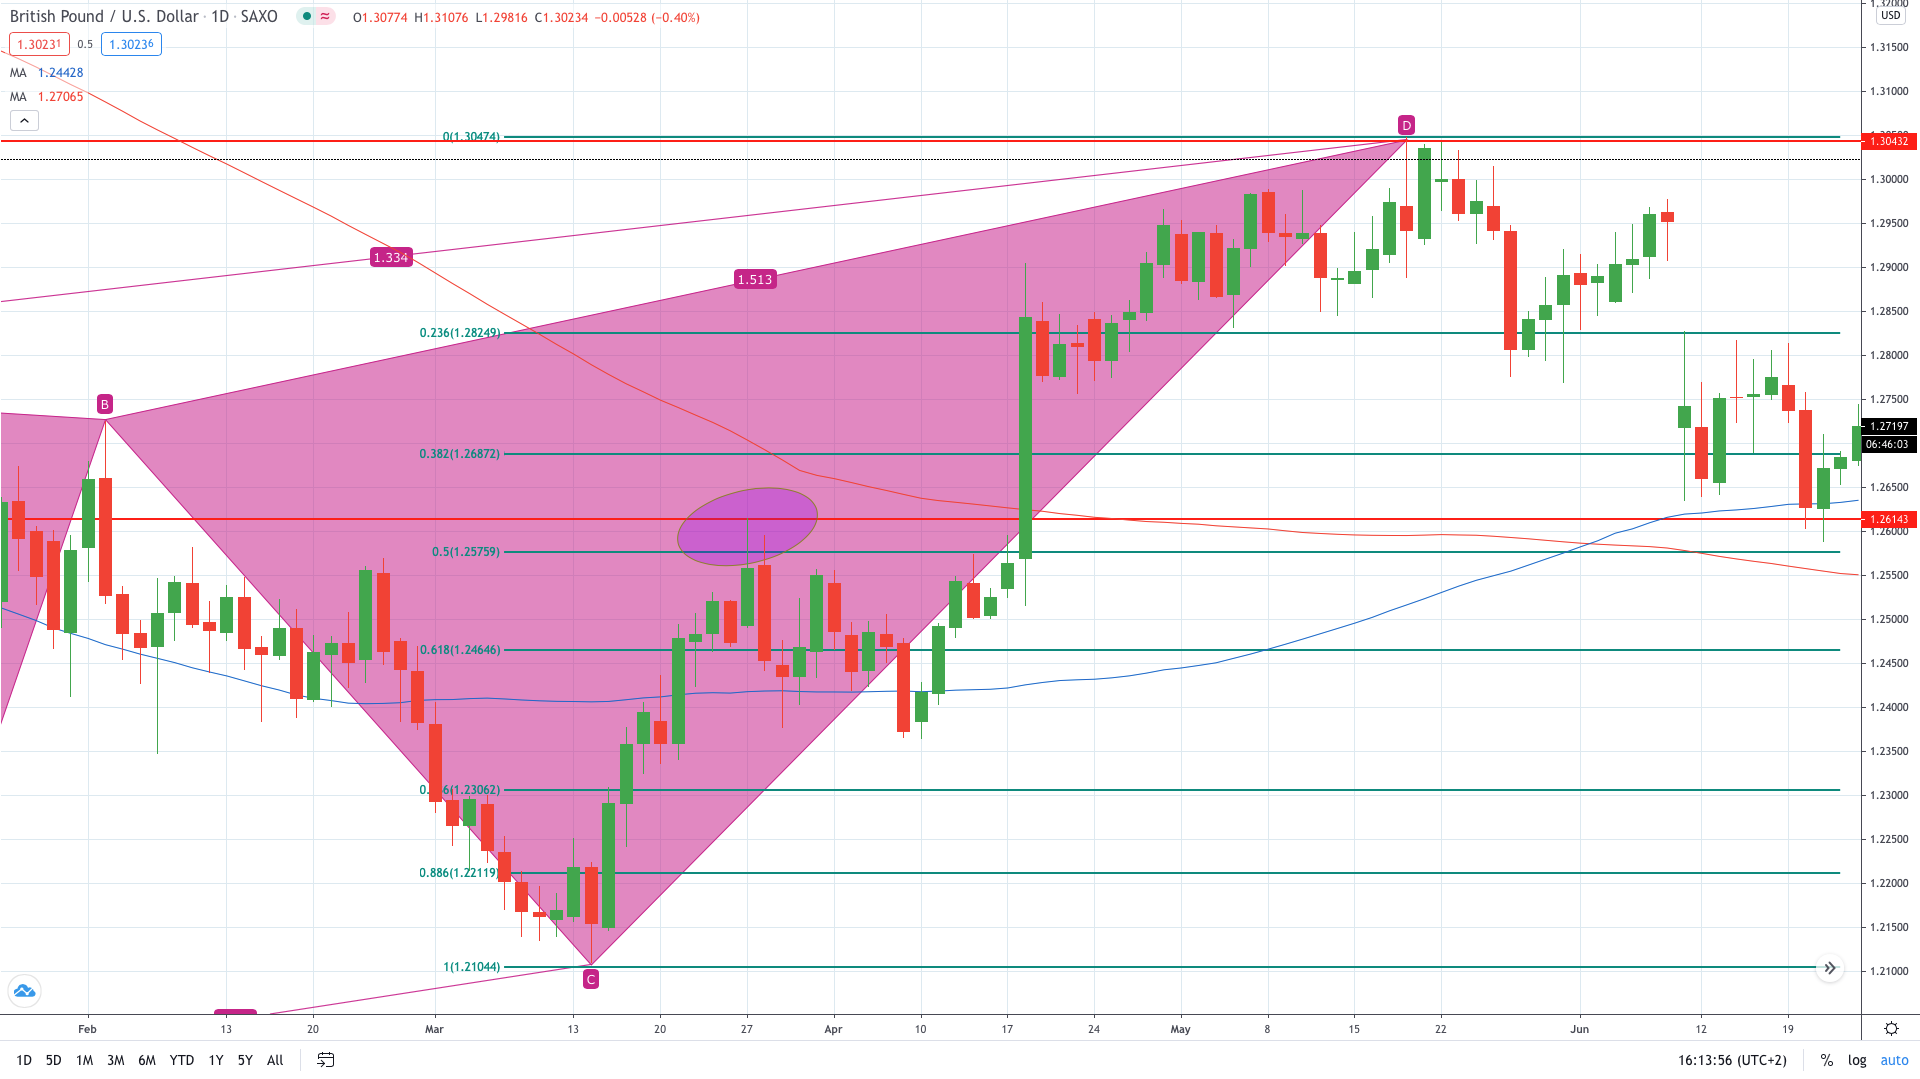
By applying the same method on the TradingView platform, we proceed to connect dots on a GBP/USD daily chart that initially looks to resemble the Butterfly pattern. The price movements trade sideways before the downward move occurs and takes the price to new short-term lows.
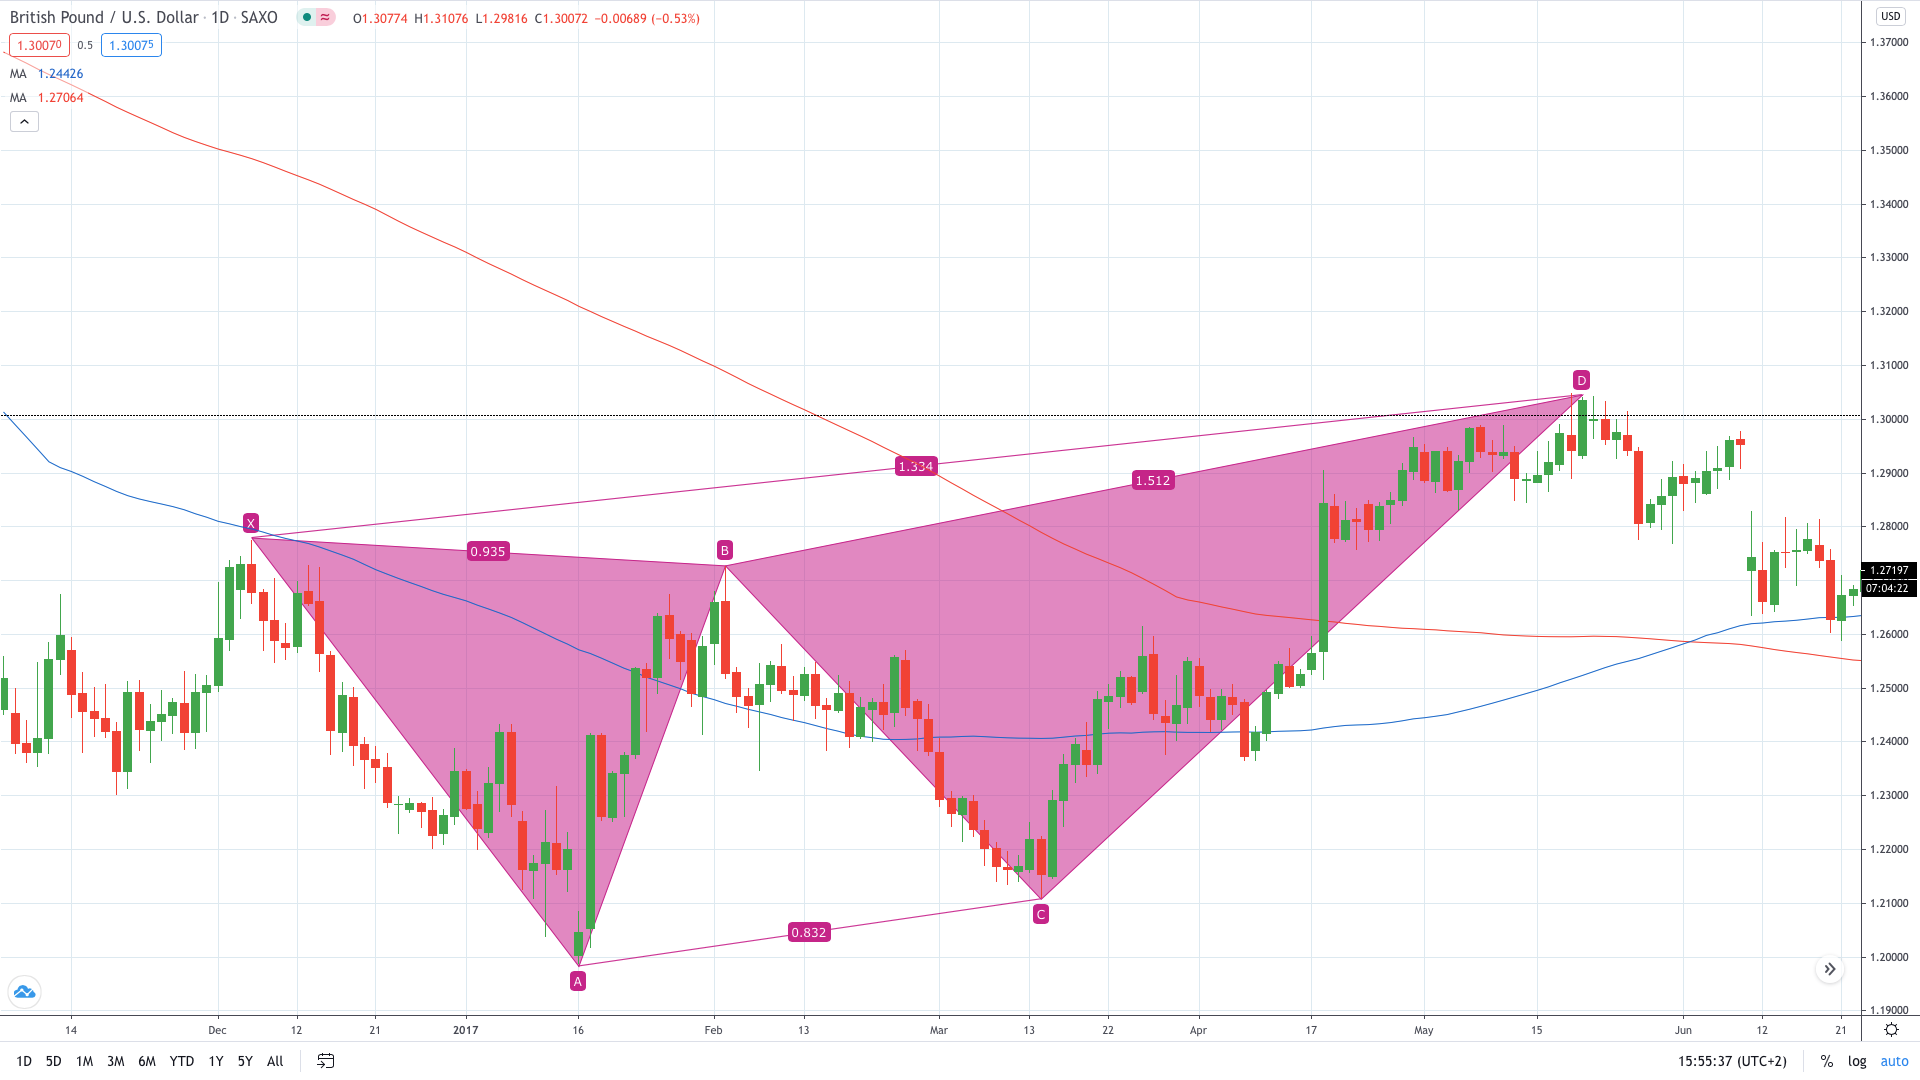
Spotting and drawing a bearish Butterfly pattern on GBP/USD daily chart (TradingView)
The price action then rebounds strongly from a low, almost erasing all losses from the XA leg. A bearish turn that takes place helps us to determine the point B on the chart. Following the same line of thought, the point C is marked once the price action makes a bullish reversal.
In this particular case, nearly all points are very close to the desired targets set. It’s only the point B that retraces higher than the desired 78.6%, while still keeping the overall structure of the formation intact.
Finally, the point D is in place once the price action rotates lower from the fresh highs set. This is a tricky point when it comes to trading the harmonics as determining the point D is not quite straightforward.
Some traders prefer to open a short position as soon as the price action extends to 127.2% of the XA leg. This means that you won’t miss out on a trade, but this is problematic from the risk management point. Remember, the price action could eventually extend all the way to 161.8% Fibonacci.
Alternatively, you wait for another signal generated by a different technical indicator to point to a potential reversal. For instance, the price action may hit a major moving average in the region between 127.2% and 161.8%, or, a certain candlestick formation may signal an impending reversal.
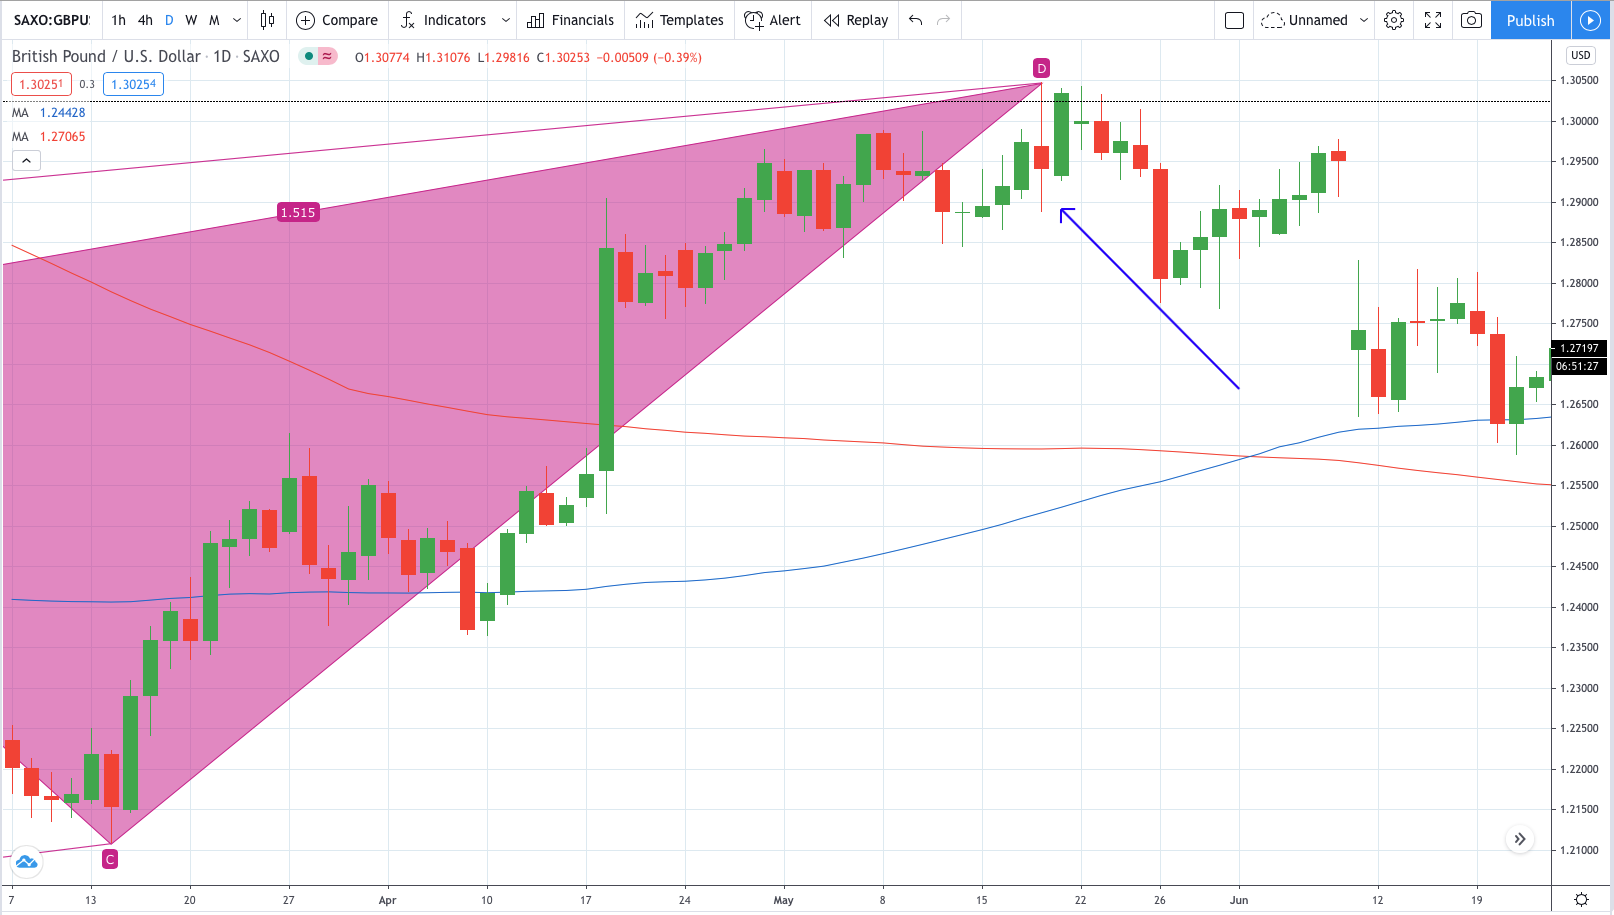
The bearish candlestick formation signals an impending reversal (TradingView)
In this case, we see a bearish candlestick formation that signals an impending reversal. We use this signal to assume that the reversal is taking place as we mark the point D on the chart.
Trading the Butterfly Pattern
Once we identify the point D, we move to define all elements of the trading setup. A sell position opened near the recent swing high. The stop loss is placed either above the swing high or above the 161.8% Fibonacci extension line. This way, you will allow for the price action to extend to the north, although the associated risk will increase further.
Trading a bearish Butterfly pattern on GBP/USD daily chart (TradingView)
We use the same approach – as we did to find the point D – to calculate our potential take profit. The horizontal support (the red line) is seen as a preferred profit-taking area as this support line may prevent a deeper pullback. Eventually, you could also use Fibonacci retracements, any from 38.2% to 61.8%.
In this case, the price action retraced to around 50% of the CD leg. Therefore, our entry is set where the bearish candle closed – at $1.2950. The stop loss is located at $1.3070, over 20 pips above the highest point of the swing high.
Looking lower, the horizontal support is at $1.2615, around which we place a profit-taking order. Hence, we are risking 120 pips to make over 330 pips. Eventually, GBP/USD retraces to $1.2589, before eventually returning higher. This makes our risk-reward in this trade of nearly 1:3 – a very attractive trading setup.
Summary
- The Butterfly is a harmonic chart pattern based on Fibonacci retracement and extension lines.
- The aim of the entire structure is to generate a point D – a sell signal in bearish Butterfly and a buy signal in the bullish version of the Butterfly formation.
- The butterfly is generally classified as a reversal pattern.
- The butterfly pattern usually offers an attractive trading setup due to the clearly-defined structure.
- The butterfly is a less frequent chart formation than Gartley, which is the biggest weakness of this pattern.
Frequently Asked Questions:
How many harmonic patterns are there?
The most frequently used harmonic patterns are Gartley, ABCD, Bat pattern, Butterfly pattern, Crab pattern, Cypher pattern. and the Shark pattern. Traders mostly focus on trading Gartley and ABCD patterns as they are the most frequent harmonic chart patterns.
Which harmonic pattern is the best?
There’s no single harmonic pattern that is proved to work the best. Gartley and ABCD are popular, but this doesn’t necessarily mean that they are the most attractive harmonic patterns. Traders should focus on learning how to properly trade harmonic formations.
Are harmonic patterns profitable?
The answer is yes, as they offer attractive trading setups. Otherwise, their scarcity would make them less popular. However, their reliability and efficiency make harmonics very profitable chart formations for trading.


Leave a Reply