On September 10th, the CAD/CHF broke and closed below the uptrend trendline as well as the 200 Exponential Moving Average. On the pullback up, the uptrend trendline and the 200 EMA were both rejected cleanly, strongly suggesting bearish domination.
Disclaimer: The analysis presented in this article is for educational purposes only and should not be considered as financial advice.
This analysis was done on MetaTrader 4.
Click below to open a Free Demo Account with our trusted brokers:
Analysis Details:
CAD/CHF symbol on the MT4 platform
Type: Bearish
Key support levels: 0.6818, 0.6775
Key resistance levels: 0.6917
Currently, CAD/CHF is trading near the key resistance area between 0.6900 – 0.6920, which previously also was the resistance as well as support. As long as 4-hour closing prices remain below 0.6920 level, CAD/CHF is expected to move down strongly, potentially by 130 pips from the current price.
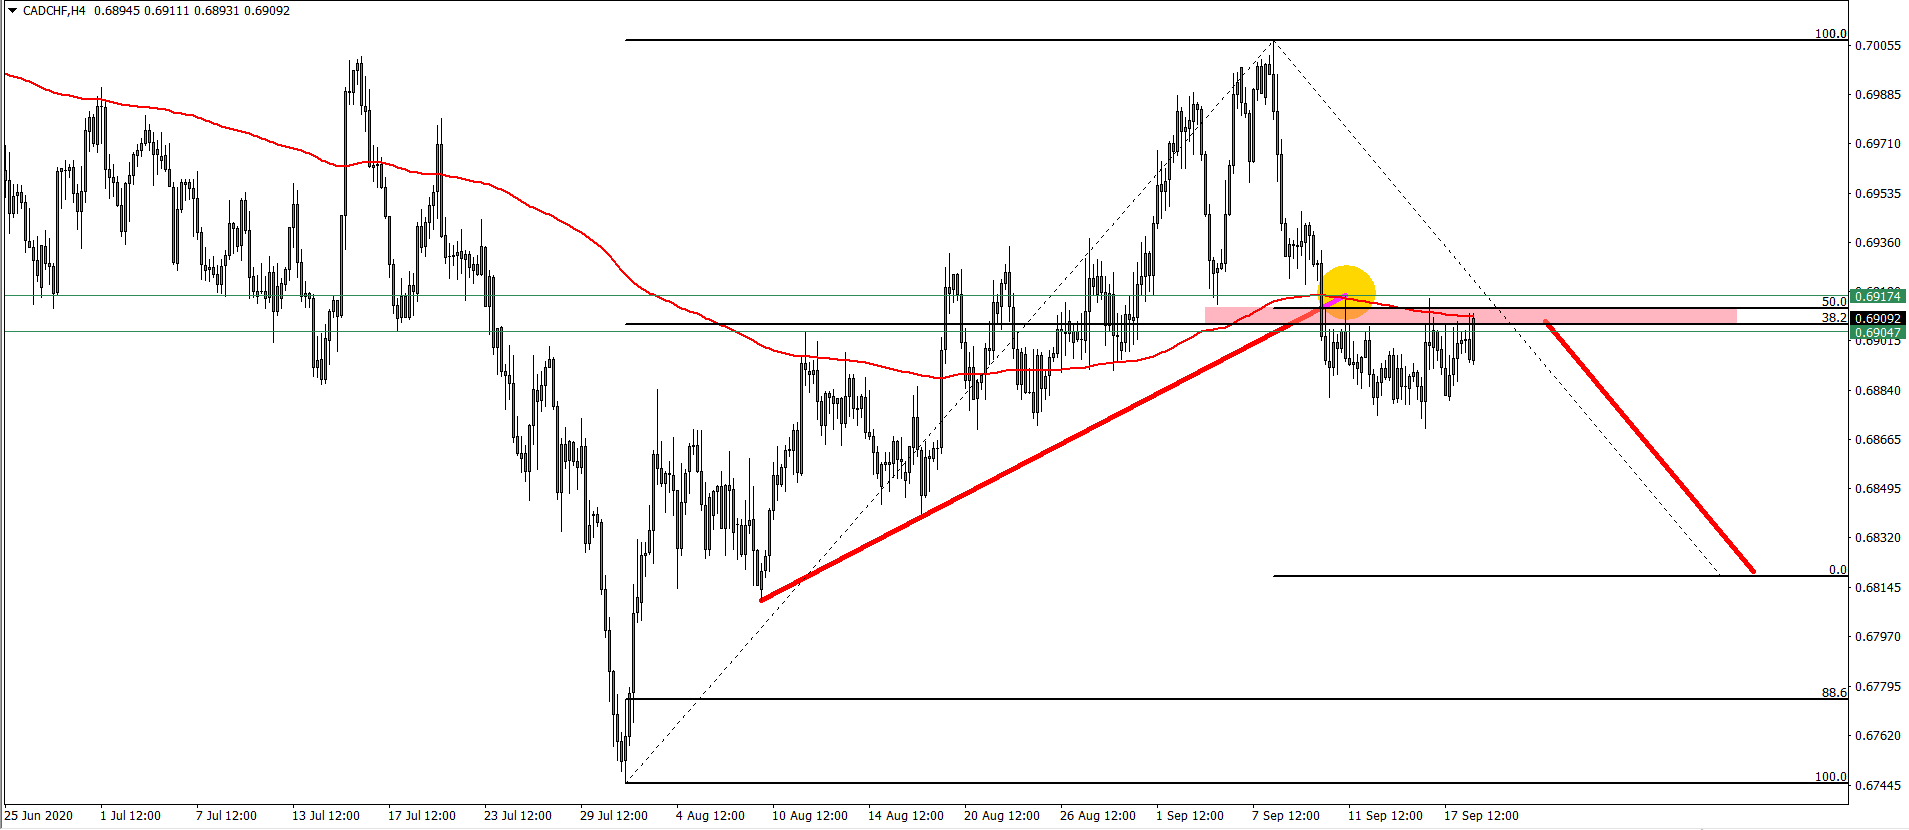
There are two key support levels to watch if the downtrend will take place. The first one is 0% Fibs at 0.6818, which suggests that distance from the top to the trendline breakout point will equal the distance from the breakout, down to 0% Fibs. The second and probably the most important support level is located at 88.6% Fibonacci retracement level at 0.6775. Usually, this Fibonacci level acts as the final support or resistance, depending on the trend.
To get exclusive Trading Signals, join our Premium Channel just for $29 per month


Leave a Reply