In this article, we will share a candlestick cheat sheet that will help you improve your price action technical analysis. In addition, you will be able to identify the top 5 candlestick patterns and improve your strategy.
Forex candlestick patterns are special on-chart formations created by one, or a few, Japanese candlesticks. There are many different candlestick pattern indicators known in Forex, and each of them has a specific meaning and tradable potential.
What are the Forex Candlestick Patterns?
Forex candlestick patterns are special on-chart formations created by one, or a few, Japanese candlesticks. There are many different candlestick pattern indicators known in Forex, and each of them has a specific meaning and tradable potential.
Forex traders constantly use candlestick chart patterns for day trading to foretell potential price moves on the chart. Forex candlesticks help them guess where the price will go and they buy or sell currency pairs based on what the pattern is telling them. Therefore, you should also spare the time to examine the best candlestick patterns for intraday trading if you want to be a successful Forex trader.
Watch this free video below to get more details of how Japanese Candlesticks are situated to form charts:
Types of Candlestick Patterns for Day Trading
There are two types of Forex candlestick patterns for day trading – continuation and reversal candle patterns. Let’s now briefly go through each of them.
Continuation Forex Candle Patterns
Continuation Forex candle patterns are the ones that come after a price move and have the potential to continue the price action in the same direction. The truth is that continuation candle patterns are not very popular in Forex trading. The reason for this is that there are not many of them. In comparison, reversal candlestick patterns dominate the Forex charts.
Reversal Forex Candle Patterns
The reversal Forex candle patterns are the ones that come after a price move and have the potential to reverse the price action.
In comparison with continuation candle patterns, the reversal candle pattern indicators represent the majority of the candle patterns you will meet on the Japanese candlestick charts.
Candlestick Cheat Sheet with 5 Patterns Explained
So, you should not be surprised that the best 5 candlestick patterns for day trading are reversal patterns.
5 of the most profitable Forex candlestick indicators are:
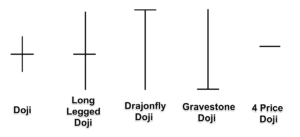
- The Doji Family
- Tweezer Tops / Tweezer Bottoms
- The Hammer Family
- Three Inside Ups / Three Inside Downs
- Evening Star / Morning Star
Notice that I have separated these into “families” or into their bullish and bearish versions since they refer to the same thing but upside down.
Let’s now explain each of these with examples.
Doji Candle Patterns
The Doji candle family consists of single candle formations where the price action opens and closes at the same price. Every Doji candlestick symbolizes the equalization of the bearish and the bullish forces. This means that the current price trend is becoming exhausted and it is likely to be reversed.
The Doji Forex pattern could appear after bullish moves as well as after bearish moves. Despite that, the function of the pattern – to reverse the price action – stays the same.
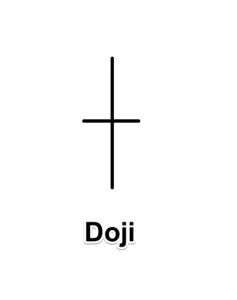
As the Doji candle closes at the same level as it opened, the candle looks like a dash. Yes, but this is not the only Doji candle pattern known in Forex trading. There are other Doji candlesticks too. Below you will find the most popular Doji candlestick pattern types.
The confirmation of all of the Doji patterns comes when with the finish of a candle that closes in the direction that is opposite to the trend. This candle is the first indication that the reversal is beginning.
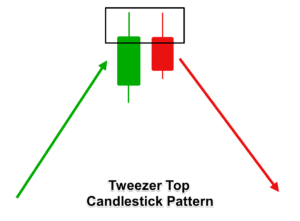
Tweezer Tops and Tweezer Bottoms
The Tweezer Tops is a double candlestick pattern Forex indicator with reversal functions. The pattern comes at the end of bullish trends and signals the beginning of a fresh bearish move.
The first candle of the Tweezer Top candlestick formation is usually the last of the previous bullish trend. The second candle of the Tweezer Top pattern should have an upper shadow that starts from the top of the previous shadow. At the same time, the upper shadows of the two candles should be approximately the same size.
The Tweezer Tops has its opposite equivalent, called Tweezer Bottoms. The Tweezer Bottoms Forex pattern has a completely opposite structure. The pattern comes after price drops and signals upcoming bullish moves.
The first candle of the Tweezer Bottom is usually the last candle of the previous bullish trend. The second candle of the Tweezer Bottom pattern should have a lower shadow that starts from the bottom of the previous shadow. At the same time, the lower shadows of the two candles should be approximately the same size.
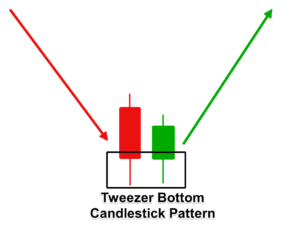
The confirmation of the Tweezer Candlesticks comes with the candle that manages to close beyond the opposite side of the pattern. This candle is a strong indication that the trend is reversing.
The Hammer Family
The Hammer candlestick pattern is a single candle pattern that has three variations depending on the trend they take part in. Every Forex candlestick that belongs to the Hammer family has a small body and a big upper or smaller shadow. At the same time, the other shadow is either missing or very small.
If you are wondering if the name of the Hammer candle family comes from the structure of the candles, you are correct. The candles in the Hammer family are four, and they all have reversal character.
Let me introduce you to these candles now:
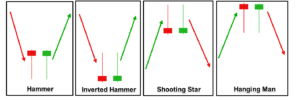
I have shown the bullish and the bearish version of each candle. Notice that it doesn’t matter which of the two candles you receive. The meaning is the same.
Hammer Candlestick Chart Pattern
The first candle on the sketch is the Hammer candlestick chart pattern. The candle emerges during bearish trends and signalizes that a bullish move is probably on its way. The Hammer candle has a small body, a long lower shadow and a very small or no upper shadow. Traders use the Hammer candlestick to open long trades.
Inverted Hammer Candlestick Pattern
The Inverted Hammer candle has absolutely the same functions as the Hammer candle, but it is upside down. The Inverted Hammer has a small body, a big upper shadow, and a small or no lower shadow. Same as the Hammer candle, the Inverted Hammer candlestick comes after bearish moves and signalizes that a fresh bullish move might be emerging. Traders use the Inverted Hammer pattern to open long trades.
Hanging Man Candle Pattern
The Hanging Man candlestick is absolutely the same as the Hammer candlestick pattern. It has a small body, a long lower shadow and a very small or no upper shadow. However, the Hanging Man Forex pattern occurs after bullish trends and signalizes that the trend is reversing. As a result, the Hanging Man candle pattern is used by traders to open short trades.
Shooting Star Candlestick Pattern
The Shooting Star candle pattern has the same structure as the Inverted Hammer candle. It has a small body, a long upper shadow and a tiny or no lower shadow. However, the Shooting Star Forex candle comes after bullish trends and signalizes that the bulls are exhausted. As a result, a reversal and a fresh price decrease usually appear afterward. Therefore, Shooting Star candlestick chart patterns act as a signal to short Forex pairs. The confirmation of the Hammer, Inverted Hammer, the Shooting Star and the Hanging Man comes with the candle which closes in the direction opposite to the trend. This candle is likely to be the first of an eventual emerging trend.
Three Inside Up and Three Inside Down Candlestick Patterns
The Three Inside Up is another reversal candle pattern indicator that comes after bearish trends and foretells fresh bullish moves. It is a triple Forex candlestick pattern that starts with a bearish candle. The pattern continues with a bullish candle, which is fully engulfed by the fist candle, and which closes somewhere in the middle of the first candle. The pattern ends with a third candle, which is bullish and breaks the top of the first candle.
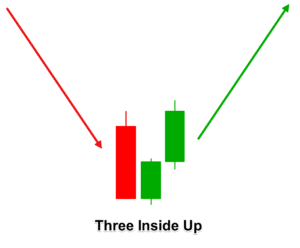
The first candle of the Three Inside Up candle pattern is usually the last candle of the previous bearish trend. The Three Inside Up has its opposite equivalent – the Three Inside Down candlestick pattern. The Three Inside Down is a mirror image of the Three Inside Up. It comes after bullish trends and usually begins fresh bearish moves.
The Three Inside Down candlestick pattern starts with a bullish candle, which is usually the last of the previous bullish trend. The pattern continues with a second candle – a bearish one that is fully engulfed by the first candle and closes somewhere in the middle of the first candle. The pattern then continues with a third candle, which is bearish and goes below the beginning of the first candle.
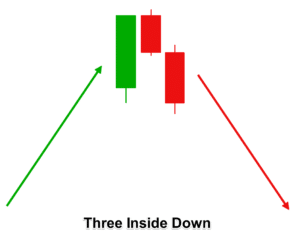
The confirmation of the Three Inside Up and the Three Inside Down candlestick patterns comes with the third candle that closes beyond the beginning of the first candle of the pattern.
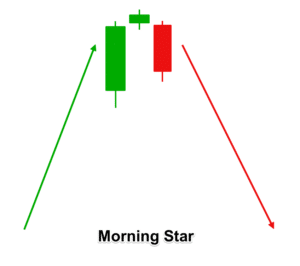
Morning Star Candle and Evening Star Candle Pattern
The Morning Star candle pattern is another three-bar formation that has reversal functions. The Morning Star candlestick chart pattern comes after bullish trends and signals an eventual price reversal.
The pattern starts with a bullish candle that is long, and it is usually the last candle of the previous bullish trend. Then it continues with a very small candle that could sometimes even be a Doji star, and it is possible that this candle sometimes gaps up. The third candle of the pattern is bearish and goes below the middle point of the first candle, and it could also gap down from the second candle.
The opposite equivalent to the Morning Star Forex figure is called Evening Star candlestick pattern. The Evening Star Forex figure is a mirror version of the Morning Star that comes after bearish trends and signals their reversal.
The Evening Star candle pattern starts with a bearish candle that is long, and it is usually the last candle of the previous bearish trend. Then it continues with a very small candle that could sometimes even be a Doji star, and it is possible that this candle sometimes gaps down. The third candle of the pattern is bullish and goes above the middle point of the first candle of the pattern. It could also gap up from the second candle.
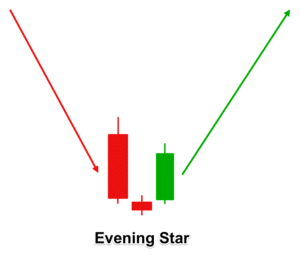
The confirmation of the Morning Star and the Evening Star candlestick reversal patterns comes with the end of the third candle. If the pattern emerges meeting the requirements of the three candles, then you can trade in the respective direction.
Candlestick Cheat Sheet Summary
I have created a simple candlestick pattern cheat sheet for your convenience. It contains all the sketches shown above.
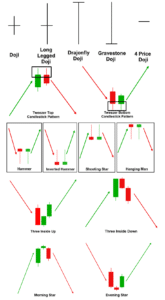
You can use these Forex candlestick patterns for day trading by simply peeking at the cheat sheet to confirm the patterns.
Real Examples of Candle Pattern Indicators
Now that you are familiar with the structure of the best candlestick patterns for intraday trading, I suggest that we go through a couple of chart examples of how these work in trading.
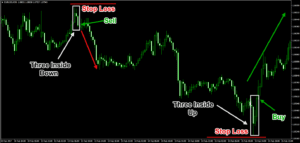
The first example on the chart shows the Three Inside Up and the Three Inside Down chart pattern indicators in action. Notice that after each of these two patterns the price action creates a turning point and the price reverses the previous trend.
You should open a short trade at the Three Inside Down pattern and a long trade at the Three Inside Up Pattern. You should place your Stop Loss orders at the opposite side of the patterns as shown in the image.
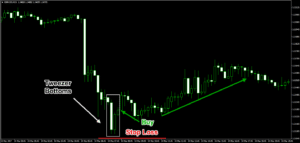
This is a Tweezer Bottoms Forex candle pattern. Noticethat the lower shadows of the two candles start and end approximately at the same level, which confirms the validity of the pattern. As a result, the price action reverses, which triggers a long trade. At the same time, you should put a stop loss order below the lowest point of the pattern.
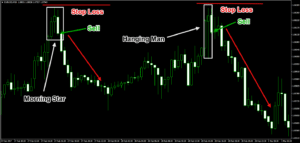
Now let’s go through the Morning Star candle pattern and the Hanging Man candlestick. Both patterns have the ability to end a bullish trend and to start a fresh bearish move.
You should approach both patterns with a short trade, and you should sell upon their confirmation, placing Stop Loss orders above their high. As you see, in both cases the price decreases after the confirmation of the pattern.
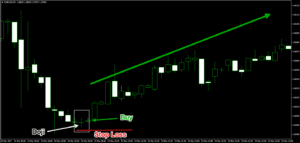
Lastly, we will discuss a Doji candlestick pattern that comes after a bearish trend. Our Doji candlestick analysis shows that the price ends the bearish move and starts a fresh bullish move.
You should trade in bullish direction here, placing a Stop Loss order below the lowest point of the Doji star candle.
Stop Loss Orders on Forex Candle Patterns
You should always use a Stop Loss order when trading Forex candlestick patterns. As you have probably seen on the trading images above, the best place for your stops on candle trades is at the opposite side of the patterns.
If you are trading a bullish candlestick pattern, place your Stop Loss order below the formation. If you are trading a bearish candlestick pattern, then you should place your Stop Loss order above the candle figure on the chart.
Take Profit Orders and Targets on Forex Candlesticks
The rule of thumb says that you should trade every candle pattern for a minimum price move equal to the size of the pattern measured from the tip of the upper shadow to the tip of the lower shadow.
In some cases, the price action will continue further than that. Therefore, use the basic price action rules to determine further exit points on the chart. If you spot another candlestick pattern during you trade that suggests the end of the trend, you should simply exit your trade and collect your profit.
Conclusion
- Forex candlestick patterns are crucial for the price action technical analysis of currency pairs.
- The candlestick pattern indicators form on the Japanese candlestick charts visualizes the price action of Forex pairs.
- There are two main types of candle pattern Forex indicators:
- Continuation candle patterns – not very popular in Forex trading
- Reversal candle patterns – widely used to profit on the Forex market
- The best Forex candlestick patterns for day trading have reversal character. These are:
- The Doji Candlestick Patterns – Doji, Long Legged Doji, Dragonfly Doji, Gravestone Doji, and Four Price Doji
- Tweezer Tops and Tweezer Bottoms
- The Hammer Candle Pattern Family: Hammer, Inverted Hammer, Shooting Star, and Hanging Man
- Three Inside Up and Three Inside Down
- Evening Star and Morning Star Candle Patterns
- You should place your Stop Loss orders at the opposite side of the candle pattern you are trading.
- Stay in each candle trade for a minimum price move equal to the size of the pattern. Extend your targets by applying price action rules.
Your Turn
We hope that you liked our candlestick cheat sheet and that you learned more about how to use the top candlestick patterns for intraday trading. With practice, you will get better at spotting these patterns naturally when you are looking at your charts. For more advanced Japanese candlestick trading, you can check this guide from Admiral Markets.
Share the patterns that you spot in the comments section!
START LEARNING FOREX TODAY!
- continuation patterns
- Doji candle
- Forex candlestick patterns
- Hammer candlestick pattern
- reversal patterns
share This:


Leave a Reply