The overall trend of the CHF/JPY remains extremely bullish, thus making any selling opportunity riskier in relation to a trend following opportunity. However, a clean bounce off the 127.2% Fibs could show a potential price weakness, and considering that most types of corrections are faster than the trend itself, CHF/JPY might move down either sharply or very steadily throughout this week.
Disclaimer: The analysis presented in this article is for educational purposes only and should not be considered as financial advice.
This analysis was done on MetaTrader 4.
Click below to open a Free Demo Account with our trusted brokers:
Trade Idea Details:
CHF/JPY symbol on the MT4 platform
Type: Bearish
Key support levels: 113.33, 112.60, 111.90
Key resistance levels: 114.58, 115.27, 115.67
Price Action:
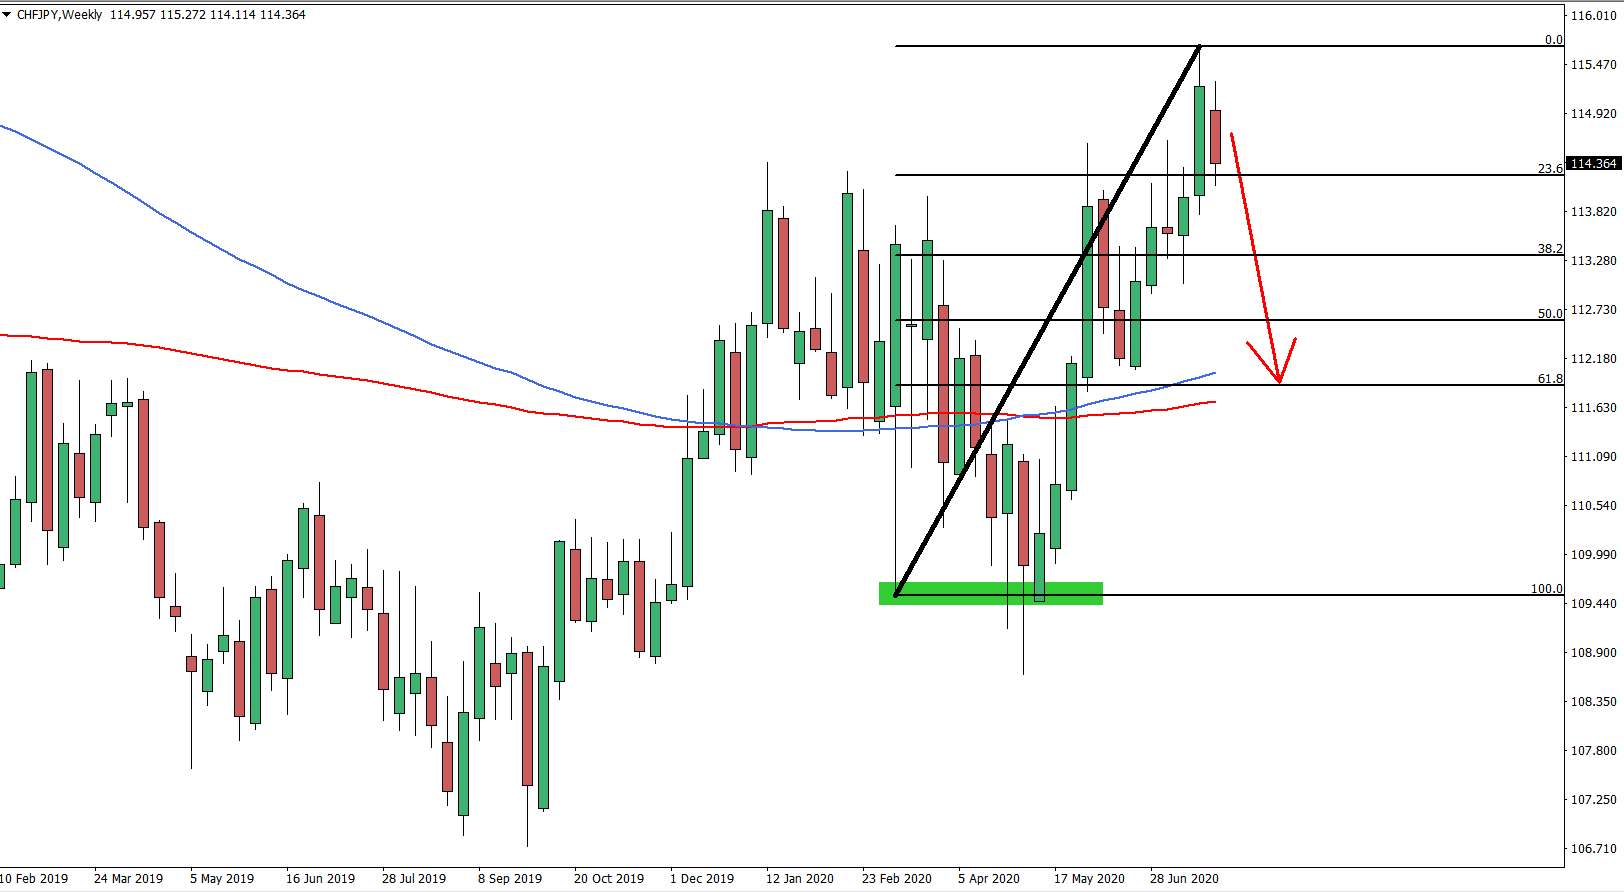
On the weekly chart, we have applied the Fibonacci retracement indicator to the last wave up occurred between March 08 – July 23. The purpose was to find levels of support if the price will start to correct down. The most interesting level is 61.8% Fibs at 111.90 because it corresponds to the Simple and Exponential Moving Averages on the Weekly and Daily charts.
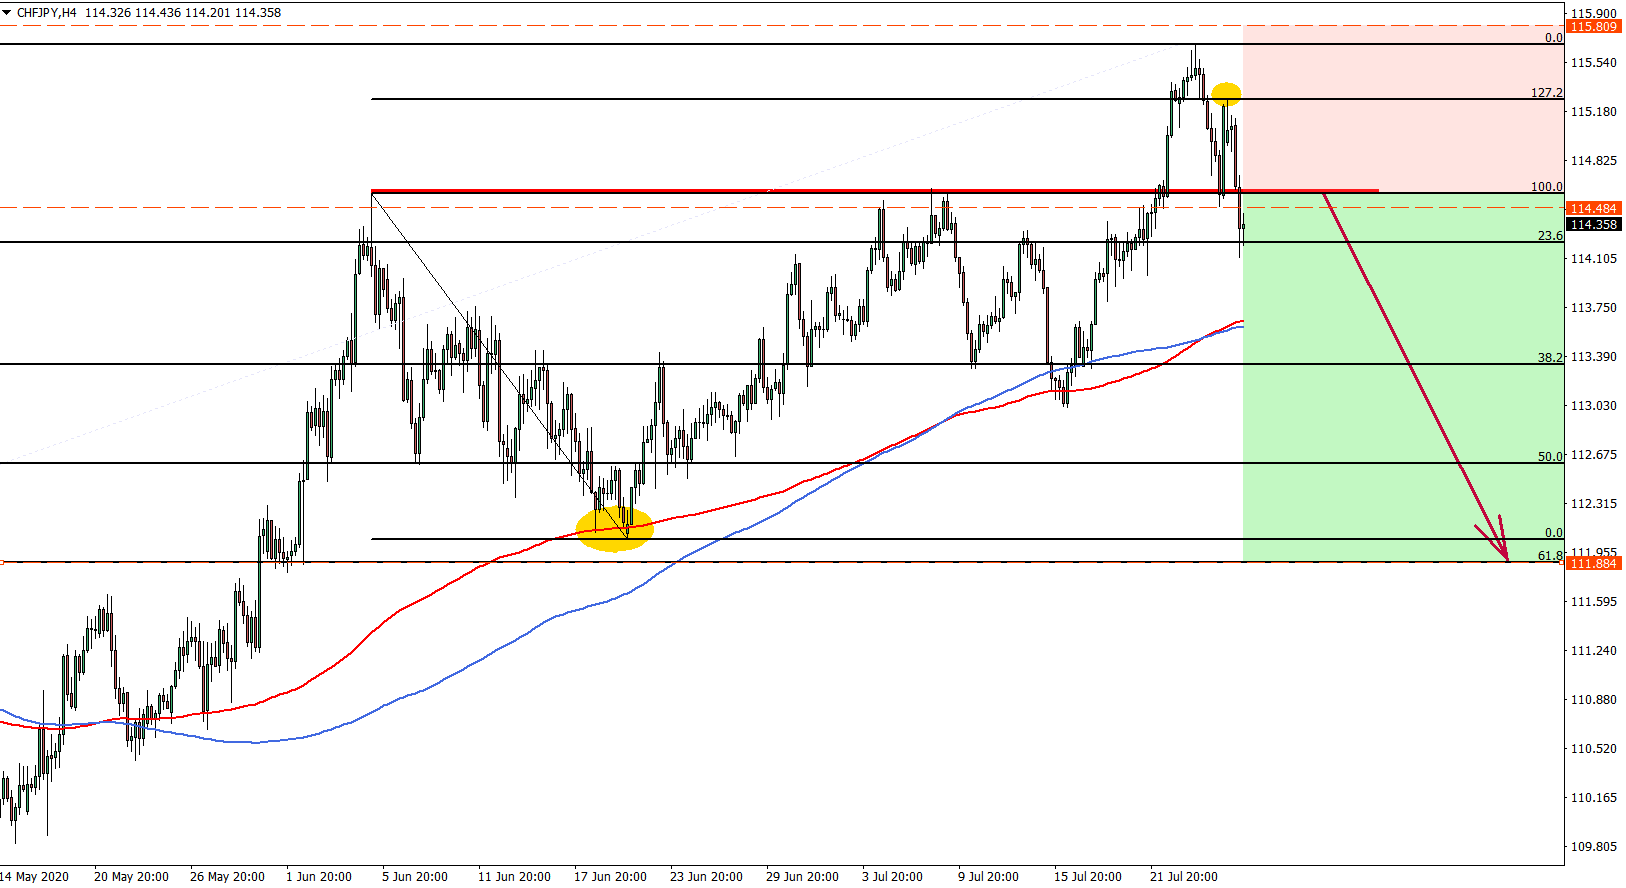
Moving on to the 4-hour timeframe, we can see that Fibs applied to the last downside correction shows a clear rejection of the 127.2% Fibonacci retracement level at 115.27. After the bounce, the price went down and produced a new lower low. It seems like the beginning of a stronger move to the downside, which at the end might result in a 260 pips decline.
The previous area of resistance is seen at 114.60, which was acting as the support for a very short time. There is a narrow price area between 114.48 – 114.60, which could be a strong supply zone for the CHF/JPY, making it an ideal selling point for bears. As long as price stays below 115.27 resistance, a further pullback should be expected. Price is likely to test one of the Fibonacci support levels, with the final target at 111.90.
Potential Trade Idea:
The previous area of resistance between 114.48 – 114.60 could provide a great selling opportunity with a good risk to reward ratio. The final downside target is seen at 111.90, and in order to achieve a 1:2 risk/reward ratio, the stop loss should be placed at or above 115.80 level, which is above the recent highest high.


Leave a Reply