Technical analysis changed in time together with trading. Even though traders mostly follow robots today, some things remained the same. The Elliott Wave Principle key to market behavior is one of them. Elliott waves look at markets from a human nature point of view. As such, the Elliott Wave Principle allows traders to catch perfect trades.
Ralph Elliott was convinced that there’s a hidden order in the financial markets. He didn’t waste his time. He built a system that comprises market’s reactions as a result of human behavior.
To this day, “Elliotticians” label/count waves according to the Elliott Waves Theory. They use the same rules for various markets. But Elliott developed the trading theory on the stock market.
However, it doesn’t matter. For, human nature is the same. As such, the Elliott Wave Principle works on all financial markets.
Speed and volatility surround today’s markets. Especially the Forex market.
Yet, Elliott Waves works under these conditions too. What Elliott did was to lay the rules of a logical process to understand market behavior.
He strongly believed that market and human behavior are the same. One is the result of the other.
Therefore, the Elliott wave rules and the overall theory represent a road map to human behavior. To this day, the Elliott Waves Principle is one of the most complex trading theory that exists. If not, the most complex one.
Since ages, human behavior was a big unknown. And it still is.
To put order financial markets movements under a set of rules is no easy task. Yet, Elliott did it.
The rules that make the Elliott Waves are both logical and precise. As a result, Elliott Wave predictions have a great degree of accuracy.
Elliott Wave Principle Key to Market Behavior
Elliott’s final book called “Nature’s Law – The Secret of the Universe” introduced his findings to the world.
In his efforts to understand the market, Elliott started from a basic concept. The market moves in waves.
He divided the waves into two main categories: impulsive and corrective ones. But there was still something missing. How to connect them?
How to find the link between the two? The answer came from the markets’ cyclical nature.
As such, Elliot Waves consider different cycles of different degrees. And a cycle has both an impulsive and a corrective wave.
Any Elliott Wave trader knows that an impulsive wave has five waves of a lower degree. A so-called five-wave structure.
However, a corrective wave has only three. Because of that, an Elliott Wave cycle shows a five waves market decline or advance, corrected by other three waves.
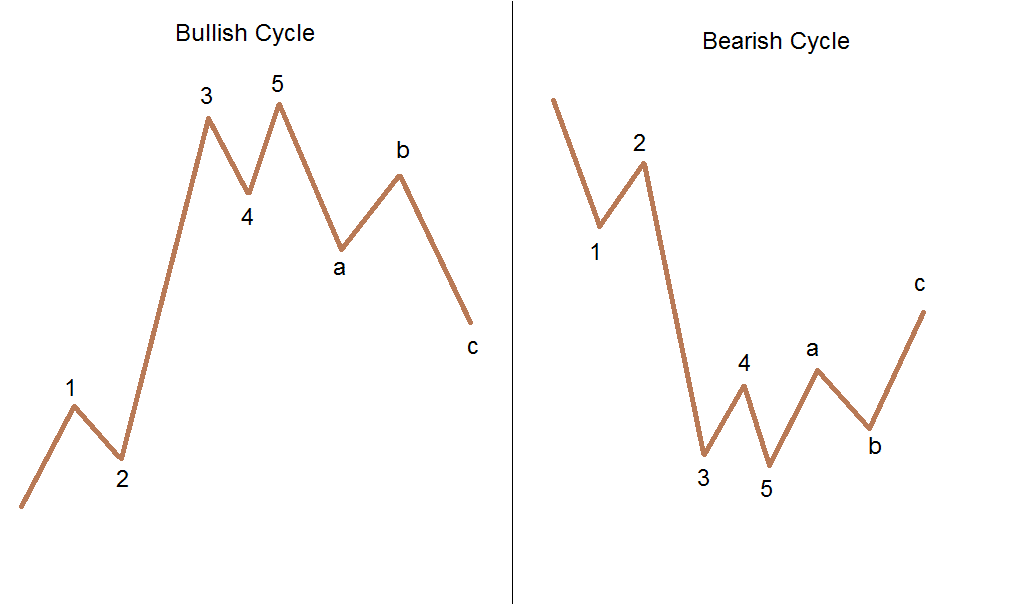
To count an impulsive wave, Elliott used numbers. And letters for a corrective one.
As such, a bullish or bearish cycle has a 1-2-3-4-5- a-b-c count. These eight waves form the Elliott wave principle key to market behavior.
Elliott stressed the importance of understanding the market cycles. They make the Elliott Wave Principle look like a complex theory. And it is.
The idea is to integrate the impulsive and corrective waves into the right cycle. But this is the most difficult thing to do.
Because of that, many traders fail at correctly counting the waves. Where does a move start from? Where does the correct count start from?
Elliott Wave Principle – What Makes an Impulsive Move
An impulsive wave is a five-wave structure. We mentioned earlier Elliott used numbers to count the waves: 1,2,3,4,5.
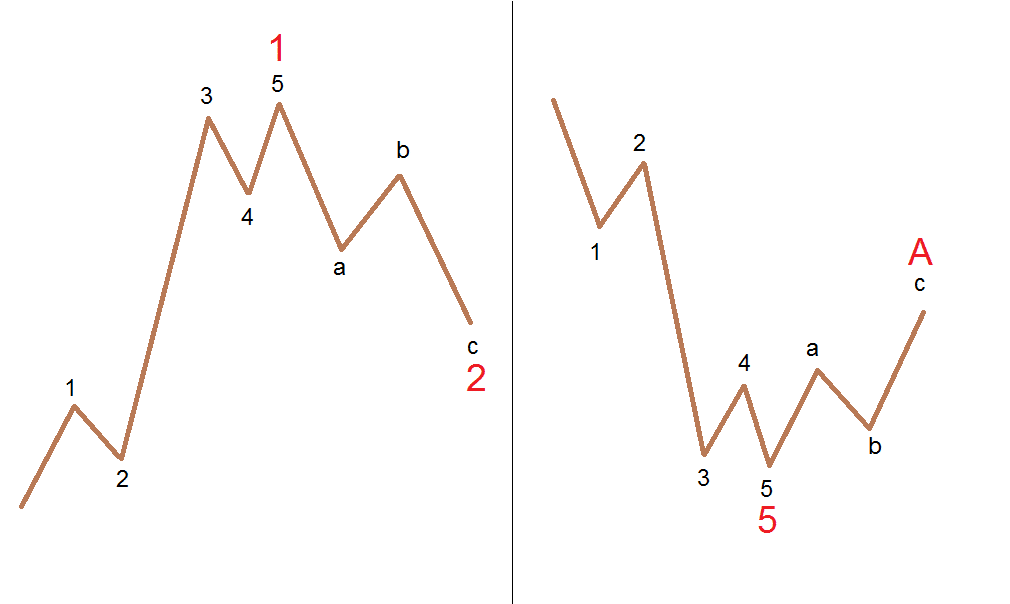
But one thing is important here. All five waves make an impulsive wave of a bigger degree.
These five waves can be the 1st wave of an impulsive wave of a bigger degree. Or, the third wave. Or the fifth one. It may be even the first part of a corrective wave.
To complicate things even further, not ALL five waves show impulsive activity. Only the first, the third and the fifth one.
Also, depending on the nature of the a-b-c correction, both waves a and b might be impulsive. Here are the rules of an impulsive move according to Elliott Waves:
- Wave 1 is an impulsive wave. It has five waves of a lower degree.
- The 2nd wave represents corrective activity. The correction is either a simple or a complex one.
- The 3rd wave is an impulsive wave as well. And, it cannot be the shortest of the impulsive waves of the same degree. Namely, when compared with waves 1 and 5, the 3rd can’t be the shortest one.
- Wave 4 shows a correction. Like the second wave, it is either a simple or a complex one.
- The 5th wave is impulsive too.
- Waves 2 and 4 should not overlap.
That’s the five-wave structure that makes an impulsive wave. On top of the above rules, the Elliott Waves Principle states that:
- No parts of the 2nd wave should go beyond the start of the 1st
- In an impulsive move, at least one wave must extend.
- The two corrective waves must differ.
Elliott Waves Principle – Types of Impulsive Waves
Dividing the market moves into impulsive and corrective waves wasn’t enough. While it represents a great starting point, it is just that. Only a starting point.
Elliott found that in an impulsive activity at least one wave must extend. But what is an extension?
Once again, like in all major trading theories, the Fibonacci numbers/ratios come to help. As a rule of thumb, an extended wave is bigger than 161.8% of the previous one.
The extended wave is always the one that stands out of the crowd. Simply look for the longest one.
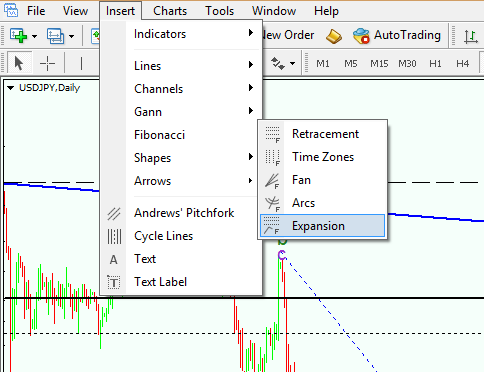
An Elliott wave indicator mt4 platform offers will automatically plot the extension. However, even without it, any trading platform makes it easier to find it thanks to the Fibonacci Expansion tool.
3rd Wave Extensions with Elliott Waves Theory
The most common wave to extend is the 3rd wave. In fact, out of all impulsive waves the market forms, 3rd wave extensions form most of the times.
Naturally, the 3rd wave is the longest in the five-wave structure. And, it is an impulsive wave on its own. Just of a lower degree.
Elliott wave predictions in such an impulsive wave consider opening a trade when the 2nd wave retraces. To be more exact, when the 2nd wave retraces 50%-61.8% of the 1st one, traders go long. That is if the impulsive wave is bullish.
Obviously, they short in a bearish trend. Finding the entry is an easy task. This time, traders use the Fibonacci Retracement tool.
Because the Elliott Wave Principle says the 2nd wave can’t travel beyond the start of the 1st wave, traders use this as a stop. Hence, in a bullish move, they buy the 61.8% dip with a stop at the full retracement.
For such a trade, they target 161.8% extension of the 1st wave. But, projected from the end of the 2nd wave.
The extended level represents the minimum distance the price must travel. This is one of the reasons that make the Elliott wave principle key to market behavior.
However, in strong impulsive waves, the price travel much more than that. Here’s how an Elliott Wave theorist would short a currency pair.
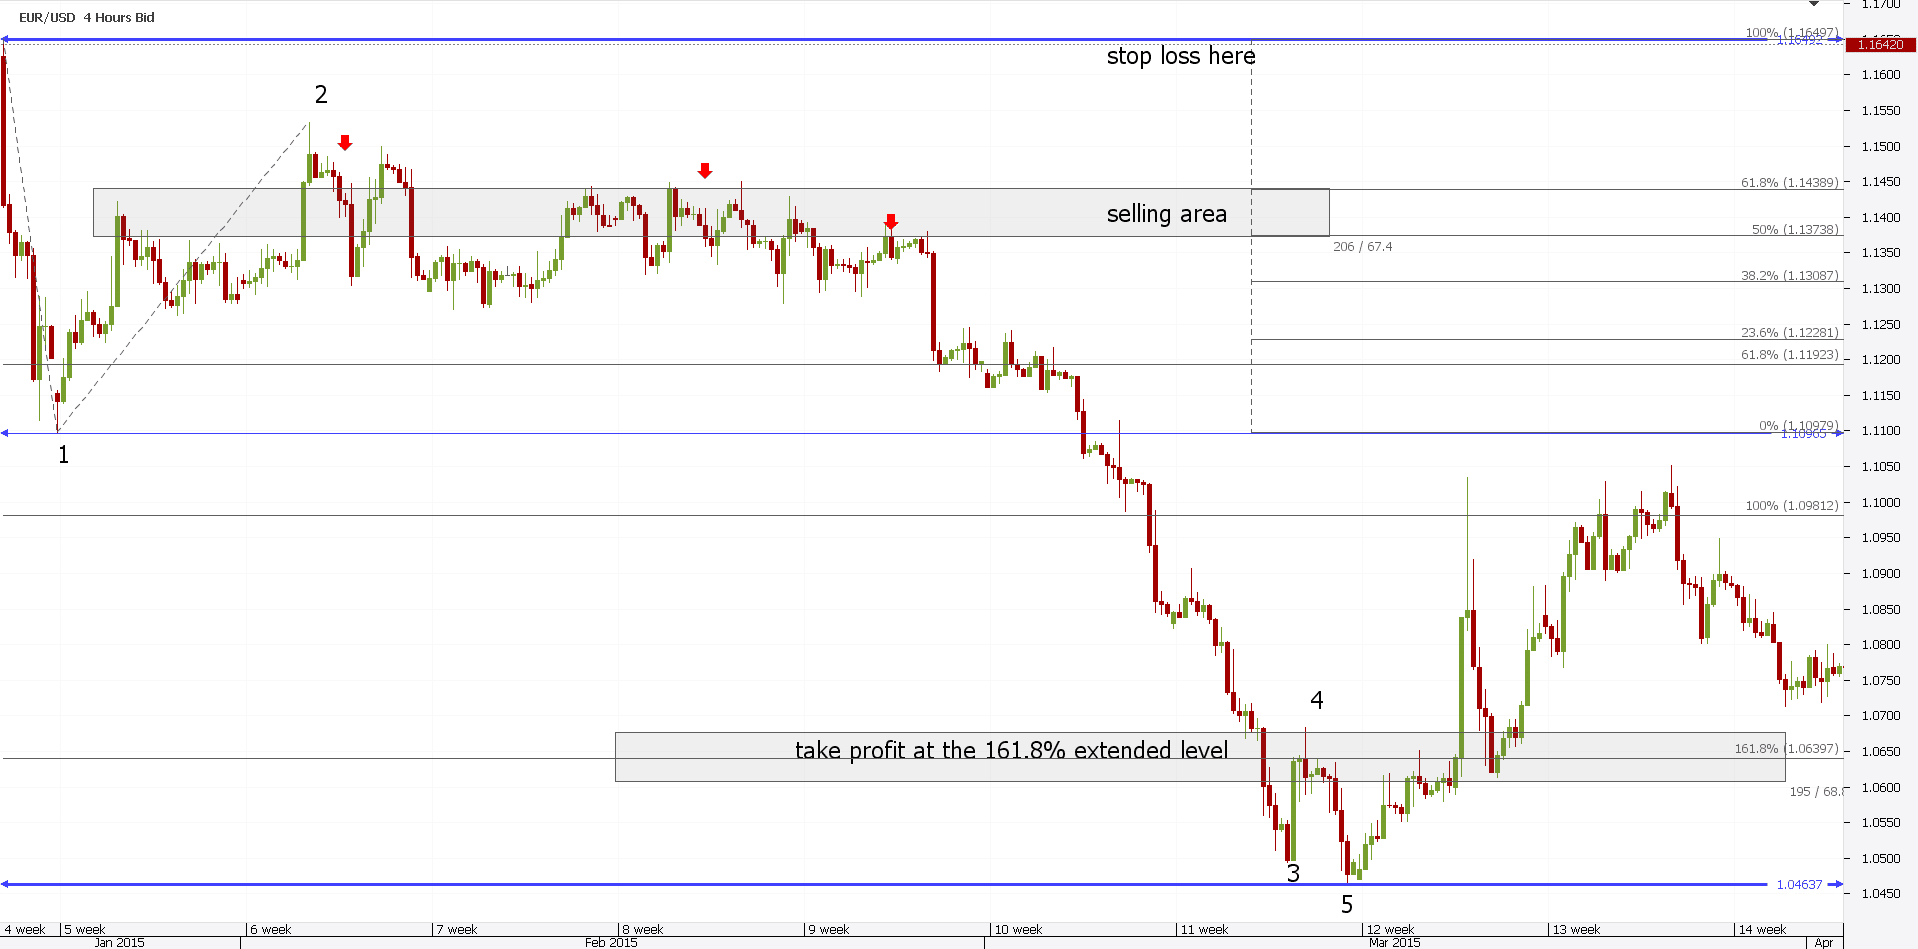
First, traders look for the 61.8% retracement. That’s the selling area.
Second, the stop loss is at the start of the 1st wave. Finally, the extended level gives the take profit. Perfect setup, great trade.
1st Wave Extensions Part of Elliott Wave Patterns
After the 3rd wave extensions, the 1st wave ones come next. Logically, the 1st wave is the longest one.
Not only that is the longest, but Elliott rules give the limits for the other ones. Let’s put one by one together.
If the 1st wave extends (is the longest), but the 3rd wave can’t be the shortest, this makes the 5th wave the shortest. Again, such limitations give the stop loss to any trade that might result.
When the 1st wave extends, the 2nd wave doesn’t retrace 61.8% of it. It barely reaches 38.2%. As such, traders that want to open a trade must find other condition to set the stop loss.
The distance until the start of the first wave is simply too big.
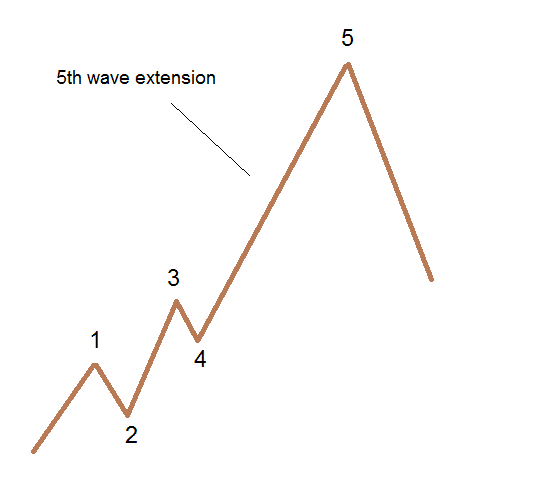
5th Wave Extensions Part of Elliott Waves Technical Analysis
This type of impulsive waves are the rarest ones. When they form, the 5th wave is the longest one. The one that stands out of the crowd.
Elliott found only a couple of instances when this impulsive wave appears. Because of that, whenever such an impulsive wave forms, the market retraces the 5th wave almost completely.
Besides the three types of impulsive moves mentioned here, there’s one other. A double extended impulsive move.
When this one forms, both the 3rd and the 5th wave extend. Namely, the 3rd wave’s length is bigger than 161.8% of the 1st wave. And the 5th wave extends when compared with the 3rd one.
But, this seldom happens. The 3rd wave extension makes the Elliott Wave principle key to market behavior.
Elliott Waves – What Makes a Corrective Move?
If impulsive moves look complicated, think twice. Corrective waves are even more.
The thing is that the market doesn’t trend that much. In fact, it spends most of the time in consolidation.
Therefore, corrective waves form most. It is no wonder Elliott found multiple types of corrective waves.
In his pattern recognition approach to corrective waves, Elliott used the same principle. He divided them into two categories. Simple and complex corrections.
Simple Corrections with the Elliott Waves Principle
Here, things look simple. There are only three simple corrections Elliott identified: a flat, a zigzag and a triangle.
But, the logical process only starts. There are multiple types of triangles, zigzags or flat patterns.
To put this in perspective, consider that Elliott found no less than ten types of flat patterns. Ten!
A flat is an a-b-c. Or a three-wave structure.
Labeling it with letters shows its corrective nature. But only two waves are corrective. The c-wave is a five-wave structure of a lower degree.
The key to a flat and a zigzag is the golden ratio. That’s right, Fibonacci again.
In fact, an Elliott wave analysis is not possible without the Fibonacci ratios. As a rule, the b-wave in a flat must retrace beyond 61.8% of wave a.
A zigzag is still an a-b-c. With some key distinctions:
- Both waves a and c are impulsive.
- Wave b must NOT retrace beyond 61.8% of the 1st
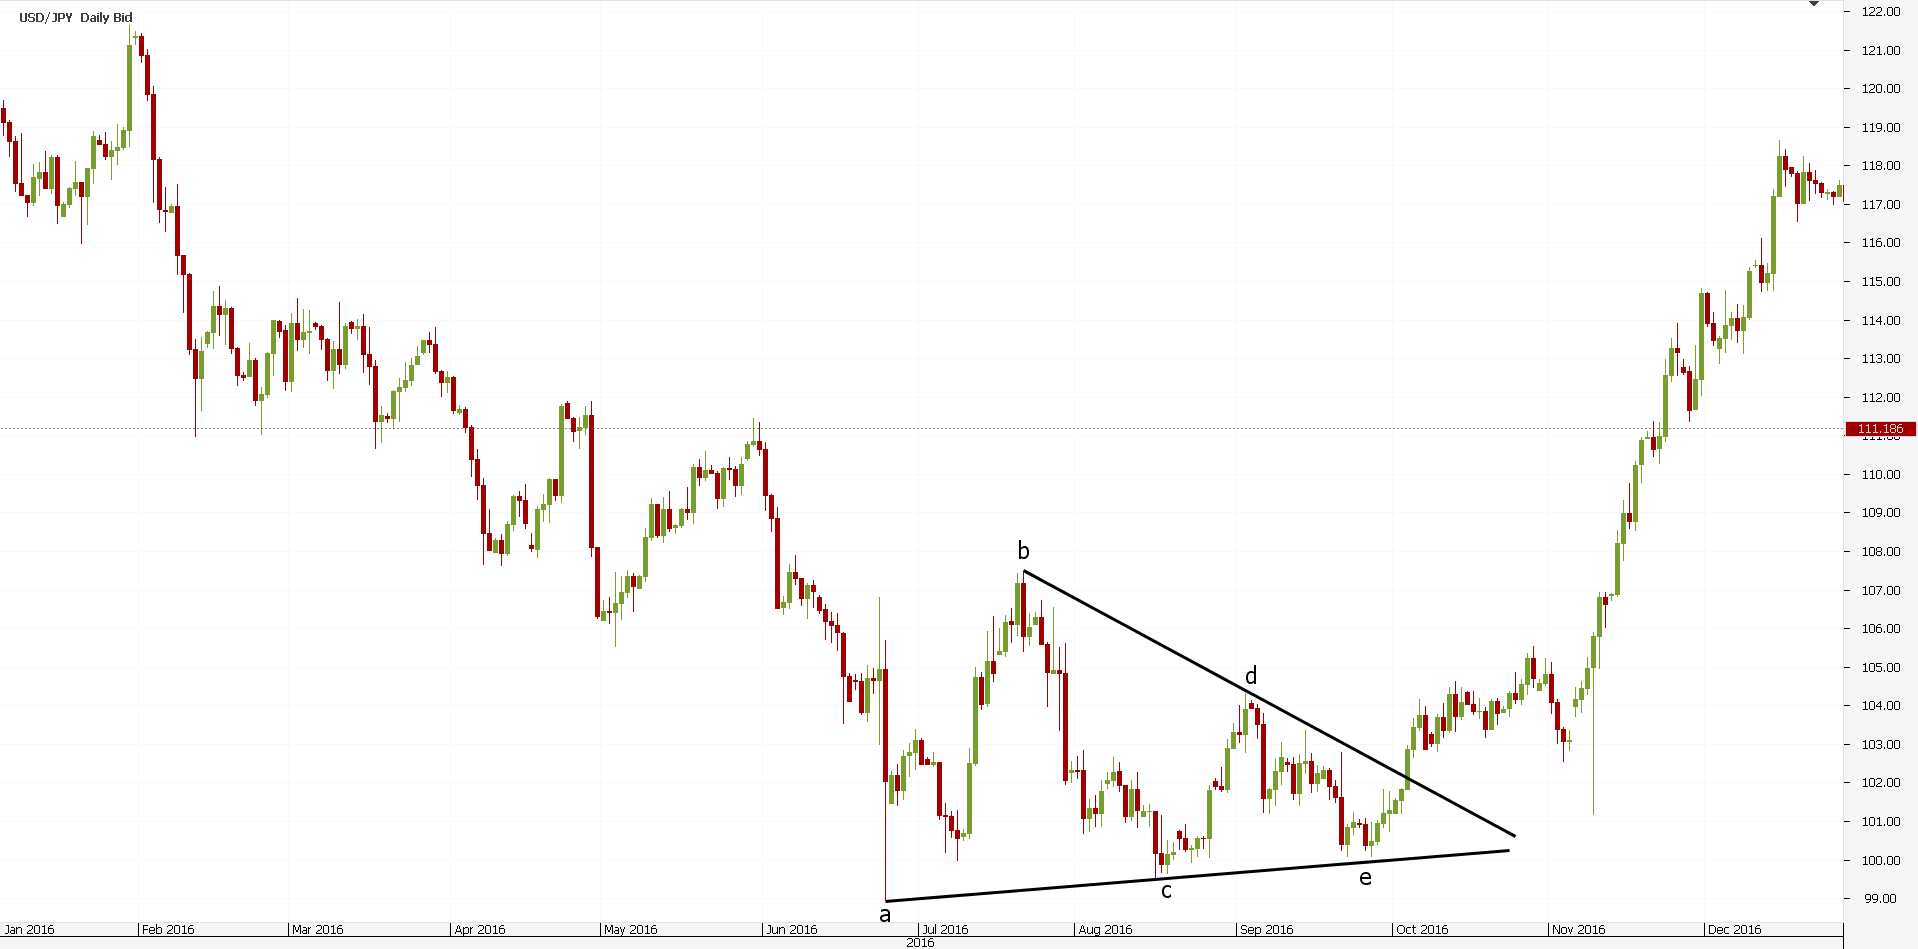
The most interesting thing appears on triangles. First, they are the most common way for the market to consolidate.
Second, they’re called three-wave structures. But they have five legs. As such, labeling becomes a-b-c-d-e.
Finally, all the legs of a triangle show corrective activity. All of them!
In the example from below, the triangle acts as a reversal pattern. When this happens, the market experiences a complex correction.
Complex Corrections with Elliott Waves Theory
Unfortunately, simple corrections are not the most common ones. They don’t form often enough.
This is especially true on the Forex market. Large swings and aggressive moves are the norm industry.
Again, Elliott split the waves. As such, the market may form a complex correction with a small x-wave or with a large one.
The idea of an x-wave is a brilliant one. It connects two simple corrections.
Nowadays, any Elliott Wave indicator displays the x-waves. Even the most basic Elliott Wave oscillator.
The key to a simple or complex correction stays with the x-wave. And with its retracement level.
For that, one Elliott Waves rule states that small x-waves can’t retrace beyond 61.8%. Of the first correction!
To see that, traders use a Fibonacci Retracement tool. But they drag it from the start until the end of the first correction.
Elliott Wave Forex traders use, shows the x-wave in multiple counts. That’s because complex corrections form often.
An interesting fact, the x-wave is a corrective wave on its own. Always.
And, it can be either simple or complex. Elliott found various patterns that fit into complex corrections with a small x-wave.
Patterns like double and triple threes, or double and triple combinations, are just a few to mention. A small x-wave is their common element.
Elliott Wave Lives On – Where to Start the Count From?
A major problem for many Elliott Wave international traders is the starting place of a count. Where to start the count from?
The answer to this problem comes from approaching the market from a different perspective. Introducing the top/down analysis concept.
The idea is to start a count from the biggest time frame possible. Hence, the monthly chart.
For those markets where historical data exists, even better. Start from the very beginning.
Next, look for the different time frames to act as different cycles. Elliott Waves Principle calls for cycles of bigger degree that further divide into smaller ones.
That’s what any modern trading platform does. As such, start from the monthly and continue with the weekly time frames.
When doing that, start on the weekly from where the count ended on the monthly. Then continue with the daily, four-hour and hourly charts.
Some Elliott Waves traders go even lower. To five-minute charts.
That’s not recommended. The Forex market moves so fast that there’s no way to update the charts. Simply put, there is no time for it.
This solves some major riddle traders had. Plus, it puts things in order.
Part of trading success is to use a disciplined approach to trading. Such an approach makes Elliott wave principle key to market behavior.
Conclusion
To sum up, we can say without hesitation, the Elliott Waves Principle is a great trading theory. When correctly applied, traders can corner a market.
Unfortunately, Elliott laid down so many rules and conditions, that they are very difficult to follow. Moreover, data differs from broker to broker.
Because of that, it is not seldom that traders have different Elliott Waves interpretations. Of the same market!
Some like to simply wait for the 61.8% retracement of a move. When this happens, they buy/sell for the minimum extension. That’s called the market confirming the “litmus test”.
Others like patterns more. As such, they choose to trade only triangles.
Since they form most of the time, they’re everywhere. On any time frame, any currency pair.
The point is that the Elliott Waves Theory has something for everyone. Firstly, it gives a sense of direction. Traders always know where they are and what to expect next.
That’s the very basic idea when trading. Making a forecast!
Secondly, trading gets disciplined. A stop loss and a target result easily from the analytical process.
Moreover, Elliott Waves is purely technical. Being based on human behavior, the fundamental part is already incorporated in the analysis.
This is a powerful statement. Because of that, the Elliott Waves Principle is the most complete trading theory ever created. No other trading theory takes human nature so seriously.
Finally, it is the only (meaning there’s no other!) trading theory that incorporates time in an analysis. Namely, it gives traders to the opportunity to target a level (price) in a specific amount of time.
Price and time, the holy grail in trading. More on that, on other occasions.
START LEARNING FOREX TODAY!
- 61.8% Fibonacci Level
- Elliott Wave Theory
- Elliott Waves
- Fibonacci Forex Trading
- Fibonacci Levels
- Fibonacci Retracement
share This:


Leave a Reply