While the uptrend is expected to continue, the downside correction could be extended. Daily break and close below 1.5707 is likely to result in the price drop towards the next support at 127.2%, which is 1.5628, before/if uptrend will resume.
Disclaimer: The analysis presented in this article is for educational purposes only and should not be considered as financial advice.
This analysis was done on MetaTrader 4.
Click below to open a Free Demo Account with our trusted brokers:
Trade Idea Details:
EUR/CAD symbol on the MT4 platform
Type: Bullish
Key support levels: 1.5700, 1.5628
Key resistance levels: 1.5826, 1.5894
Price Action:
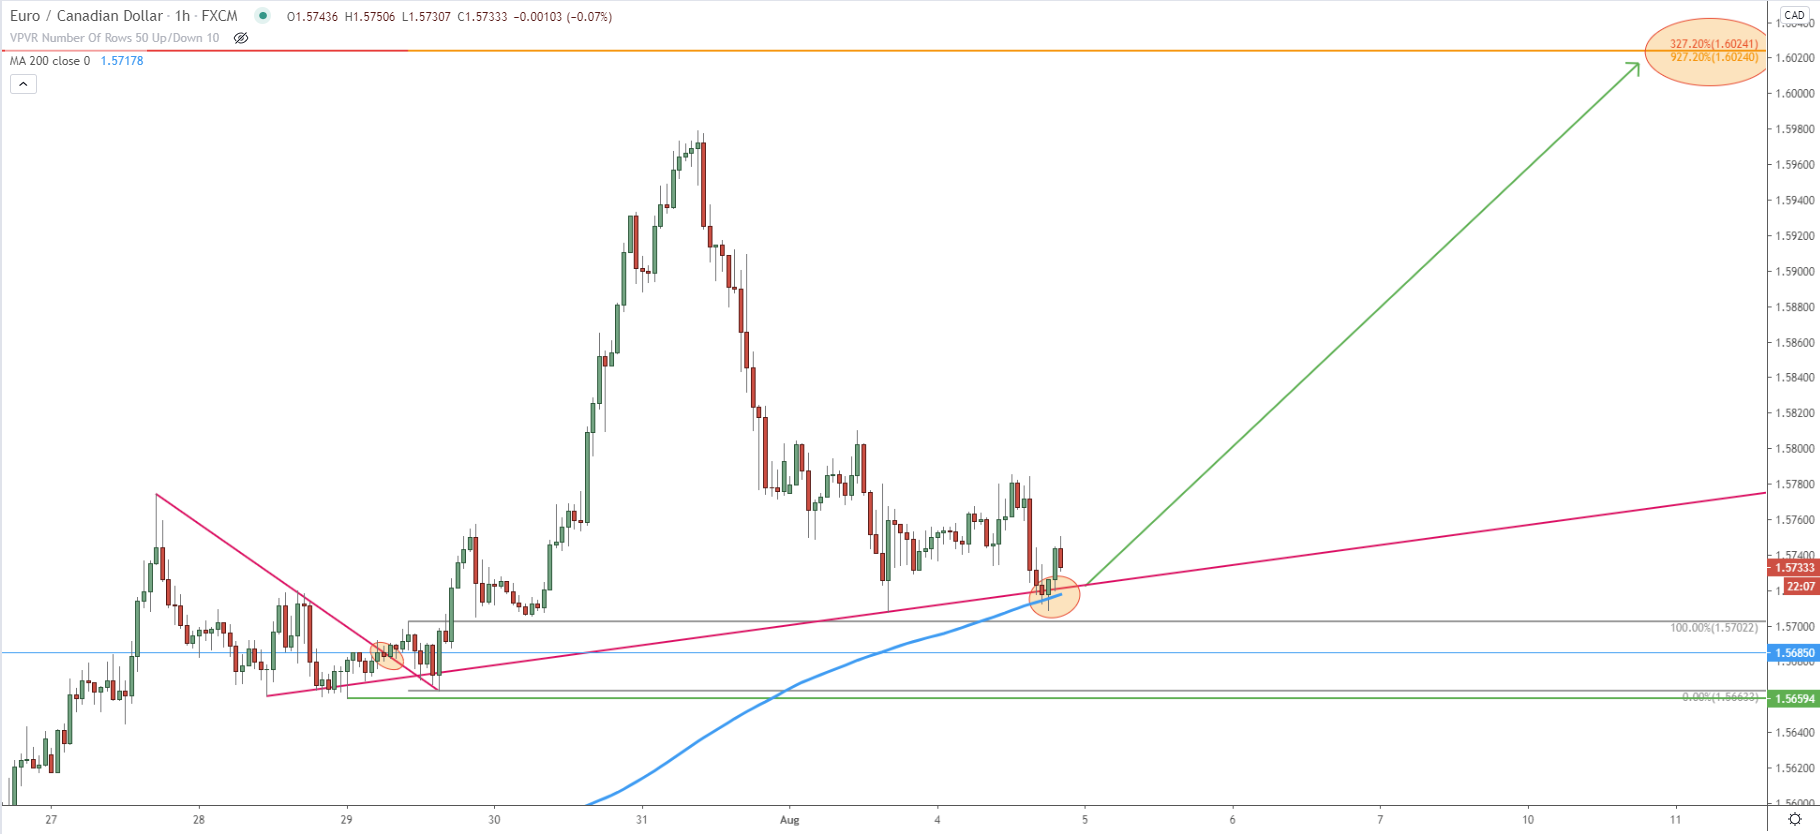
EUR/CAD has established a very strong uptrend after price broke above the triangle pattern. Since May 27 price has grown by 6.14% which equals the 924 pips. Pair topped out at 1.5979 on July 31 and corrective move down took place.
EUR/CAD has retraced by 271 pips and went down to 1.5707, although it found the support at the 50 Simple Moving Average. We have applied the Fibonacci retracement indicator to see potential upside targets. Clearly 127.2%, 161.8%, 227.2% and 261.8% Fibonacci resistance levels were broken. This means that the next upside target could be located at 327.2% Fibs, which is 1.6024.

On the hourly chart, EUR/CAD has reached and rejected the uptrend trendline along with the 200 Simple Moving Average. This goes to show that bulls are still in control and price is likely to continue trending upwards. In order to confirm the upside resistance and the potential target, we have applied another Fibonacci indicator to the corrective wave down after the price broke above the downtrend trendline. The 927.2% Fibs corresponds exactly to the previously mentioned resistance at 1.6024, making the upside target 300 pips away.
Potential Trade Idea:
Buying opportunity is presented while the price is near 1.5700 psychological support, +/- 25 pips. The upside target is 300 pips away, at 1.6024, making it a medium to long term trade idea. The critical support is located at 1.5628, and daily break and close below will invalidate bullish outlook. In order to defend the buying opportunity from the potential spikes down and to achieve the 1:2 risk/reward ratio, the stop loss can be placed at 1.5570.


Leave a Reply