Overall, the EUR is starting to look weak across the board, which might not only affect the EUR/JPY but other EUR related currency pairs. The long term trend remains bearish, and while the price might not produce a new lower low, stong pull back down should be expected.
Disclaimer: The analysis presented in this article is for educational purposes only and should not be considered as financial advice.
This analysis was done on MetaTrader 4.
Click below to open a Free Demo Account with our trusted brokers:
Trade Idea Details:
EUR/JPY symbol
Type: Bearish
Key support levels: 120.23, 117.57
Key resistance levels: 121.70, 122.67
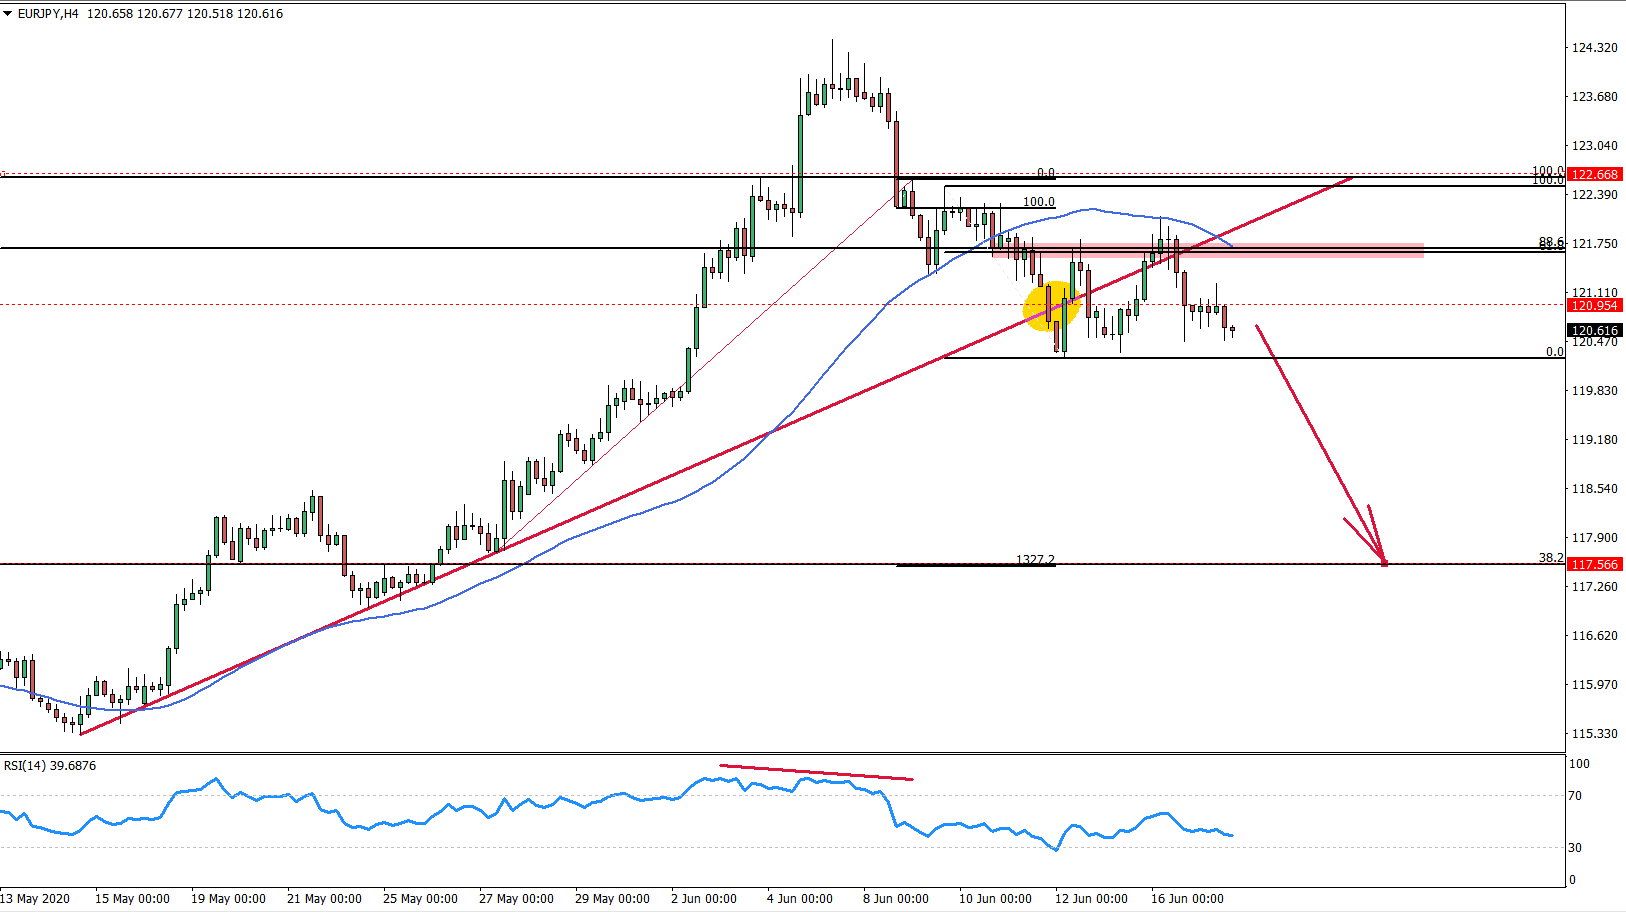
Price Action: on the 4-hour chart EUR/JPY broke below the 50 Simple Moving Average and the uptrend trendline after forming a bearish divergence on the RSI oscillator. These were strong bearish signals, which might result in a strong downside correction on the EUR/JPY currency pair.
After breaking two uptrend trendlines, the price corrected up, and rejected 50 SMA, along with the 61.8% Fibonacci retracement level applied o the most recent wave down. If the resistance is being respected, then the bears are in control. This seems like a reasonable statement, and EUR/JPY might in fact continue to move lower.
The downside target is seen at 1327.2% Fibonacci retracement level applied to small corrective wave up, after breaking the first uptrend trendline. But let’s also look at the daily chart.
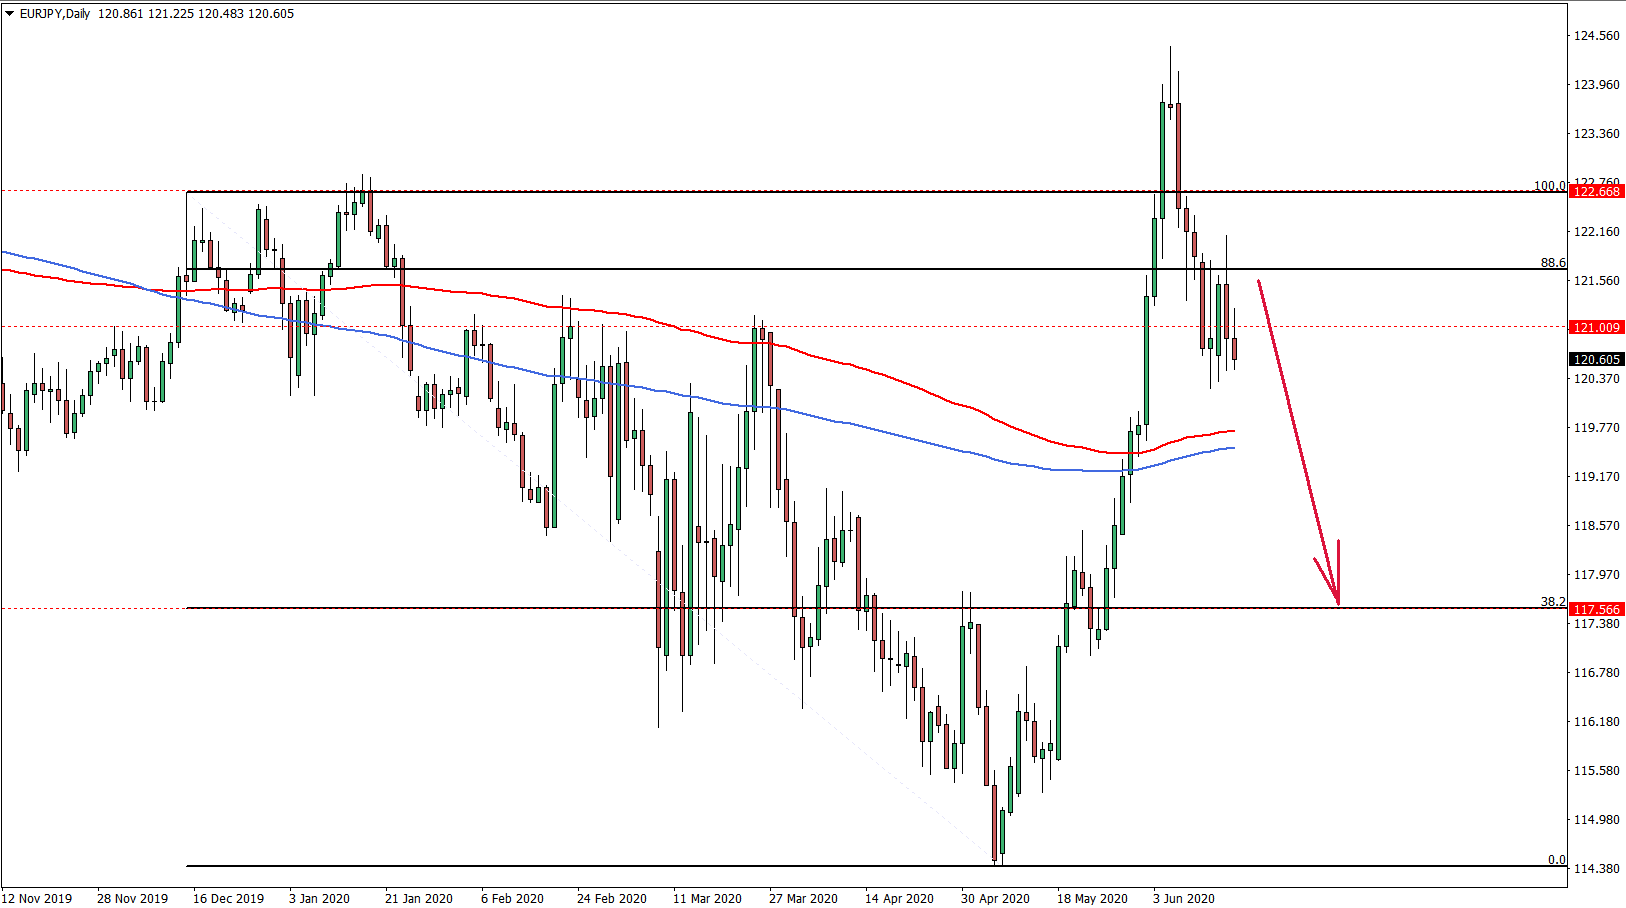
On the Daily chart, we have applied the Fibonacci retracement indicator to the December 13, 2019 – May 7, 2020 downtrend. It shows that the 88.6% Fibonacci retracement level corresponds to the 61.8% Fibs as per the 4h chart. Besides, the 38.2% Fibs corresponds to the 1327.2% Fibs on the 4h chart as well, which should act as the key support level in the short to medium term.
Potential Trade Idea: the ideal entry price could be near 121.00 psychological resistance level. In this case, to meet the 1:2 Risk/Reward ratio, the stop loss should be at or above 122.67, because the downside target could be near 117.57.


Leave a Reply