Right now EUR/NZD is trading at the level of interest, mostly for the sellers. As long as the downtrend trendline holds, selling pressure will only increase.
Disclaimer: The analysis presented in this article is for educational purposes only and should not be considered as financial advice.
This analysis was done on MetaTrader 4.
Click below to open a Free Demo Account with our trusted brokers:
Trade Idea Details:
EUR/NZD symbol
Type: Bearish
Key support levels: 1.7850, 1.7700
Key resistance levels: 1.7900, 1.7930, 1.7965
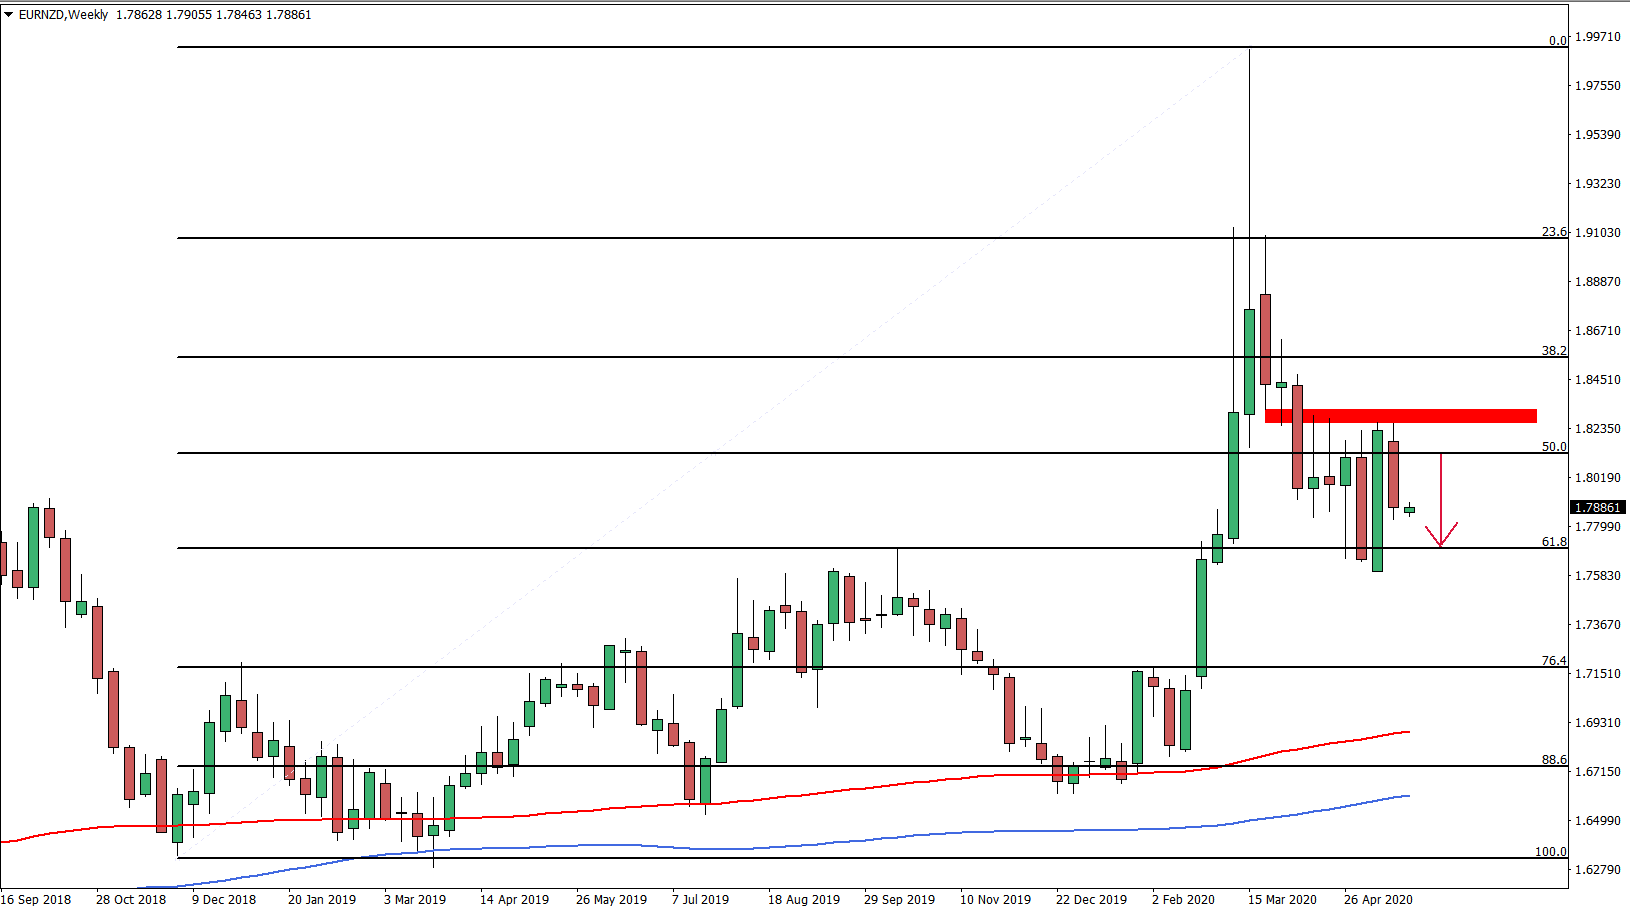
Price Action: Looking at the Weekly chart, a strong resistance can be seen at 1.8260 area. This should increase selling power in the long run, as long this resistance holds. We have applied the Fibonacci retracement level to the overall uptrend to see the nearest support and resistance levels. The resistance is 50% Fibs at 1.8125, while the support is 61.8% Fibs at 1.7700, which is also a strong psychological level.
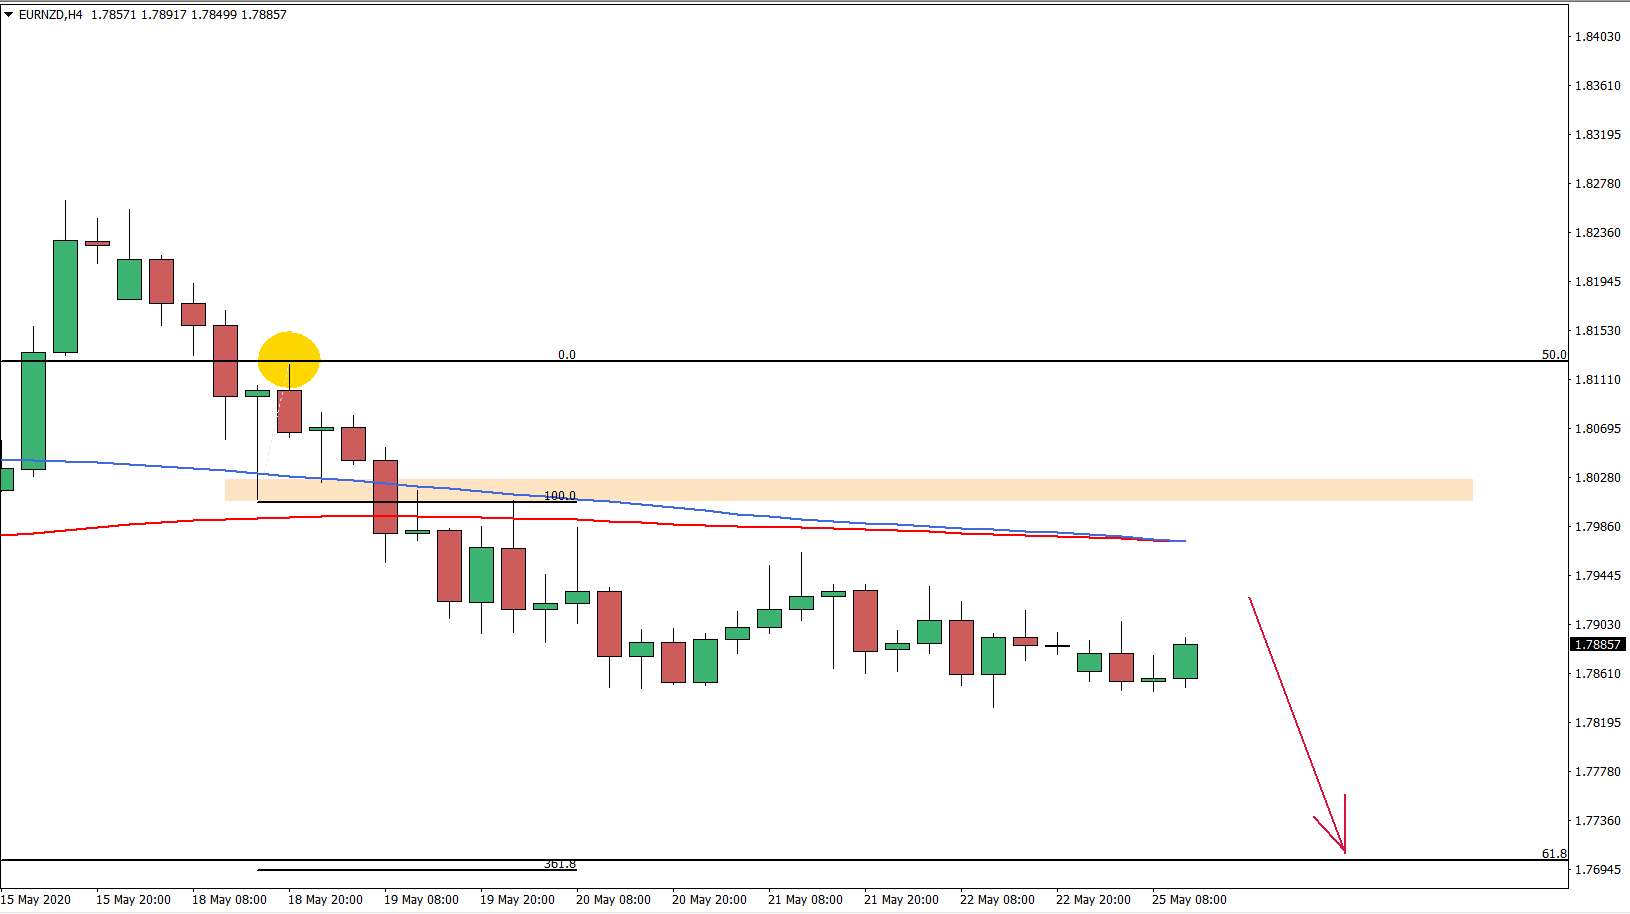
On the 4-hour chart price rejected the 50% Fibs cleanly and broke below 200 Simple and Exponential Moving Averages. On a minor correction up, Moving Averages were rejected, this time acting as the resistance. This validates selling domination over the medium term while price can be expected to move towards 1.7700. This level is confirmed now by two Fibonacci retracement levels 61.8% as per the Weekly chart, and 361.8% Fibs as per the 4H chart.
On the 1-hour chart, the price is printing lower lows and lower highs. The 200 EMA was rejected and currently, price approached the downtrend trendline. This could be considered as a great selling opportunity as long as the downtrend trendline is being respected. The downside target is now confirmed by 3 Fibs, on the Weekly chart, on the 4H chart, and by 527.2% on the 1H chart. Although there is also a possibility that EUR/NZD will break to the upside to re-test the 200 EMA.

Finally, on the 15M chart we can observe the formation of the Bearish Divergence on the RSI oscillator. While the price has produced a higher high, the RSI failed to mirror the price and only managed to produce the double top. This might suggest the very beginning of the downtre3nd continuation.

Potential Trade Idea: Shorting at the top of the triangle near 1.7885 seems very reasonable since the potential reversal is confirmed by multiple rejections of the Moving Averages, the downtrend trendline, and the formation of the Bearish Divergence. The key resistance is seen at the point where price bounced off the EMA on the 1H chart, which is at 1.7965. Daily break and close above this level should be considered as an exit signal. Alternatively, a hard stop loss can also be used at 1.7985 or above, to have a risk rewards ration at approximately 1:2. Then the take profit could be near 1.7705.


Leave a Reply