This time I am proud to show you the longest trade I have on record. It took place on the AUD/USD Forex chart and I opened it on signals from the Forex Alligator. I used the basic signals of the Alligator indicator trading system, which got me into an emerging bearish trend with the Aussie. But first, let’s give some brief details about the basic Alligator indicator strategy.
What is the Forex Alligator
The Alligator indicator forms on Forex moving averages. It consists of three smoothed MAs that are displaced into the future:
- The first line is usually green and it’s name is the Lips of the Alligator. It is a 5-period Smoothed Moving Average, displaced by three periods to the right. This is the fastest band.
- The middle line is usually red and it’s name is the Teeth of the Alligator. It is an 8-period Smoothed Moving Average with five period displacement to the right.
- The last line is usually blue and it’s name is the Jaw of the Alligator. It is a 13-period Smoothed Moving Average with eight period displacement to the right. This is the slowest band.
How to Use Alligator Indicator in Forex
The name of this tool is Alligator indicator because it looks like an Alligator’s mouth that is eating when Forex pairs are trending. Conversely, the mouth is closed when Forex pairs are ranging.
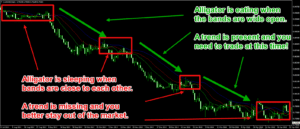
So, we say that the Alligator is eating when the bands are wide open. This means that the Forex pair is trending. When the bands are tight and constantly interrupt each other, we say that the Forex Alligator is sleeping. This is when we have a range on the chart rather than a trend.
In this relation, you need to trade when the Alligator is eating, because it signalizes about an eventual trend on the chart. You need to stay out of the market when the Alligator is sleeping, because you are most likely looking at a range. The alligator will be likely to start eating after the respective consolidation breakout.
Shorting the AUD/USD with the Alligator Indicator Strategy
I also used the well-known Volume indicator to support my Alligator signals. At the same time, I was constantly relying on price action rules.
- I saw that the bands of the Forex Alligator are expanding.
- At the same time, a bearish move was emerging on the chart.
- This all happens during increasing trading volume, which confirms the authenticity of the signal.
- At the same time, the AUD/USD reaches a 2-day low.
- Meanwhile, a bearish trend emerged and the price bounced from it for third time.
These signals were sufficient to position a short trade with the Aussie on the assumption that the price is starting a decrease.
Stop Loss and Target
The idea of the trade was to use only eventual price breakout through the green Alligator line, or cross of the green and the to close the trade. It doesn’t matter if it is losing or profitable. Nevertheless, I placed a Stop Loss order on a relative distance do protect the trade from big volatile price moves.
There wasn’t a certain target. The plan was to stay in the trade until we get some signals from the Alligator indicator.
Live Trading Example
I entered on the assumption that I will be hopping into a few hours trade. However, the whole position took more than 30 hours to complete.
Notice that the price broke the few times the green line in bullish direction. However, since I saw that the trend is bigger than usual, I decided to wait for a bigger signal – like a cross between the green and the red line.
16 hours after the beginning of the trade I realized that the trend is big and the price is still moving in my favor. Therefore I adjusted the Stop Loss order tight and I left the trade for the next morning.
When I got up I realized that the trend continues in my favor. Notice that a cross between the red and the green lines occurred. However, the Stop remained untouched and when I got back to the PC, the price was even lower.
Then I noticed another cross between the green and the red Alligator indicator lines. However, I also noticed a bearish trend line formed through the last two tops on the chart. Therefore, I adjusted my Stop above that line with the idea that if the price bounces from the trend, I will catch another bearish impulse.
This is what happened. The price bounced from the pink bearish line and created another low on the chart.
Then I spot that this is not just a bearish trend line (pink), but something like a bearish channel or an Expanding Triangle with bearish indication.
Since the price was reaching the lower level of the figure, I assumed that a pullback is coming. At the same time, the D1 chart was showing that the price is interacting with the 61.8% Fibonacci level of the previous big bullish trend. Furthermore, on the H4 chart there was another channel, which lower level the price was interacting with. I exited the trade on the assumption of an upcoming pullback
Bottom line, I collected 88 pips, which brought profit of 1.18%. Sweet!
START LEARNING FOREX TODAY!
share This:


Leave a Reply