One of the most important skills for successful trading is Forex chart patterns analysis. Learning to recognize price formations on the charts is an essential part of the Forex strategy of every trader. Then, it is vital that you learn about these figures, their meaning and how you can use them to your advantage.
There are 3 main types of Forex chart patterns:
- Continuation: this group includes price extension figures like the flag pattern, the pennant or the wedges (rising or falling).
- Reversal: it refers to patterns where the price direction reverses like the double top or bottom, the head and shoulders or triangles.
- Neutral: these are formations where the price direction is unknown.
Maybe you are wondering how to identify each of these patterns. Moreover, how can you make trading decisions after you draw on? In this guide, we will explain everything you need to know about Forex chart patterns and which are our favorite ones to make profits from the market.
Table of Contents
Forex Chart Patterns and Their Importance in Trading
Chart patterns are a crucial part of the Forex technical analysis. Patterns are born out of price fluctuations, and they each represent chart figures with their own meanings. Each chart pattern indicator has a specific trading potential. As a result, Forex traders spot chart patterns to profit from the expected price moves.
In fact, chart patterns represent price hesitation. When you have a trend on the chart, it is very likely to be paused for a while before the price action undertakes a new move. In most cases, this pause is conducted by a chart pattern, where the price action is either moving sideways, or not very strong with its move.
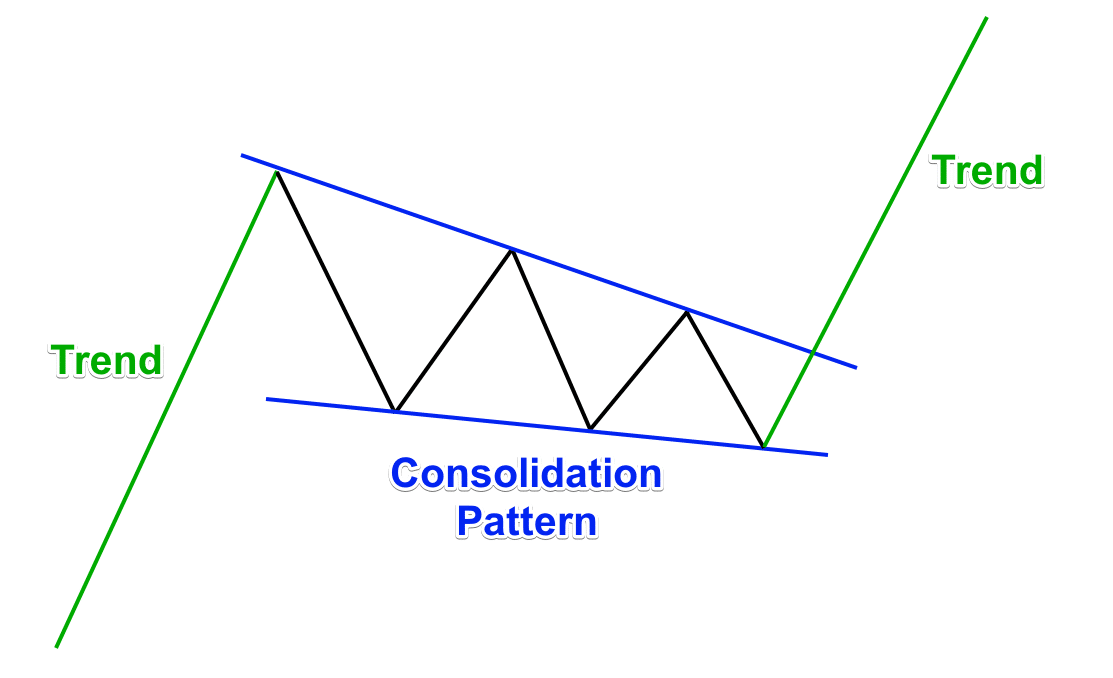
This is a brief sketch of how a chart pattern indicator could look like on the chart. In the example above we have a trend that turns into a consolidation, and then the trend is resumed again.
Types of Forex Chart Patterns
There are three types of chart pattern figures in Forex based on the price movement. Let’s have a look at each group.
Continuation Chart Patterns
Continuation chart patterns are the ones that are expected to continue the current price trend, causing a fresh new impulse in the same direction. For instance, if you have a bullish trend, and the price action creates a continuation chart pattern, there is a big chance that the bullish trend will continue.
The most popular continuation chart patterns are:
- Flags
- Pennants
- and Wedges
The image below depicts them. Each of these six formations has the potential to activate a new impulse in the direction of the previous trend.

Flag Continuation Pattern
This pattern is characterized by bullish or bearish strong price movement preceding a channel formation. The price continues its direction after breaking the channel.
Pennant Continuation Pattern
The main difference versus flags is that the price pauses and fluctuates in a horizontal range that decreases before breaking instead of moving within two parallel lines.
Wedge Continuation Pattern
It is kind of a combination of flags and pennants, with an upward or downward movement in range before the price breaks and continues its original direction.
Reversal Chart Patterns
On the other hand, reversal patterns are opposite to continuation patterns. They usually reverse the current price trend, causing a fresh move in the opposite direction.
For example, suppose you have a bullish trend and the price action creates a trend reversal chart pattern, there is a big chance that the previous bullish trend will be reversed. This is likely to cause a fresh bearish move on the chart.
The most popular reversal chart patterns are:
- Double Tops and Bottoms
- Head and Shoulders
- Wedges
- Expanding Triangles
- Triple Tops and Bottoms
Here is how they look
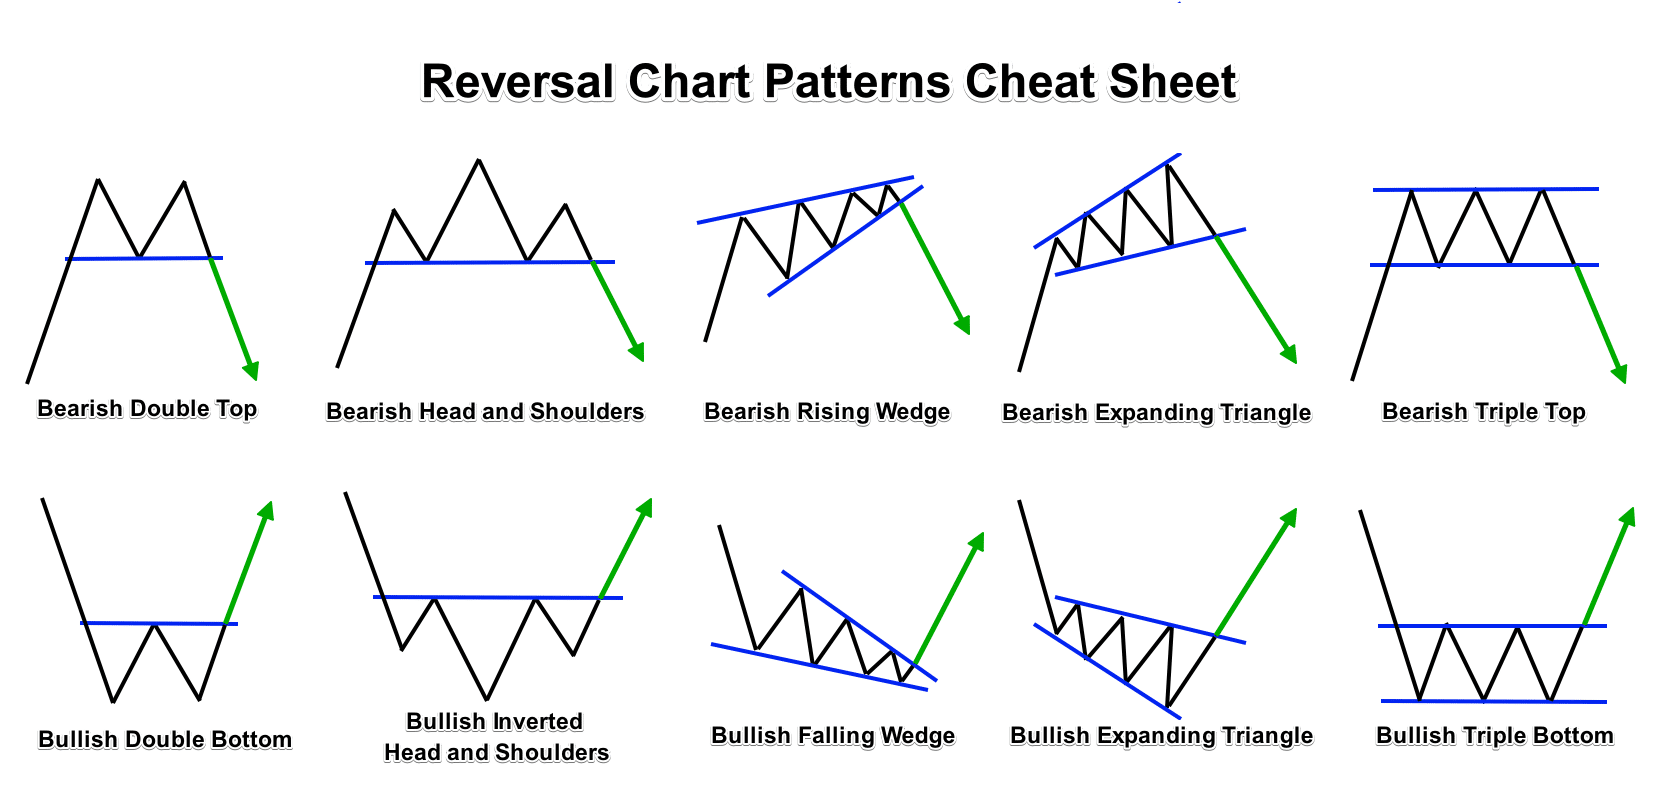
Please note that the Rising and the Falling Wedge could act as reversal and continuation patterns in different situations. This depends on the previous trend. Just remember that the Rising Wedge has bearish potential and the Falling Wedge has bullish potential, no matter what the previous trend is.
Here is a video that shows a real trading example with the Double Bottom Chart Pattern. The video shows a bullish trade taken as a result of a breakout through the trigger line of the pattern:
Neutral Chart Patterns
Last but not least we have neutral chart patters. These formations signal a price move, but the direction is unknown. In the process of the pattern confirmation, traders realize the pattern’s potential and tackle the situation with the respective trade.
For example, let’s suppose the Forex pair is trending in the bullish direction. Suddenly, a neutral chart pattern appears on the chart. What would you do in this case? You should wait to see in which direction the pattern will break. This will give you a hint about the potential of the pattern.
The most popular neutral chart patterns are Triangle patterns:
- Ascending Triangle
- Descending Triangle
- Symmetrical Triangle
- Symmetrical Expanding Triangle

These are the most common neutral chart patterns that have the potential to push the price in either the bullish or the bearish direction.
Now you have around 20 different chart pattern examples. But which are the best chart patterns to trade?
We will discuss this in the next section of the guide.
Our Top Forex Chart Patterns
Now that we have shared the chart patterns basics, we would like to let you know which are the best chart patterns for intraday trading. Then we will give you a detailed explanation of the structure and the respective rules for each one.
So our top Forex Chart patterns are:
- Flags and Pennants
- Double Top and Double Bottom
- Head and Shoulders
The Flag and the Pennant are two separate chart patterns that have price continuation functions. However, we like to treat these as one as they have a similar structure and work in exactly the same way.
How to Trade Flags and Pennants
The Flag chart pattern has a continuation potential on the Forex chart. The bull Flag pattern starts with a bullish trend called a Flag Pole, which suddenly turns into a correction inside a bearish or a horizontal channel.
Then if the price breaks the upper level of the channel, we confirm the authenticity of the Flag pattern, and we have sufficient reason to believe that the price will start a new bullish impulse.
For this reason, you can buy the Forex pair on the assumption that the price is about to increase. Place your Stop Loss order below the lowest point of the Flag.
Bullish Flag Pattern Example
The Flag pattern has two targets on the chart. The first one stays above the breakout on a distance equal to the size of the Flag. If the price completes the first target, then you can pursue the second target that stays above the breakout on a distance equal to the Flag Pole.
For instance, this Flag chart pattern example to see how it works in a real-life trading situation:
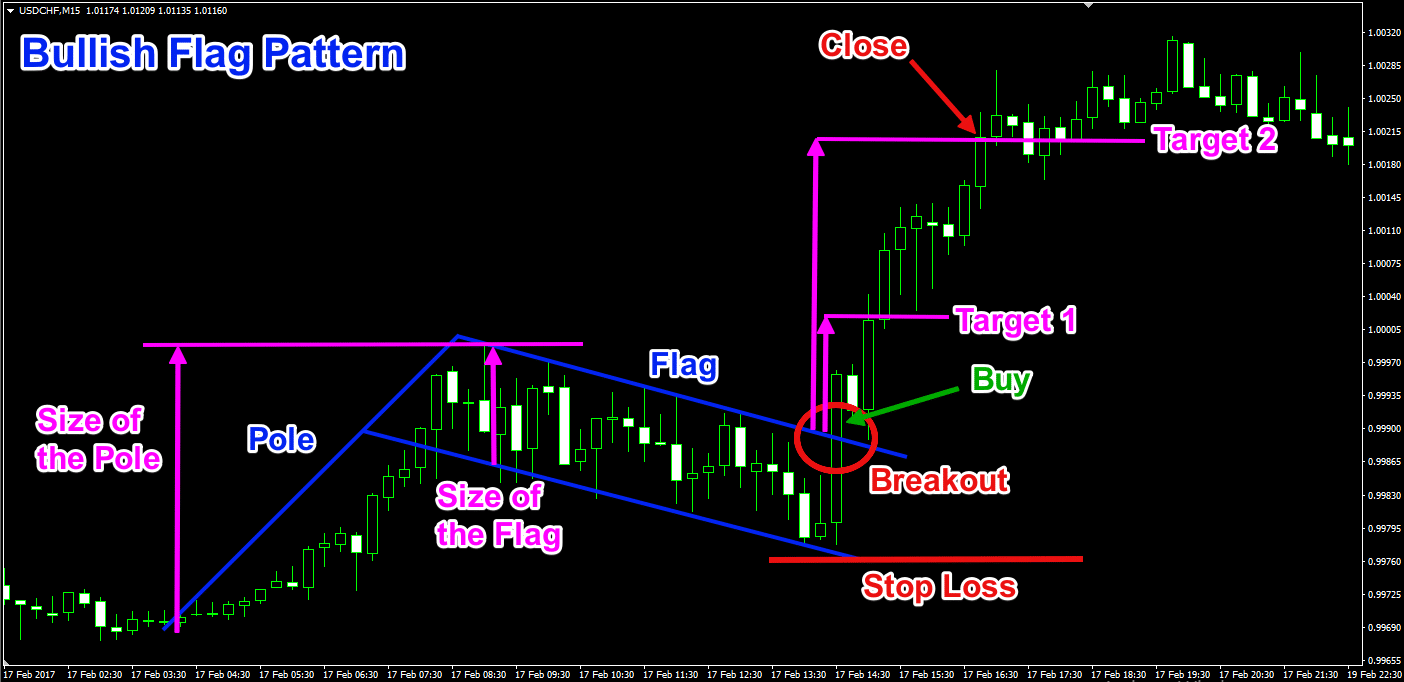
This is an example of a bullish Flag chart pattern on the 15-minute chart of the USD/CHF for February 17, 2017.
In addition, the two pink arrows show the size of the Flag and the Flag Pole, applied starting from the moment of the Flag breakout. The Stop Loss order of this trade stays below the lowest point of the Flag as shown on the image.
Bullish Pennant Pattern Example
The Pennant chart pattern has almost the same structure as the Flag. A bullish Pennant will start with a bullish price move (the Pennant Pole), which will gradually turn into a consolidation with a triangular structure (the Pennant). Notice that the consolidation is likely to have ascending bottoms and descending tops.
Moreover, if the price breaks the upper level of the Pennant, you can pursue two targets the same way as with the Flag. The first target equals the size of the Pennant and the second target equals the size of the Pole.
At the same time, your Stop Loss order should go below the lowest point of the Pennant.
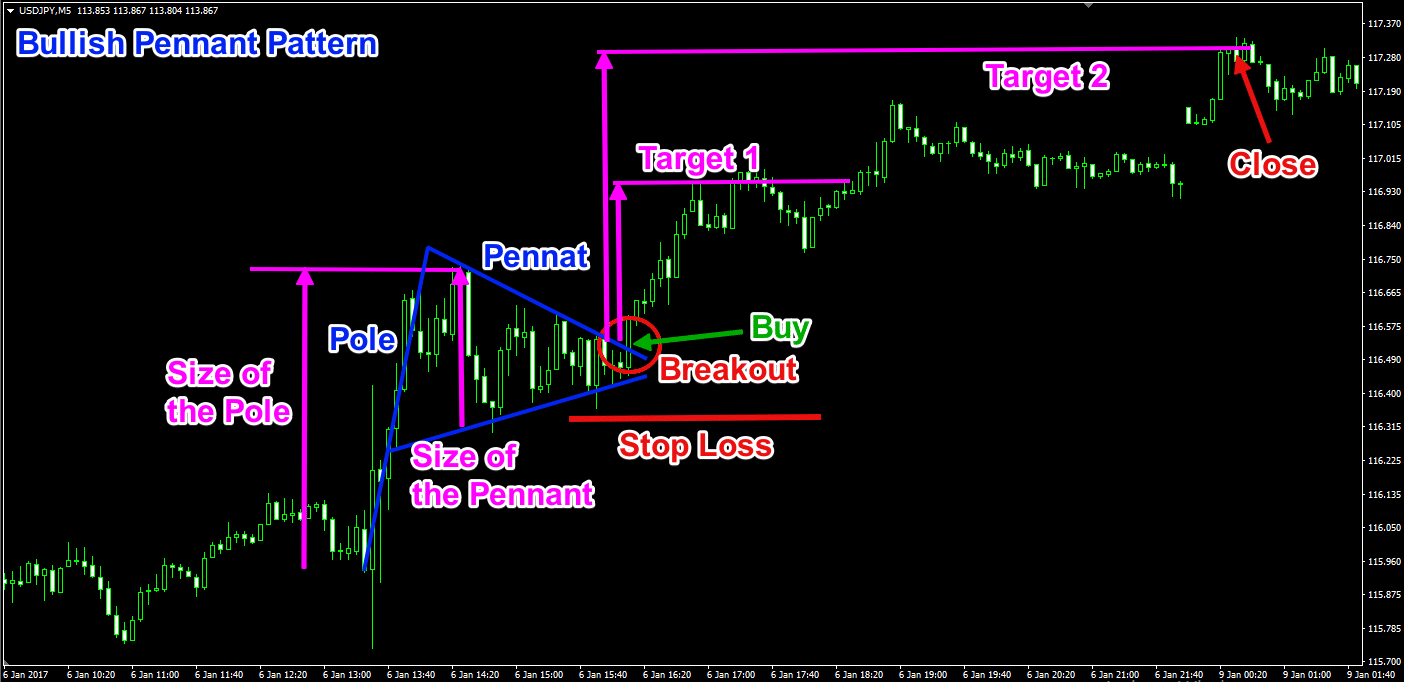
This time we approach the 5-minute chart of the USD/JPY for January 6, 2017. The image gives an example of a bull Pennant chart pattern.
As you see, Flags and Pennants’ technical analysis works exactly the same way. The only difference is that the bottoms of the Pennant pattern are ascending, while the Flag creates descending bottoms that develop in a symmetrical way compared to the tops. This is the reason why we put the Flag and Pennant chart patterns indicator under the same heading.
How to the Double Top and Bottom Chart Pattern
The Double Top is a reversal chart pattern that comes as a consolidation after a bullish trend, creates a couple of tops approximately in the same resistance area and starts a fresh bearish move.
Conversely, the Double Bottom is a reversal chart pattern that comes after a bearish trend, creates a couple of bottoms in the same support area, and starts a fresh bullish move.
We will discuss the bullish version of the pattern, the Double Top chart pattern, to approach the figure closely.
To enter a Double Top trade, you would need to see the price breaking through the level of the bottom that is located between the two tops of the pattern. When the price breaks the bottom between the two tops, you can short the Forex pair, pursuing a minimum price move equal to the vertical size of the pattern measured starting from the level of the two tops to the bottom between the two tops.
Your Stop Loss order should be located approximately in the middle of the pattern.
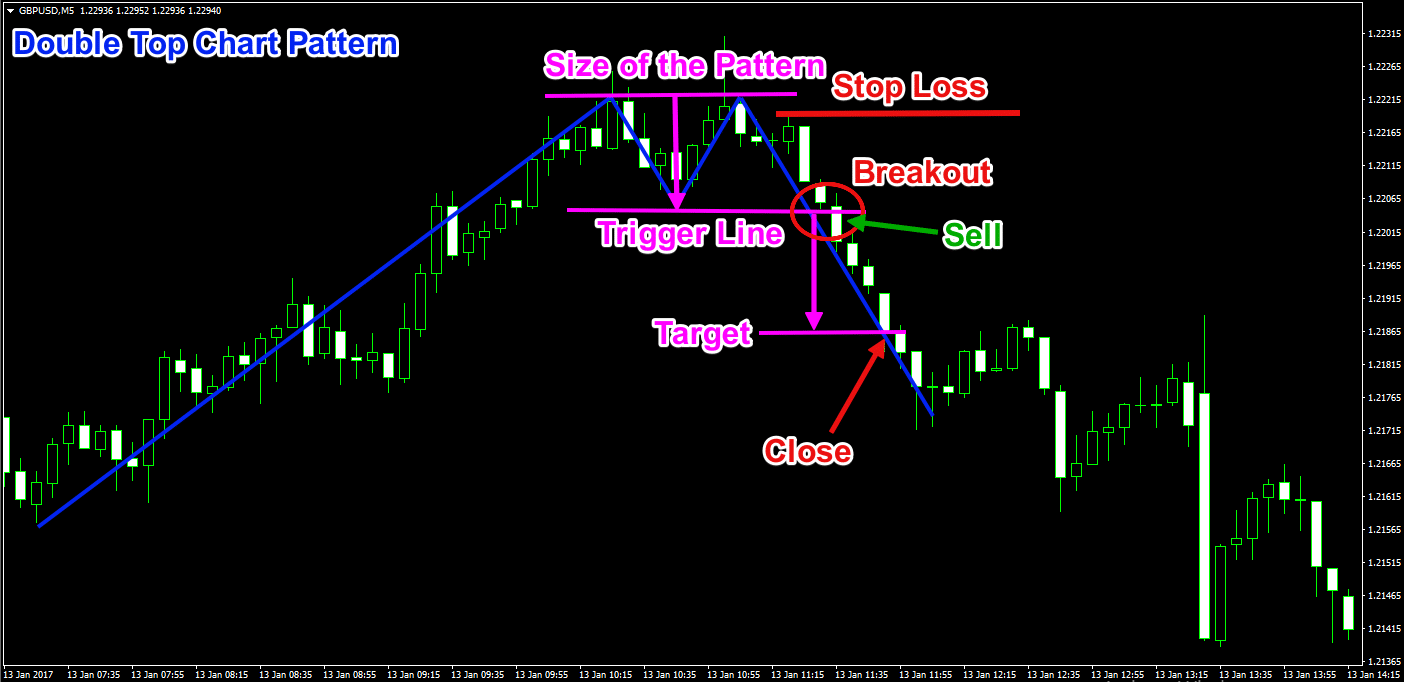
The 5-minute chart of the GBP/USD for January 13, 2017, shows an example of a Double Top pattern technical analysis. The pink lines and the two arrows on the chart measure and apply the size of the pattern starting from the moment of the breakout.
After the breakout entry signal on the chart, you need to short the GBP/USD Forex pair placing a stop loss order inside the pattern. To clarify, we use a small top after the creation of the second big top to position the Stop Loss order.
Notice that the Double Bottom chart pattern works exactly the same way but in the opposite direction.
Similarly, the Head and Shoulders is another famous reversal pattern in Forex trading. It comes as a consolidation after a bullish trend creating three tops. The first and third tops are approximately at the same level. However, the second top is higher and stays as a Head between two Shoulders. This is where the name of the pattern comes from.
How to Trade the Head and Shoulders Pattern
The Head of the pattern has a couple of bottoms from both of its sides. The line connecting these two bottoms is called a Neck Line. When the price creates the second shoulder and breaks the Neck Line in a bearish direction, this confirms the authenticity of the pattern.
When the Neck Line breaks, you can pursue the bearish potential of the pattern that is likely to send the price action downward on a distance equal to the size of the pattern – the vertical distance between the Head and the Neck Line applied starting from the moment of the breakout.
Your Stop Loss order in a Head and Shoulders trade should go above the second shoulder of the pattern.
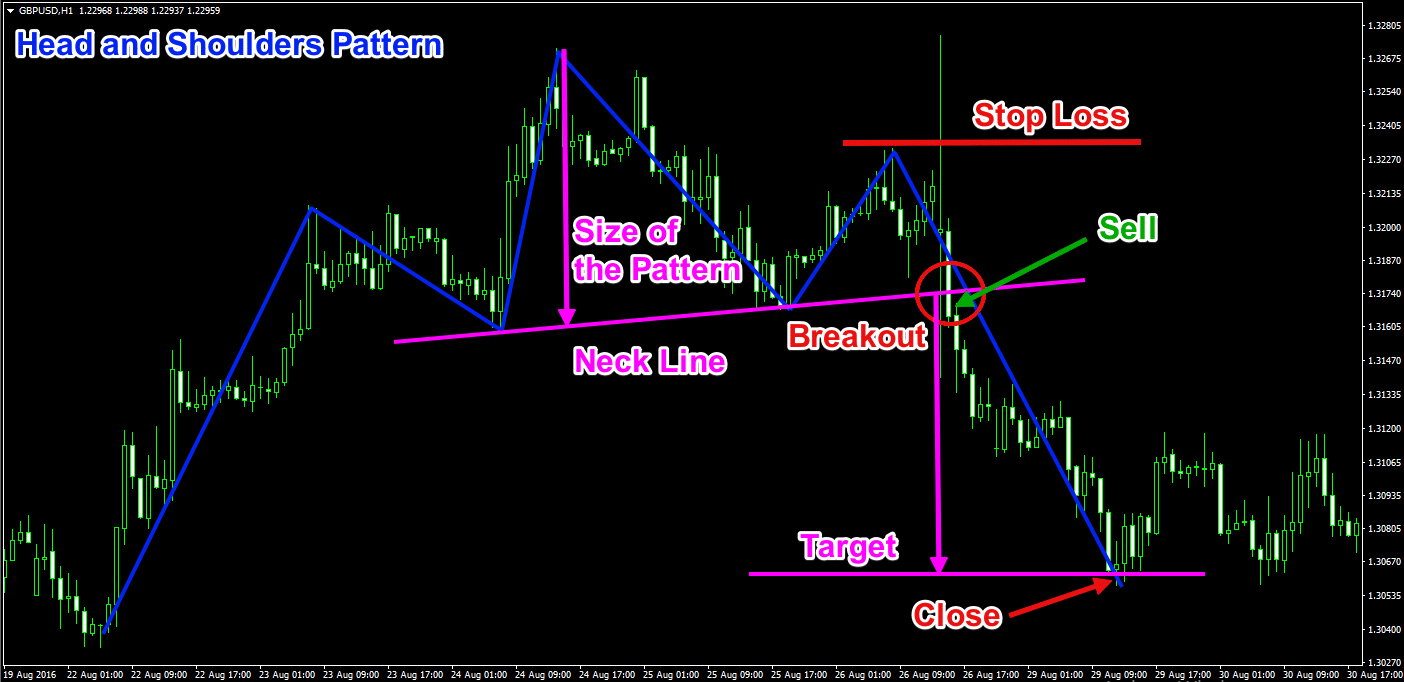
Above you can see a real Head and Shoulders chart pattern on the H1 chart of the GBP/USD for August 19-30, 2016. The inclined pink line is the Neck Line of the figure. The two arrows measure and apply the size of the Head and Shoulders starting from the moment of the breakout through the Neck Line. The red circle shows the head and shoulders chart pattern breakout.
You need to hold a bearish trade until the price completes the size of the pattern in a bearish direction. At the same time, your Stop Loss order should go above the second shoulder as shown on the chart.
As with the other patterns we have discussed, the Head and Shoulders chart pattern has its opposite version – the Inverse Head and Shoulders pattern. It acts absolutely the same way, but everything is upside down. If you would like to learn more about the Head and Shoulders chart pattern, check this live trading example.
Pro Tip: using MetaTrader 4 Zigzag Indicator to spot Chart Patterns
One of the best-kept secrets from seasoned traders lies around a chart pattern recognition indicator. The good news is you can also have it. It is built into the default version of the MetaTrader 4 trading platform.
The indicator is called ZigZag. What it does is to represent the general price action with straight lines by neglecting smaller price fluctuations and putting emphasis on the real-deal price moves. This way you can very easily visualize a real pattern on the chart.
To clarify, let me show you our chart pattern recognition algorithm in action:
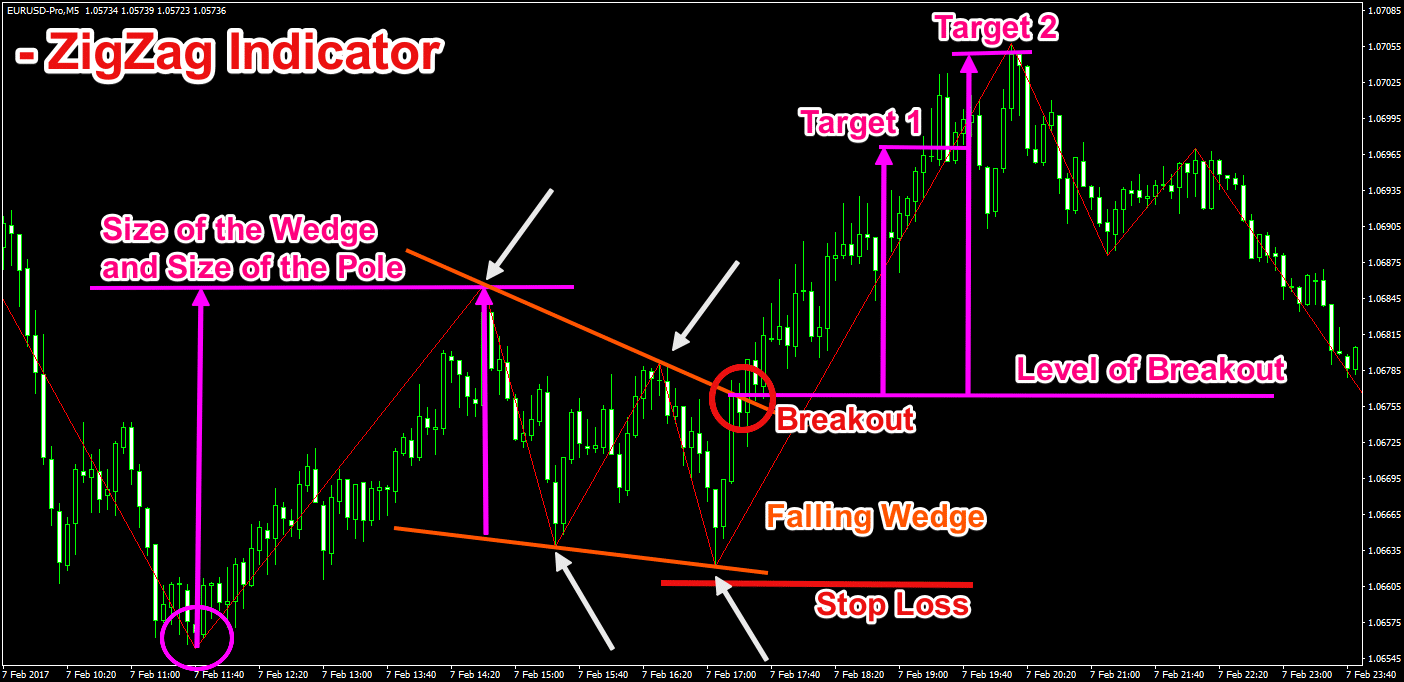
Above you can see the 5-minute chart of the EUR/USD for February 7, 2017. The chart includes the ZigZag indicator expressed by the straight red lines on the chart.
In the middle of the chart, we see that the ZigZag lines are creating descending tops and descending bottoms, which is a symptom of a Falling Wedge chart pattern. See that the highs and the lows of the pattern stand out in a very pleasant way thanks to the ZigZag indicator. You can hardly miss the pattern on the chart.
In the red circle we see the breakout through the upper level of the pattern – the confirmation. Then we can trade for the two targets of the pattern. The first one equals the size of the wedge – marked with the smaller pink arrow. The bigger pink arrow measures the size of the Pole. Both should be applied starting from the moment of the breakout.
Notice that you should protect your trade with a Stop Loss order that needs to go below the lowest bottom of the Falling Wedge pattern, as shown in the image.
As a result, the price action completes both targets.
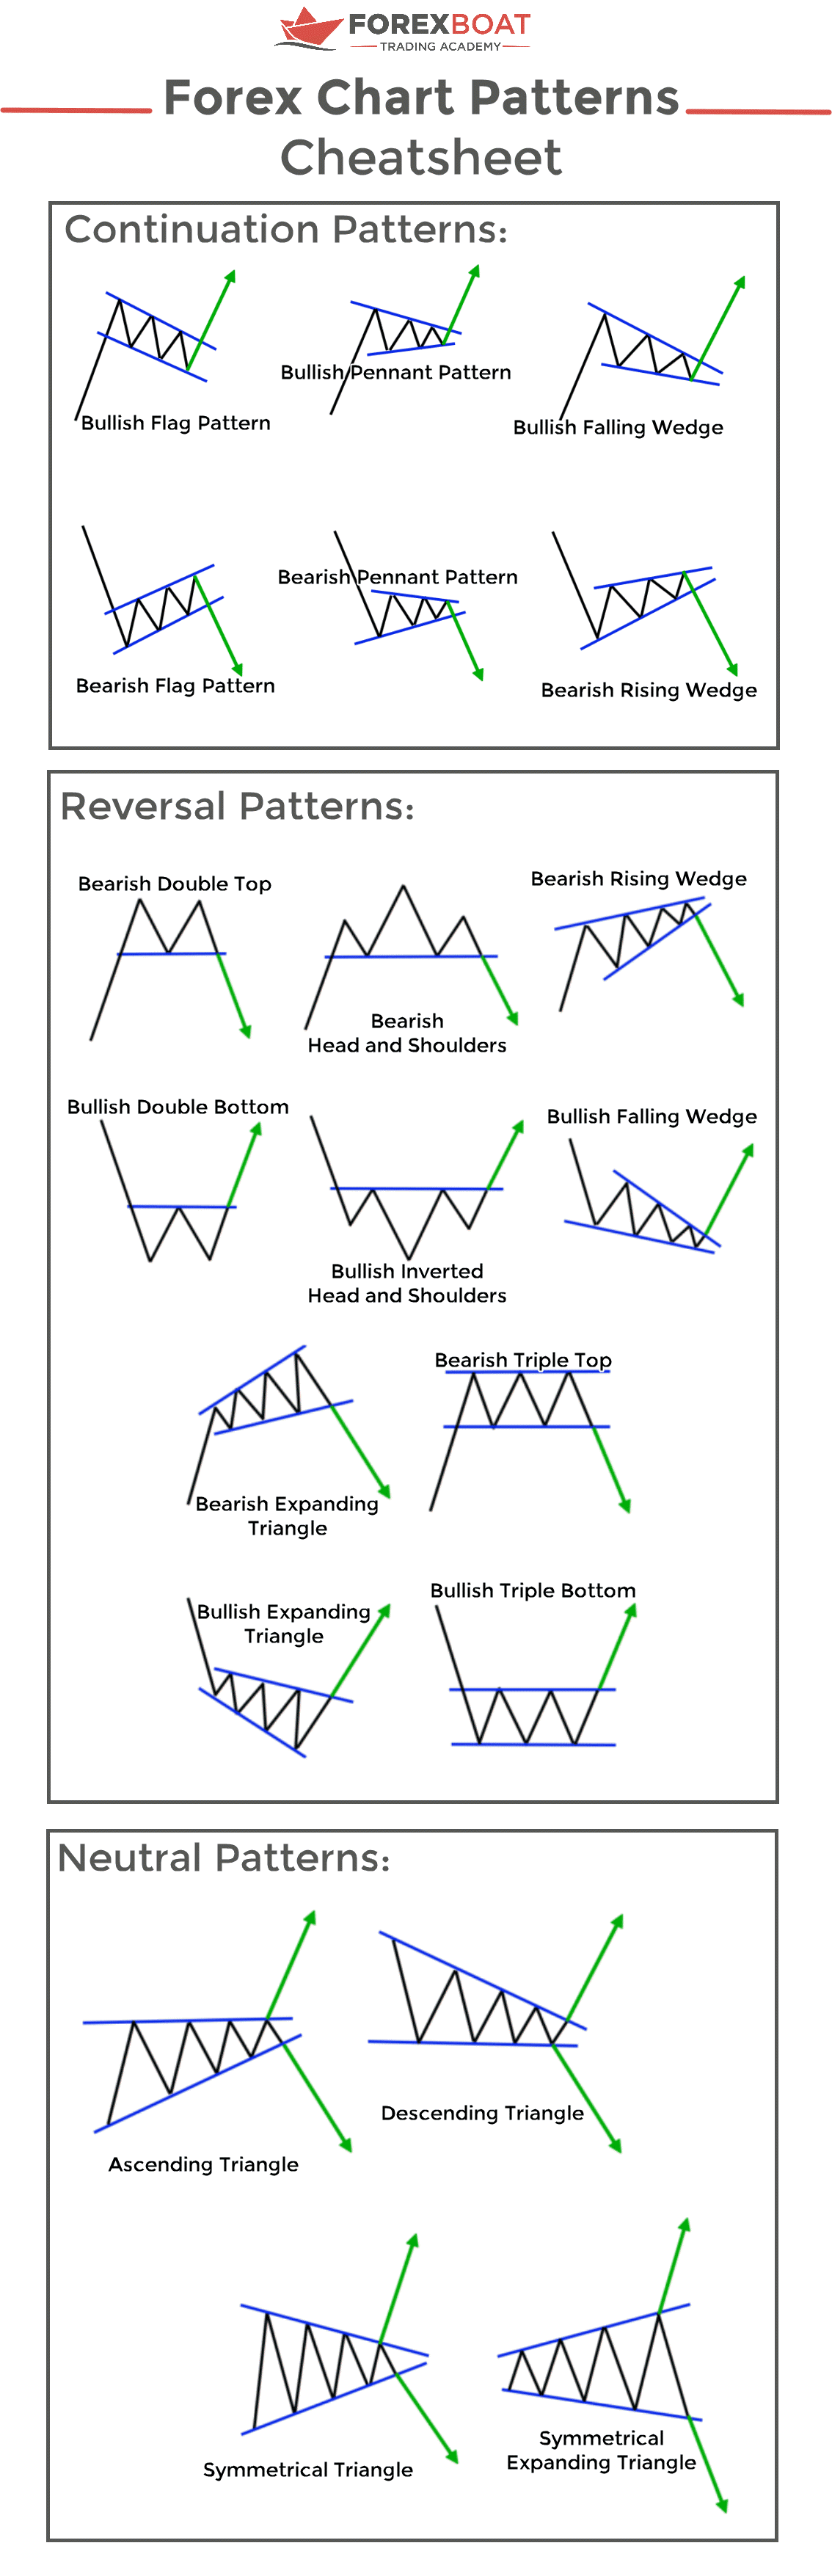
Bonus: Forex Chart Patterns Cheatsheet
Click here to download our cheat featuring all the patterns that were explained in this guide.
Your Turn
To sum up, the forex chart patterns technical analysis is a crucial part of the Forex price action trading. We had a look at the most common price formations and which ones are our favorites to trade.
Now is the time for you time apply what you have learned in this guide and drop a comment below if you have any questions.


Leave a Reply