In this material I will introduce you to a very interesting custom indicator used to spot current trends. This is the Forex Dashboard Indicator that goes on your chart and signals the trending status of Forex pairs. Here you will learn the details of this indicator and you will also be able to download the Trading Dashboard for free!
Forex Dashboard
A Forex dashboard makes it easier for a trader to manage his/her account, trades, and strategies. It works in any form the trader needs it, and it can display any data (as a multiple time frame indicator, as a trading dashboard, etc.).
A graphical summary of various pieces of important information that is used to give an overview: this is one of the definitions of a dashboard. So, you can operate with a dashboard in many fields, including Forex. It gives the user what information he needs and thinks is most important.
Trend Analysis
The general direction of a market or the price of an asset and its trend can vary in length. This is how Investopedia defines a trend.
We, as traders, know that “trend is your friend” and we want to take advantage of it. So, in most cases, we will trade with the trend to maximize our profits.
We can also trade against the trend, but that requires a little more experience and practice.
Defining a Trend
The easiest way to define a trend technically is by using moving averages. A trader can define a trend by using only one moving average, or several different moving averages.
If the price moves above the average, we have an ascending trend. If it moves below, we have a descending trend.
The indicator we have created for you uses two moving averages with different periods. You can change the settings to best fit your needs.
If you need more information about how to trade using moving averages, you can check our article about the Best Moving Average Strategies for Day Trading.
Multiple Time Frame Analysis
Multiple time frame analysis, as the very term implies, means to perform the same analysis on different time frames. There is no predefined limit for the number of time frames on which the analysis should be performed, or which ones to choose. Most traders use three time frames when making this analysis. For example, you can use 15 minutes, 1-hour and 4-hour charts.
This type of analysis helps traders to understand the Forex market better than a single time frame analysis. It gives us a better chance of success when all time frames give us the same trade signal.
Multiple Time Frame Indicator
A Forex multiple time frame indicator can perform the analysis on different time frames. They can be offline charts, and you do not need to open them. It will give the result on your current chart.
For example, you have the 5-minute chart open to observe the small changes in the market. You want to enter a trade, and you need to know the direction of the market. The indicator will give you the information in your current chart. You will not need to open the chart or change the time frame to see it. This type of indicator will do this for you, so you do not have to check everything manually. It makes your trading easier.
Trading Dashboard Indicator
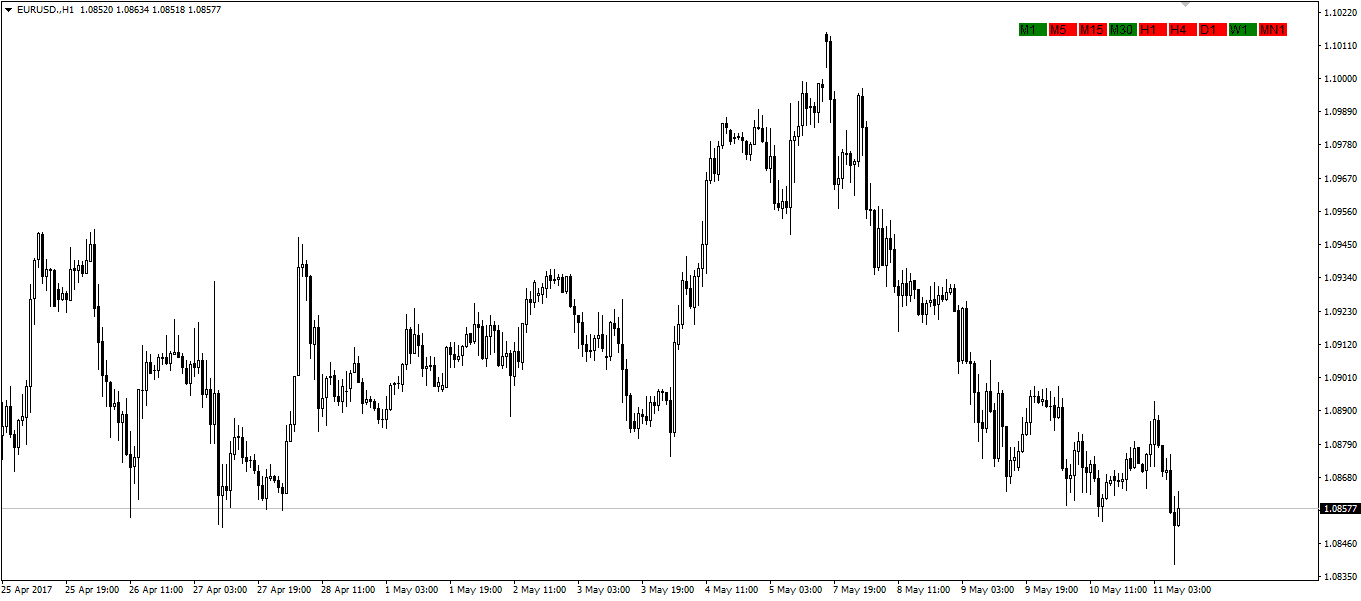
A Forex dashboard indicator will show you the information you want to know from all the time frames on your current chart. For example, it can show you the trend on all time frames for the selected currency pair.
In this example, I have created a multiple time frame trend indicator. It is a simple moving average-based dashboard which defines trends by comparing the averages.
If the short period moving average is above the long period moving average, the trend is bullish. Conversely, if the short period moving average is below the long period moving average, the trend is bearish. If the moving averages have the same value, the trend is neutral.
You can play with the inputs to fit your needs.
How to Use the Dashboard
This is a day trading dashboard, mostly used for short-term intraday trades. I like to use this type of dashboard to get the general direction of the market. After I do it and if at least three consecutive time frames have the same direction, I’m in luck. I will make the technical analysis on the highest time frame.
Look for support and resistance lines and chart patterns if there are any. After the confirmation of one of the lines, I will enter the trade in the direction given by the indicator on those time frames.
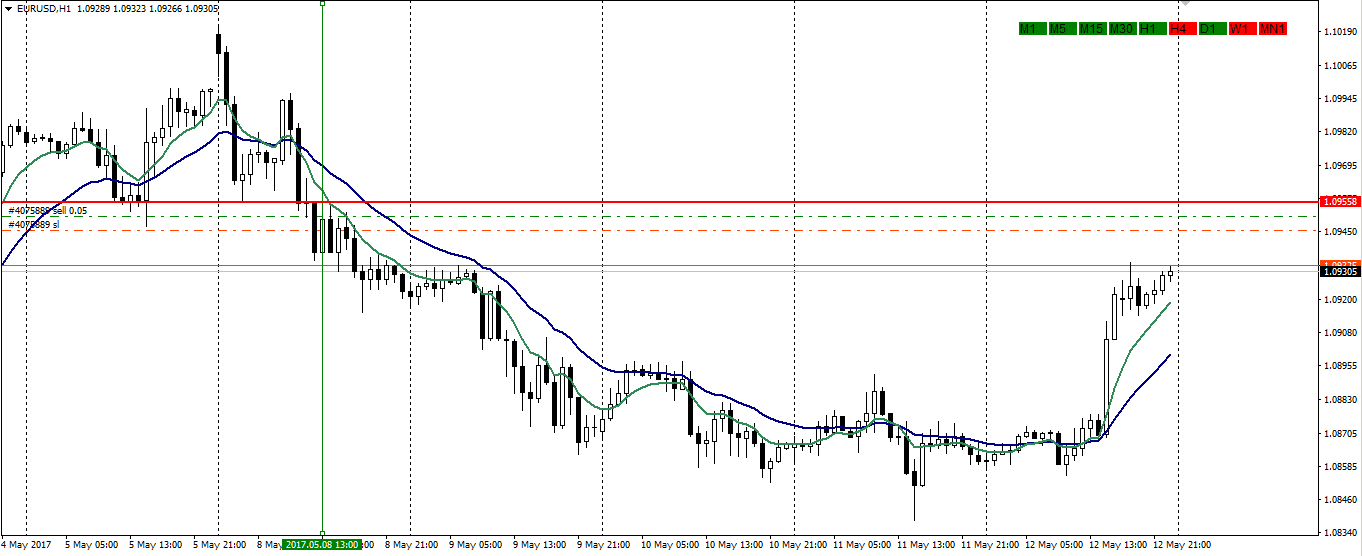
In the following example, I had four consecutive time frames which showed a downtrend. From 1 minute to 1 hour. I waited for the confirmation and entered the sell trade.
After the entry, the 4 hours also showed a change in the trend. Therefore, I kept the trade. Now the averages cross back up on the 4-hour chart. I will wait and see if my trade will be closed or if it will continue to make a profit.
The right way to close the trade is when the moving averages cross in the opposite direction. You should look for the exit cross of the day trading dashboard indicator on the same time frame you used to open the trade.
![]()
Forex Dashboard Download
Now that you have your own trading Dashboard, it is time to proceed with some technical details regarding this very powerful indicator.
Dashboard MT4 Inputs
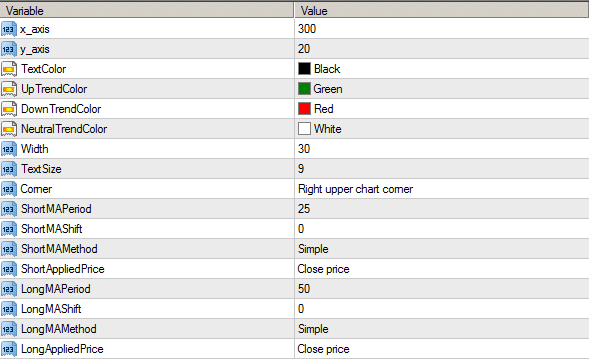
I will now name all the inputs of the indicator so you will know what is behind this wonderful tool:
- X-Axis defines the distance between the selected corner on the X-axes and the dashboard.
- Y-Axis defines the distance between the selected corner on the Y-axes and the dashboard.
- TextColor defines the color of the time frame text.
- UpTrendColor defines the background panel color for the time frame text when the moving averages determine an uptrend.
- DownTrendColor defines the background panel color for the time frame text when the moving averages determine a down trend.
- UpTrendColor defines the background panel color for the time frame text when the moving averages have the same value.
- Width defines the background panel width.
- Text size defines what size the text will be.
- Corner defines the position of the Forex dashboard on the chart.
The rest are the parameters for the two moving averages.
You can see in the next image the multiple time frame trend indicator MT4 inputs:
Conclusion
As traders, our aim is to trade consistently and to minimize the personal interpretation of charts. The use of indicator-based strategies is part of that. If you manage to do it right, you will be surprised by the results. Our trading results improve, and we are more relaxed during trading hours.
Multiple time frame analysis is a must during day trading. Placing it into an easy-to-use dashboard, saves a lot of time that was previously spent on interpreting charts. By using dashboards, you minimize the time that can be now used on finding other trade opportunities.
If you run out of ideas for new dashboards, just Google “Forex dashboard download”. It will give you a lot of suggestions.
Keep in mind that there are three ways to win in this business: be first, be smart, or cheat. Choose wisely.
START LEARNING FOREX TODAY!
share This:


Leave a Reply