Fundamental and technical analyses represent the core of any Forex trading process. These two concepts represent major schools of thought in approaching and understanding the markets. Both have the same goal: understanding the historical behavior of markets to forecast future trends; however, the path towards that goal is different.
Fundamental analysis in Forex focuses on the impact that economic events and news have on the price of a currency pair or financial instrument. Technical analysis focuses on charts. This under the assumption that the price reflects all the information available.
In this blog post, we look at definitions of fundamental and technical analysis, strengths and weaknesses of each one, as well as how you can combine both to make the most.
As such, these two stand at opposite ends of the spectrum. Still, we will demonstrate how to maximize their advantages and limit exposure to their weaknesses. It is important to note that both aim to determine the value of an asset in question. However, they differ in methods on how to reach that goal.
Table of Contents
Spoiler Alert: both concepts can work in a complementary manner, where the strengths of each side work together to form a winning formula.
Forex Fundamental Analysis Explained
Fundamental analysis aims to measure the natural or inherent value of the asset. In Forex, fundamental analysts tend to analyze currencies and all fundamentals that impact the currency’s value.
For instance, analysts will check the monetary and fiscal policy of the Reserve Bank of Australia (RBA), Government of Australia, legislation, regional developments, prices of gold, etc. Hence, the fundamental analysis analyzes every aspect that contributes to the measuring of the overall value of an asset.
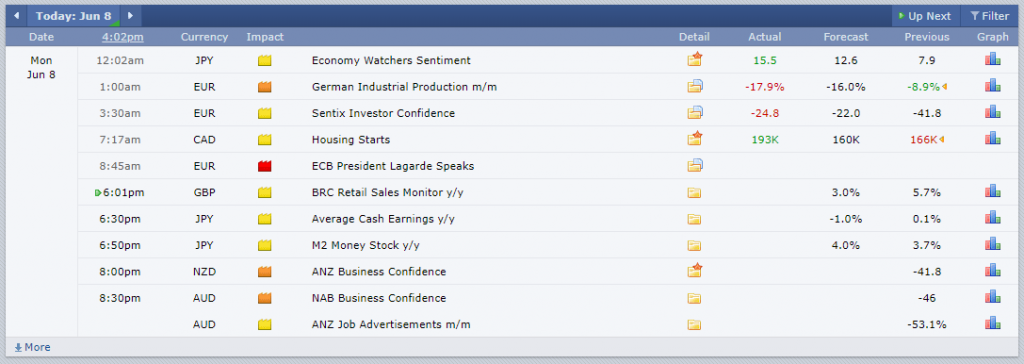
One of the most critical aspects of the fundamental analysis is the news and the economic calendar. It consists of a list of major financial news, data releases, and political events that are likely to facilitate a certain level of impact on the market prices.
The Economic Calendar
An economic calendar contains a list of news events and other dates that might have a significant impact on currencies and financial markets in general.
Investors use the economic calendar to define their trading strategy and set time constraints. Due to the economic calendar’s importance, there are entire trading strategies based on a list of events and news, as they tend to increase the volatility in markets.
Forex Factory Economic Calendar (Source: ForexFactory)
Note: You can learn how to use the Forex Factory Calendar here.
These economic calendars usually have three types of “impact” that are expected in the financial market. Those that are less relevant and expected to have a minor impact on the market are usually characterized as “low”. The “medium” is reserved for news, events, and data, which have a more significant impact on the currency market.
Finally, events that could have a significant impact on markets are marked as “high” or “critical”. For instance, you will find GDP data release, non-farm payroll numbers, central bank interest rate decisions, CPI data, unemployment figures, etc.
For this reason, investors and traders tend to pay close attention to the marked “high” events. Before these events, volatility is usually very low as investors consolidate their energy and firepower when the volatility picks up following the release of data. Alternatively, the market will move in one direction as traders close their positions ahead of the announcement.
Fundamental data has two sub-groups: forecasts and projections.
Let’s take a look at the GDP data. This fundamental indicator measures the value of final goods and services produced in a country in a given period of time. It is considered to be one of the most important indicators used by economists to monitor a nation’s economic health.
Therefore, traders will pay special attention to the release of GDP data. Major global providers of financial market data and infrastructure will survey analysts that are monitoring the state of, let’s say, New Zealand’s economy continuously. Then, the results of a survey will come as a prediction.
The released GDP numbers will then be compared to the projections. Also, traders will look at the results last quarter, or the same quarter from the previous year (Q1 2019 v Q1 2020).
How to trade news and data releases
GDP Economic Event Example
As an illustration, the recent GDP data may show that New Zealand’s economy is rising above market expectations. This is likely to make the New Zealand dollar (NZD) surge higher against all major currencies.
In contrast, if the GDP data is disappointing and comes in below the analysts’ estimates, it will theoretically push the NZD lower.
New Zealand’s GDP for Q3 2019 (Source: FXStreet)
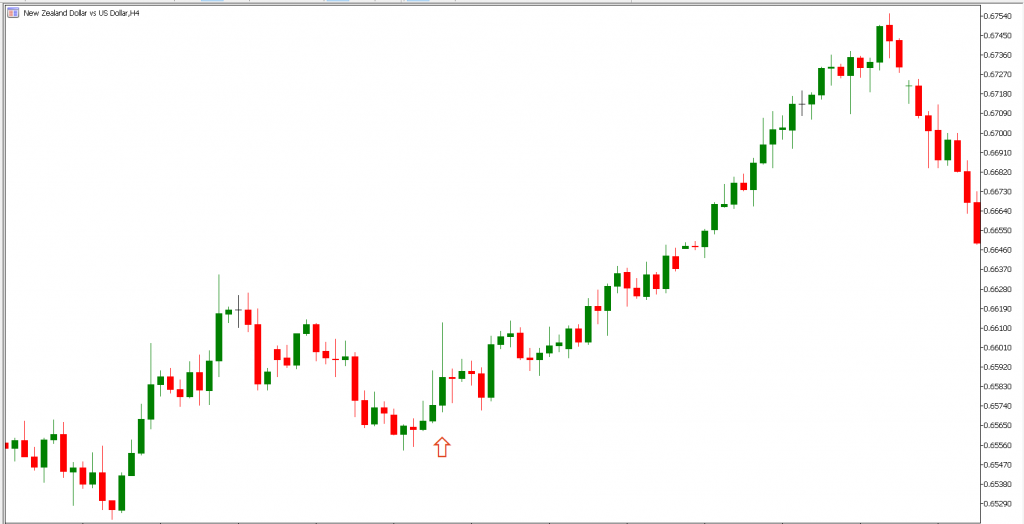
Above, you see that New Zealand’s GDP was reported at 0.7%, which is better than 0.6% that the market expected and 0.6% for the previous quarter. Below, we see a market reaction to this high-impact data release.
NZD/USD reaction on the GDP data release (MetaTrader4)
First, we can note the increased volatility. You see the wick to the upside that signals the reaction of automated trading bots to the better-than-expected GDP numbers.
In situations like this, we suggest to stay away from the market and wait until the dust settles. Then, you should look for an opportunity to buy the NZD and hope that the market will continue to trade in the same direction due to the higher-than-expected GDP data.
Unemployment Rate Event Example
Another example may be the unemployment rate, a metric that calculates the percentage of unemployed workers in the total labor force. This indicator is essential since it is a primary metric that reflects the state of a country’s labor market and, therefore, a key factor of the nation’s economy. As such, it will have a substantial impact on the currency market.
If there is a rising trend in the unemployment rate, it could signal that the economy is weakening and vice versa. Analysts will again form projections for this month’s or quarter’s unemployment rate, and the currency market will react following the latest unemployment rate numbers.
All in all, fundamental analysis suggests focusing more on the financial, economic, and political developments surrounding a nation’s currency. As an illustration, a bank’s analysts may calculate that the AUD should trade around the $0.70 mark against the USD due to differences in monetary policy.
Given that, for example, the AUD/USD currently trades at $0.7350, the conclusion is that there is room for a move lower as the AUD/USD market is overvalued.
Forex Technical Analysis Explained
As outlined in the introduction, technical analysis stands on the other side of the spectrum compared to fundamental analysis. According to technical analysts, all fundamental factors that impact the currency market like political developments, central bank decisions, GDP, CPI, etc., are already priced in.
Therefore, the job of a market analyst or a trader is to pay attention only to the historical price action in the charts to forecast future trends and find profitable market opportunities. Many technical analysts rely on indicators to help them identify patterns and trends.
Forex Technical Indicators
There are hundreds of different technical indicators, developed and used by market analysts and traders worldwide. All with one aim: predict future price movements. Here are some of the most popular technical indicators and chart patterns:
Trend Lines
A trend line is generally defined as a diagonal line that connects a minimum of two or more important price pivot points. The more reliable trend lines connect multiple levels, each touch provoking the price action to react.
Only those trend lines that are tested by the price action can act as support and resistance levels. This makes them reliable and useful. Trend lines are also an essential element of many chart patterns, such as wedges, triangles, flags, etc.
The Moving Average
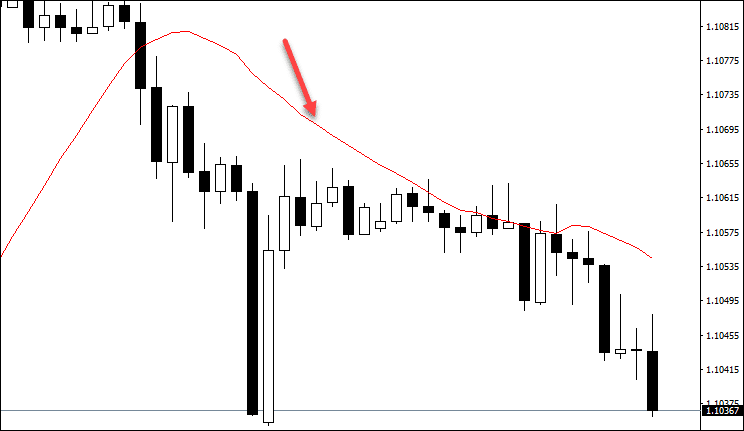
The moving average (MA) is one of the simplest and most commonly used technical indicators used by traders to predict future trends and identify chart patterns. In essence, the MA shows the average price of an asset over the set period.
The most common moving average lengths are 100 and 200, mostly used on higher time frames like 4H, daily or weekly. The lower periods are mainly used for scalping with the MAs based on lower periods like 10, 20, etc.
As a technical indicator, moving averages help traders to identify levels of support and resistance. This could be useful to close existing trades or dip into the market, signaling opportunities when the market interacts with the MA.
Volume
Volume is an essential part of the chart. This indicator shows the amount of an asset that was traded over a specified period of time. Traders and analysts use volume to gauge the legitimacy of certain moves.
For instance, if a move higher in EUR/USD occurred with a strong volume, it is a legitimate move given that “real” money was behind it. Conversely, strong moves without high volumes most likely end up being false breakouts.
Similar to trend lines, the volume is an essential part of specific chart patterns. As an illustration, traders use volume to confirm a breakout in triangles, head and shoulders, many reversal patterns, etc.
Fibonacci Levels
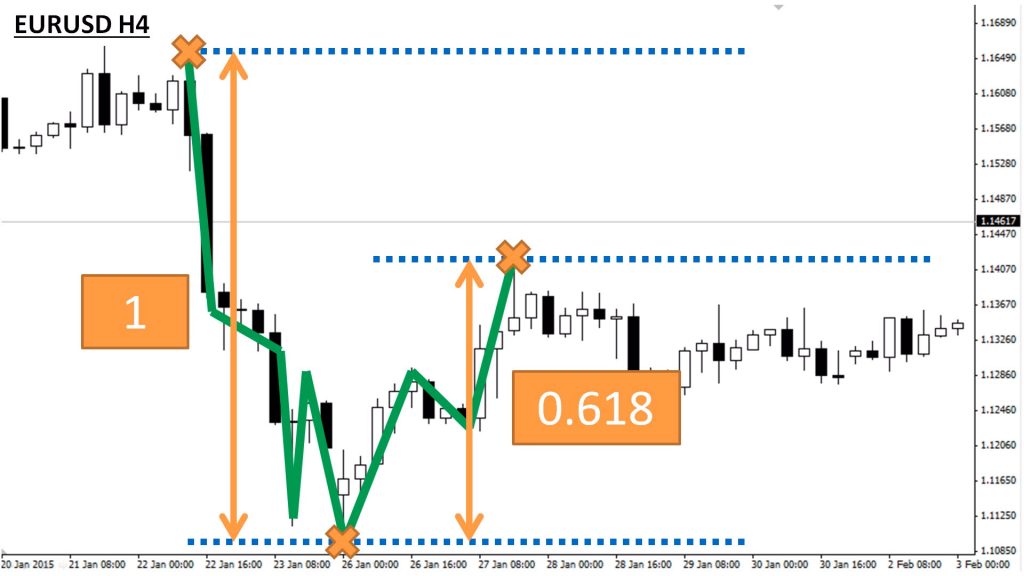
Fibonacci numbers are a more advanced charting tool. There are numerous versions of this indicator, but two of the most popular are retracements and extensions. The basic idea behind the deployment of Fibonacci is to identify levels where the price may react.
When it comes to retracements, the most important levels are: 23.6%, 38.2%, 50%, 61.8% and 78.6%, with the three central numbers, namely 38.2%, 50% and 61.8%, seen as key levels. This indicator is used by measuring a move from point A to point B. Once the B is in place, we look at levels to which the price action may pull back before potentially continuing in the same direction.
As for the extensions, levels of 127.2% and 161.8% are the most popular line extensions. Unlike the retracements that measure pullbacks, extensions look at levels that take place behind the point B. This way, analysts identify prices where the current rally may stop after breaking the support/resistance.
Oscillators
Oscillators represent a group of technical indicators widely used in Forex due to their ability to signal a possible trend change. The most popular oscillators are the Relative Strength Index (RSI), Stochastic Oscillator, or Moving Average Convergence/Divergence (MACD).
Their role is to gauge the market sentiment and generate a signal that the market is trading in an overbought or oversold condition. This way, traders are wary that the reversal may occur and prepare for a move in the opposite direction of the prevailing trend.
Chart Patterns
In addition to indicators, forex chart patterns are also the foundation of technical analysis. Chart patterns are recognizable formations of price movements that have a repetitive nature. This way, traders can use these formations to predict future price movements and trend direction.
In general, we divide chart patterns on reversal and continuation formations. The former are those that capture the shift in trend direction, while the latter takes place when the existing trend extends or continues.
Here we take a look at a few chart patterns that are popular in Forex:
Triangles
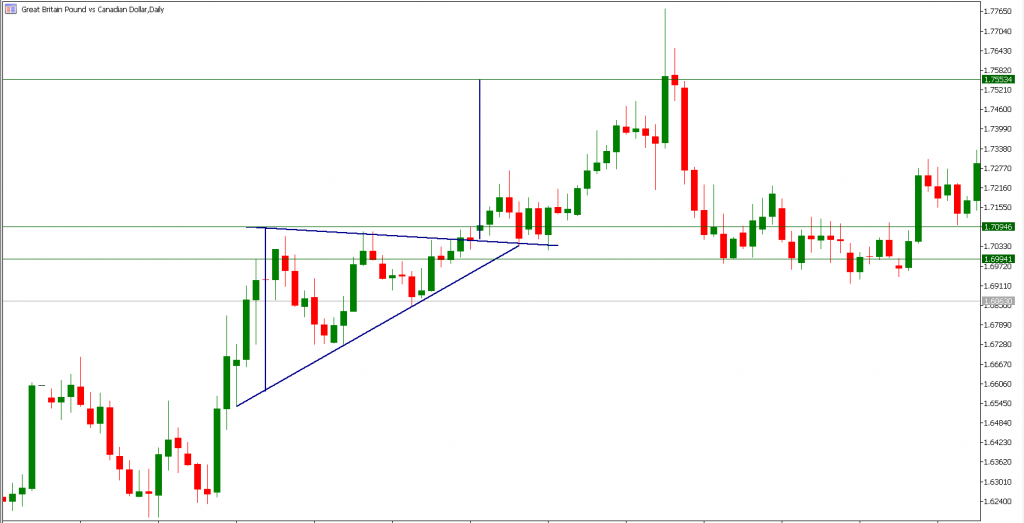
The triangle pattern has three basic versions – ascending, descending, and symmetrical. All three versions consist of two basic trend lines that are likely to intersect at a certain point in the future.
The ascending triangle is a formation that occurs during a mid-trend and signals a likely continuation of the bullish trend. The upper line is flat, while the supporting line is pushing the price action higher until the break to the upside occurs and activates the ascending triangle chart pattern.
Conversely, the descending trendline is a bearish formation that occurs in a mid-trend. It comes from a downtrend, and it signals that the supporting line’s impending break will extend the overall bearish trend. In this case, the lower line is flat, while the upper line is heading lower.
Finally, symmetrical triangles consist of two converging trend lines. They’re not as biased to the upside or the downside as the ascending and descending triangle. However, the price action is most likely heading in the same direction from which the symmetrical triangle was first created.
Wedges
Unlike triangles, wedges are reversal patterns. There are two main types of wedges: ascending or rising wedge, and descending or falling wedge. The wedge pattern consists of two trend lines, which connect essential data points (highs and lows) that are converging on the chart. Many traders consider it a reliable technical tool that indicates a potential reversal.
A rising or ascending wedge takes shape when the pair’s price has an upward movement. Trend lines should connect higher lows and higher highs. On the other hand, the descending wedge occurs in an uptrend within the downside correction. Two trend lines connect the lower highs and lower lows as the volume decreases.
Double bottom and double top
Double bottom and double top patterns are also reversal patterns. The latter is a bearish chart formation that takes place at the top of an uptrend when two equal highs are created, and signals that the market is likely to reverse.
The former has the same function, but it takes place on the opposite side of the chart. Hence, the double bottom is a bullish reversal pattern with two equal lows signaling a likely short-term bottom is in the place.
Candlestick Chart patterns
Japanese candlestick patterns are a family of chart formations that are based on single candles and their interaction. There are two significant groups of candlestick patterns: bullish and bearish. Some of the most popular candlestick chart patterns are the hammer, shooting star, bullish, and bearish engulfing patterns.
How to trade chart patterns and indicators
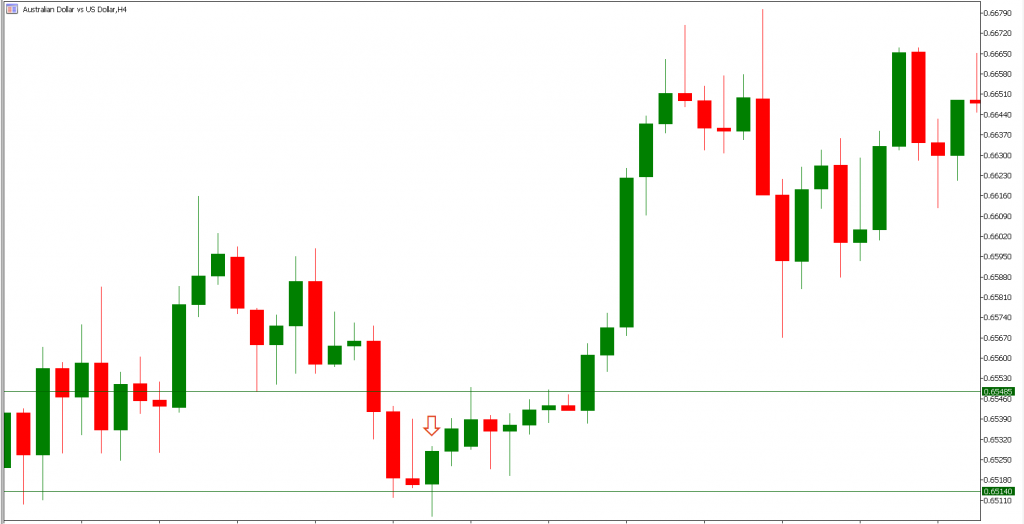
There are tens and tens of different chart patterns and Forex trading strategies based on them. Below, we will demonstrate how to trade a hammer candlestick pattern, a bullish reversal formation at the bottom of a downtrend.
The chart is AUD/USD 4H, and the bears were able to push the market towards a fresh short-term low. However, they failed to force the close at the lows and the buyers took this opportunity to force the market to trade higher.
Trading the hammer candlestick pattern (MetaTrader4)
Following the creation of a hammer candle, we enter the market with a long trade and a stop loss below the most recent low. The upper line is the former support that now becomes a short-term resistance and you can see that the market tags the strength and rotates lower again.
Hence, we capitalized on the trend change after the sellers failed to extend the downtrend lower. The hammer is an incredibly powerful reversal formation that is not so common, but once identified; it usually offers a very attractive trading setup.
Fundamental versus Technical Analysis
As outlined earlier, fundamental analysis focuses on the natural or inherent value of the asset. This is exactly the opposite of the technical analysis, whose believers consider that all fundamental external factors have been taken into account in the current market price of an asset or instrument.
As always, each side has an advantage and a limitation. The most significant advantage of fundamental analysis is its comprehensiveness. It looks at so many different elements and financial indicators that, representing a potent tool for projecting future market trends. On the other hand, it tends to push the technical aspect of the game to the side, which is likely to backfire, given the importance of price movements.
On the other hand, technical analysis focuses on the chart elements and, kind of, refuses to take into account fundamental factors. Technical analysts will solely focus on the market movements and look to identify trends and chart patterns that are likely to repeat. However, the market movements are sometimes ahead of the fundamental game, making technicals a critical aspect of the entire trading process.
You can combine them
Thus, can we do these two work? A simple strategy to use both fundamental and technical aspects is to look at these two concepts as complementary, rather than confrontational. By applying both the fundamental and technical analysis, you will provide yourself with many useful answers.
Fundamental analysis should answer a simple question: Which trading pair should I invest in?
This way, you perform a financial analysis of different currencies to identify those in the positive momentum and likely benefit most.
For instance, you may see that the USD is likely to outperform the rest of the market in the short-term. The second part of the first phase is to look against which currency USD should benefit the most. This is a task for fundamental analysis.
Finally, you have identified a Forex pair that looks attractive to trade from the fundamental perspective. This is where technical analysis comes in. Its job is to answer a question: At which level should I buy/sell this pair?
Therefore, you should perform the technical analysis and look at different chart patterns and technical indicators to identify attractive levels. Ultimately, you will generate an entry, stop loss, and take profit levels for your trade.
This way, you use the strengths of fundamental and technical analysis and limit their weaknesses. Once you get familiar with both, you will be able to implement this strategy every day for the rest of your trading career.



Leave a Reply