Traders and analysts forecast future price movements in Forex using different chart patterns. These formations can range from the most basic ones that consist of a few trend lines only, such as triangles, wedges, flags, pennants, double top/bottom, to more advanced setups like Harmonic Patterns.
Forex Harmonic Patterns are geometric price formations that derive from Fibonacci retracement or extension lines. Most likely established by H.M Gartley in 1932, Harmonic Patterns depict potential price changes or trend reversal levels. The four main Harmonic Patterns that can have bullish or bearish versions receive the following names:
- The Crab
- The Butterfly
- The Bat
- The Gartley
- The Cypher
If you want to learn how to identify Forex Harmonic Patterns in a chart and use them to your advantage, keep reading. In this blog post, we review each structure in detail. Moreover, we will teach you how to create a trading setup based on harmonic chart patterns, which can be quite profitable.
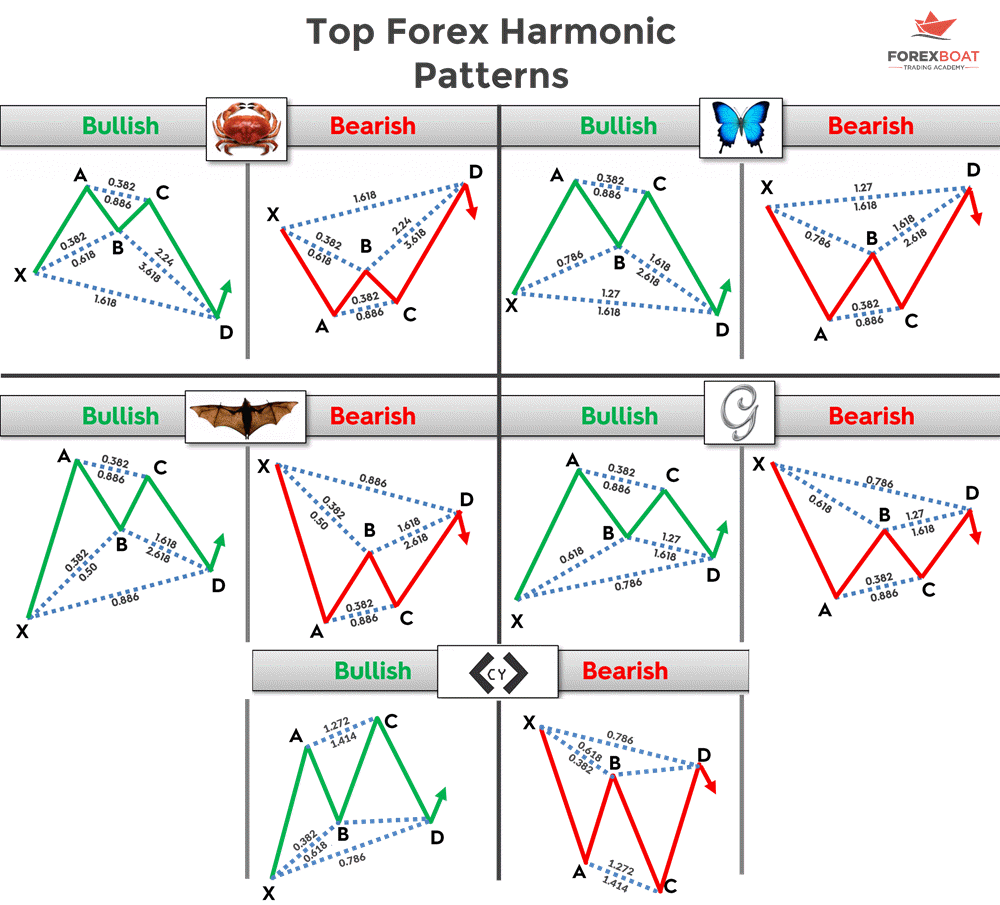
Table of Contents
Forex Harmonic Patterns Fundamentals
Unlike other Forex chart patterns, Harmonics are challenging to spot and draw, as we are talking about geometric figures. Secondly, they consist of a list of conditions required before the pattern can be considered as active and tradeable.
Also, harmonic chart patterns are quite rigid in their design. Unlike some other chart formations that leave some space to traders for interpretation, harmonic patterns offer clear and precise instructions on how to be identified, verified, and ultimately traded.
The main reason for this is their association with Fibonacci numbers.
Harmonic Patterns and Fibonacci Numbers
As outlined in the introduction, harmonic patterns are based on Fibonacci numbers, where after numbers 0 and 1, each number is the sum of the two previous numbers.
Therefore, the Fibonacci sequence looks as follows: 0, 1, 1, 2, 3, 5, 8, 13, 21, 34, 55, 89 and so on.
In short:
- A number in the sequence is approximately equivalent to 61.8% of the next amount.
- 38.2% of the following number,
- and roughly 23.6% of the amount after.
As a result, we get the famous Fibonacci retracement lines – 23.6%, 38.2%, 50%, 61.8%, 78.6% and 88.6% – that we use on a daily basis for trading purposes. You may be familiar with the three key Fibonacci extension levels used in trading: 127.2%, 161.8% and 261.8%.
It is not precisely clear who designed the harmonic patterns, with the likeliest candidate being H.M. Gartley, who discussed this type of pattern in his book “Profits in the Stock Market”, published in 1932. One of the fundamental harmonic patterns is named after him.
Scott Carney is another name frequently mentioned in this context. In his book “The Harmonic Trader (1999)”, Carney thoroughly discusses the idea of harmonic trading patterns that are based on Fibonacci ratios.
Types of Forex Harmonic Patterns
It is believed that the list of all harmonic patterns is much longer, but in general, five widely-accepted harmonic chart patterns are most popular among the trading community. The section below will discuss the Gartley pattern, Bat Pattern, Butterfly Pattern, Cypher pattern, and the Crab pattern.
The Gartley Pattern
Gartley is arguably the most common forex harmonic chart pattern. Named after H.M. Gartley, who said that this pattern offers “one of the best trading opportunities”, the Gartley formation is based on the idea that Fibonacci sequences have a structure that can be used to identify levels of potential interest on both sides.
As with every harmonic chart pattern, there are bullish and bearish versions of Gartley. Both have the same goal – help the overall trend to extend in the same direction. Hence, Gartley is predominantly a continuation chart pattern that facilitates trend extension.
Gartley uses a combination of Fibonacci retracements to come up with a final level that generates a buy signal. The basic idea behind this chart pattern, as well as with other harmonic formations, is that the price action follows a specific pattern.
In essence, Gartley supporters believe that the price is likely to bounce from one Fibonacci-identified level to the other until the final buy/sell signal is generated. This way, a geometric shape is formed, as illustrated in the photo below.
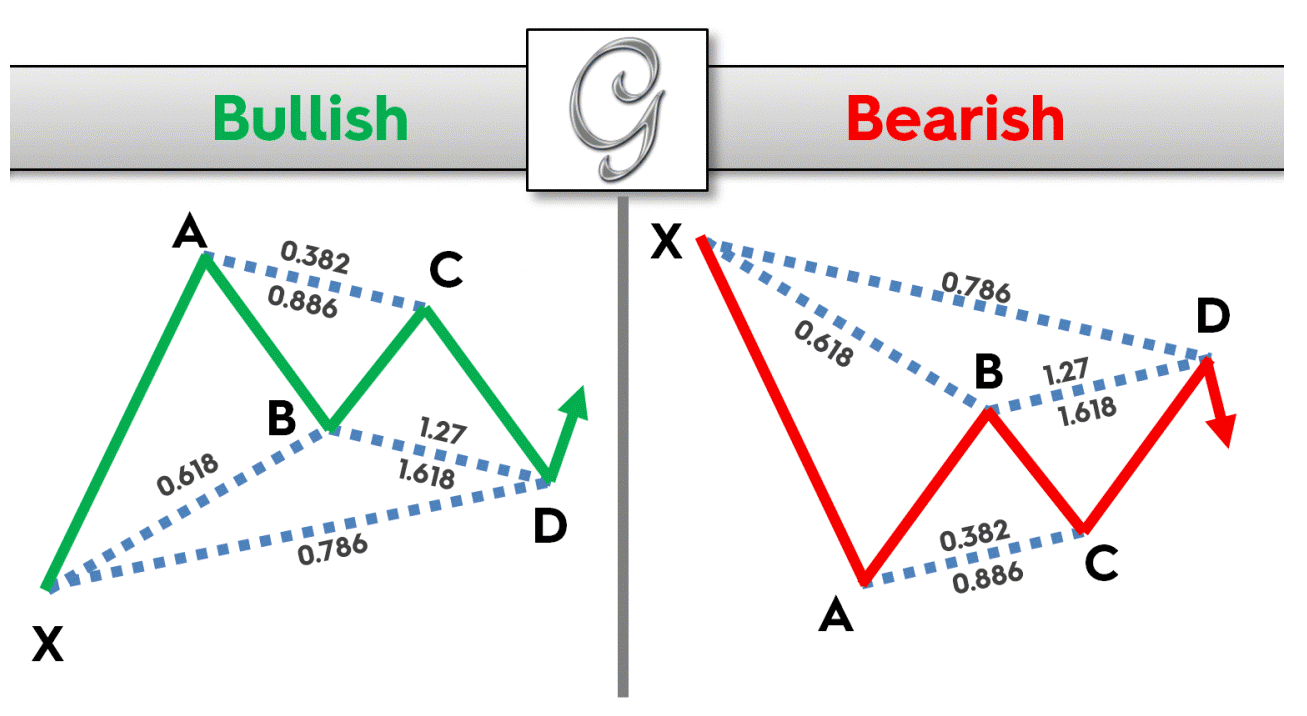 Bullish and Bearish Gartley patterns
As seen in the illustration above, the Gartley consists of five different points. They are marked by numbers (0, 1, 2, 3, 4), or more frequently by letters (X, A, B, C, D). For Gartley to be verified as such, the following requirements must be fulfilled in the first place:
- XA – This is where the pattern starts and it can be any price activity on the chart. The only condition is that it is not a choppy, sideways trading action, as the idea behind harmonics is to continue existing trends. Hence, the XA move initiates an uptrend or a downtrend.
- AB – This is the first step that has clear and concise requirements. In theory, point B (2) should end around the 61.8% Fibonacci retracement. Of course, it is highly unrealistic to expect that the price action ends at 61.8% exactly; hence it is allowed to offer variations to a certain degree.
- BC – The BC move (2-3) should follow the direction of the overall trend. The point C is expected to end at the 38.2% Fibonacci level, near to the 88.6% Fibonacci level of the AB move.
- CD – The price action then takes another turn and reverses the BC leg to a certain point. If the BC leg ended at 38.2% of AB, then CD should finish at the 127.2% extension of BC. Or, if BC leg ended at 88.6% of AB, then CD should be the 161.8% extension of BC.
- XD – Once the CD leg is over, the final step assumes measuring the XD retracement, which should end at 78.6%.
Ultimately, the point D signals a potential buy/sell trade. The blue trend line in the illustration above signals the expected bullish move higher, once the price action reaches the region around point D.
The bearish Gartley follows the same guidelines, with the XA move being to the downside and the point D generating a sell signal.
The Bat Pattern
A bat pattern looks very similar to Gartley, but it has different measurements. It is also considered to be a continuation pattern as the overall trend extends and the last point (D) ends within the initial XA move. The entire structure looks more symmetric compared to the Gartley formation.
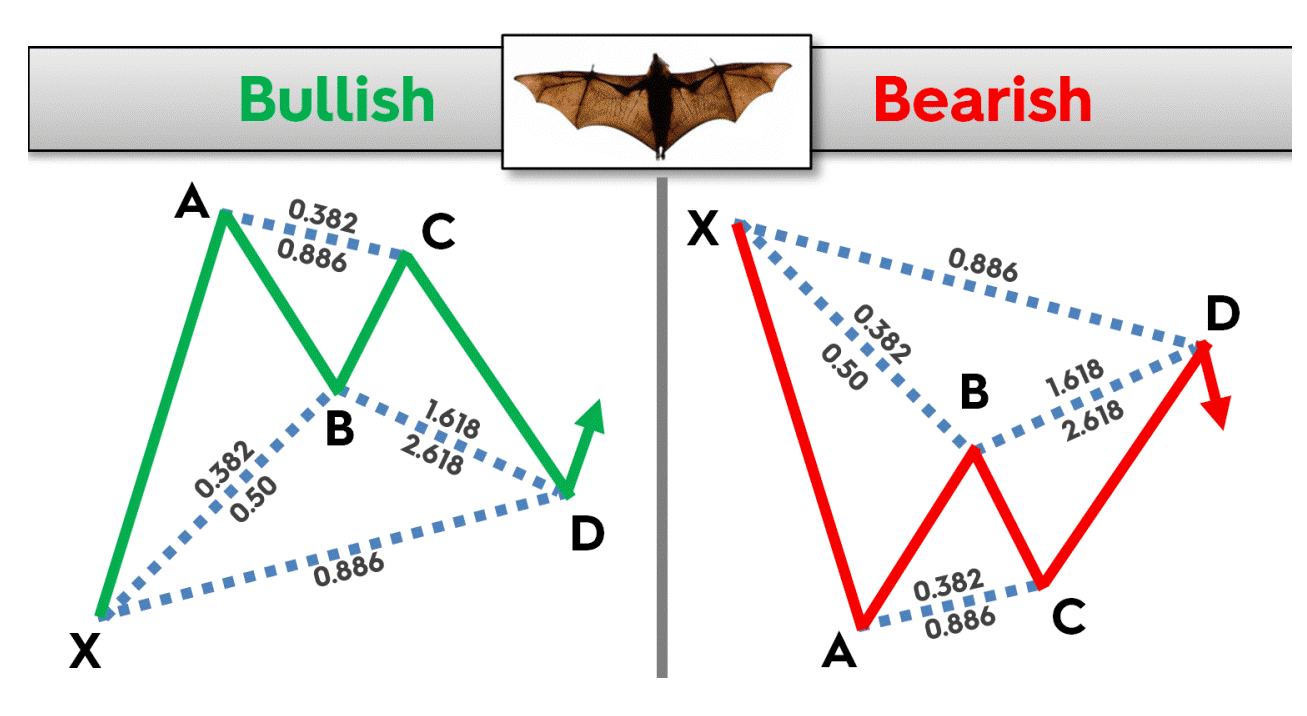 Bullish and bearish Bat patterns
These are the guidelines to recognize a Bat pattern:
- XA – Any bullish or bearish move that starts the trend classifies as the XA leg.
- AB – The first retracement of the initial XA move is shorter in the Bat pattern, compared to Gartley. The AB leg should end between 38.2% and 50%, signaling a strong initial trend.
- BC – The point XC should be 38.2% or 88.6% of the AB move. Hence it is reversing the trend direction of the AB leg.
- CD – This leg should either be the 161.8% extension of the BC leg if we had a 38.2% retracement in the previous move, or a 261.8% extension of BC if the prior leg retraced 88.6%.
- XD – In addition to CD, point D should be the 88.6% retracement of the initial XA leg.
The Butterfly Pattern
Unlike the first two harmonic patterns, point D in the Butterfly chart pattern ends outside of the initial XA move. Although the overall trend is ultimately extended higher, it is difficult to classify the Butterfly pattern as a continuation setup since point D travels below or above the X point.
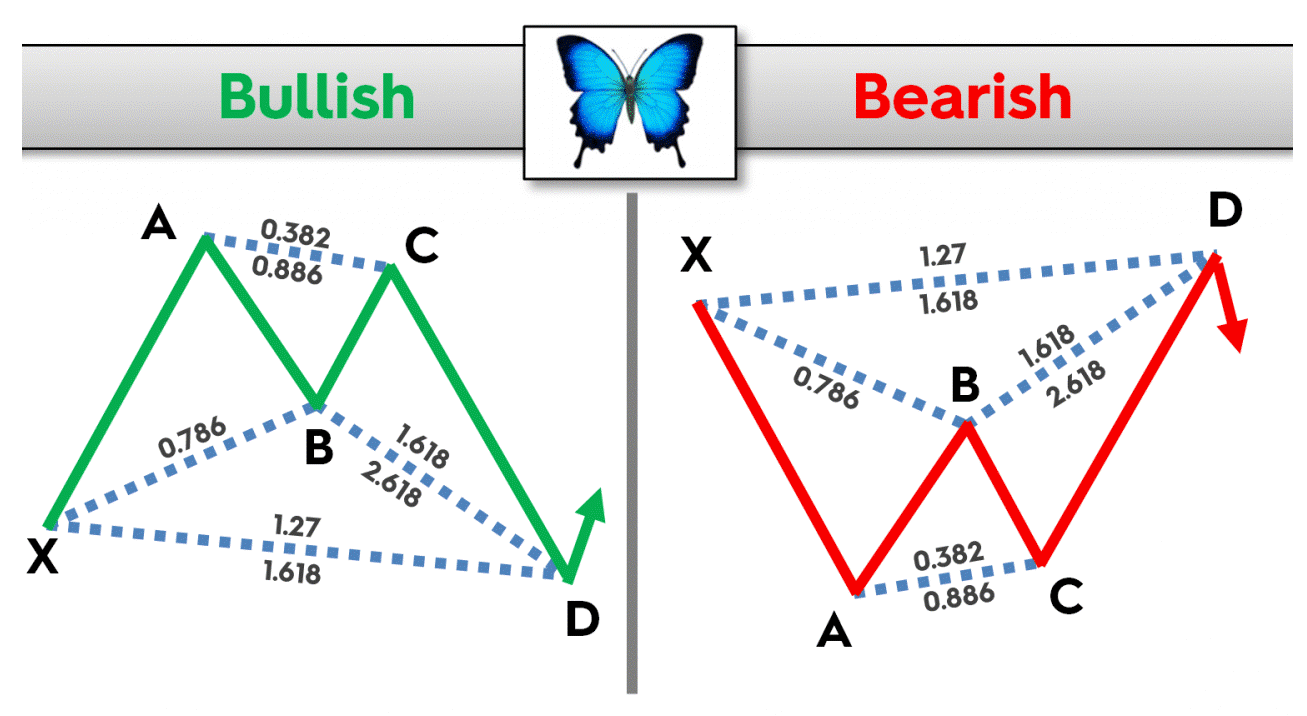 Bearish and bullish Butterfly patterns
The following guidelines are in place for the Butterfly patterns:
- XA – Any bullish or bearish move that starts the trend classifies as the XA leg.
- AB – The first retracement of the initial XA move is longer than in Gartley and Bat, as the price action pulls back all the way to 78.6% Fibonacci retracement.
- BC – The point BC remains the same – 38.2% or 88.6% Fibonacci retracement of the AB move.
- CD – The leg also remains the same as in the Bat pattern. If the BC retracement is 38.2%, then the CD leg should end at the 161.8% extension. If the BC leg has its end at 88.6% of the AB leg, then the point D comes at 261.8%, although specific versions of the Butterfly chart pattern are based on the 224.2% extension.
- XD – The point D should also correspond to the 127% or 161.80% Fibonacci extension of the initial XA leg.
The Cypher Pattern
The Cypher pattern is similar to Gartley, except that the BC correction should go beyond point A. Therefore, the BC is an extension of the AB move, rather than a retracement.
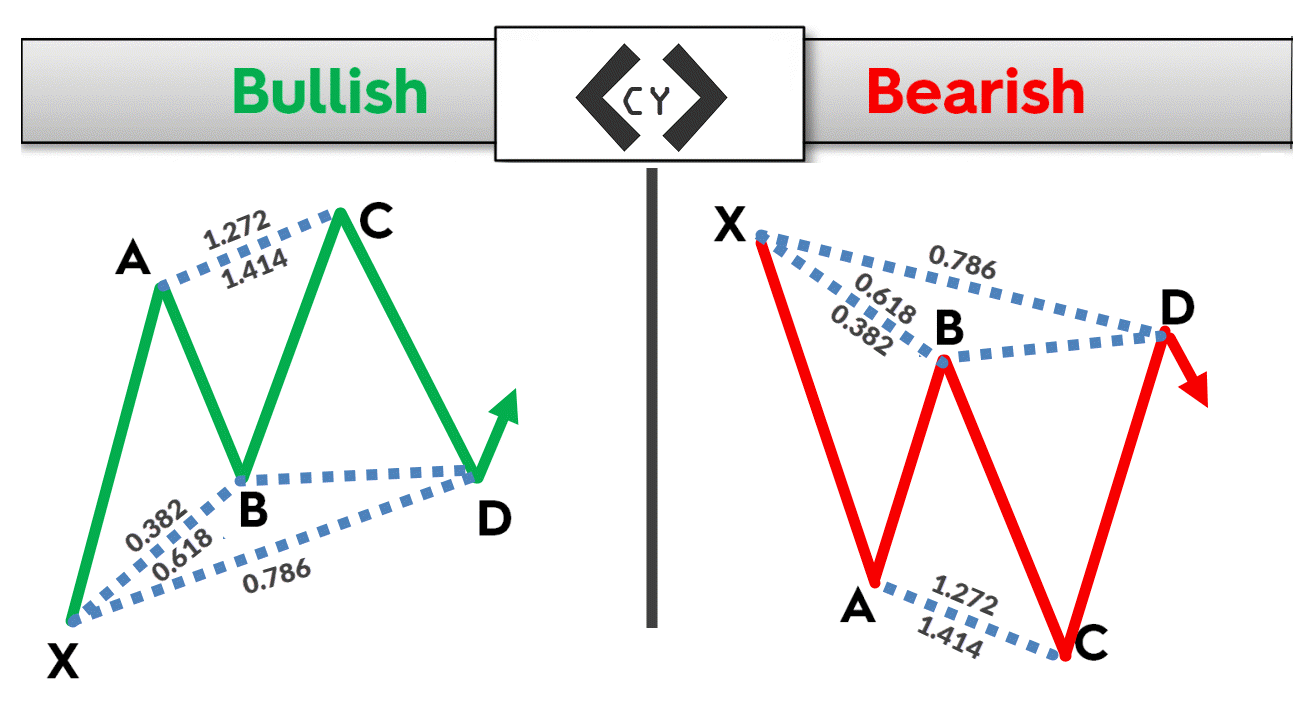 Bullish and Bearish Cypher patterns
These are the guidelines to spot a Cypher pattern:
- XA – Any bullish or bearish move that starts the trend classifies as the XA leg. As with the other harmonic patterns, there are no specific requirements for the XA leg.
- AB – The point AB is expected to be either 38.2% or 61.8% of the XA leg.
- BC – As said, point C extends above/below point A. Hence, we are drawing a Fibonacci extension, looking for a level anywhere between 113.0% and 141.4% of the AB move.
- CD – In the Cypher pattern, the CD and XD merge into a single point. Hence, the D point should be at around 78.6% of the initial XA move.
The Crab Pattern
Extremely long extensions characterize the Crab pattern. If you look at the illustrations below, you will see that the price action is consolidating between the X and C points, before point D extends above/below the initial X mark.
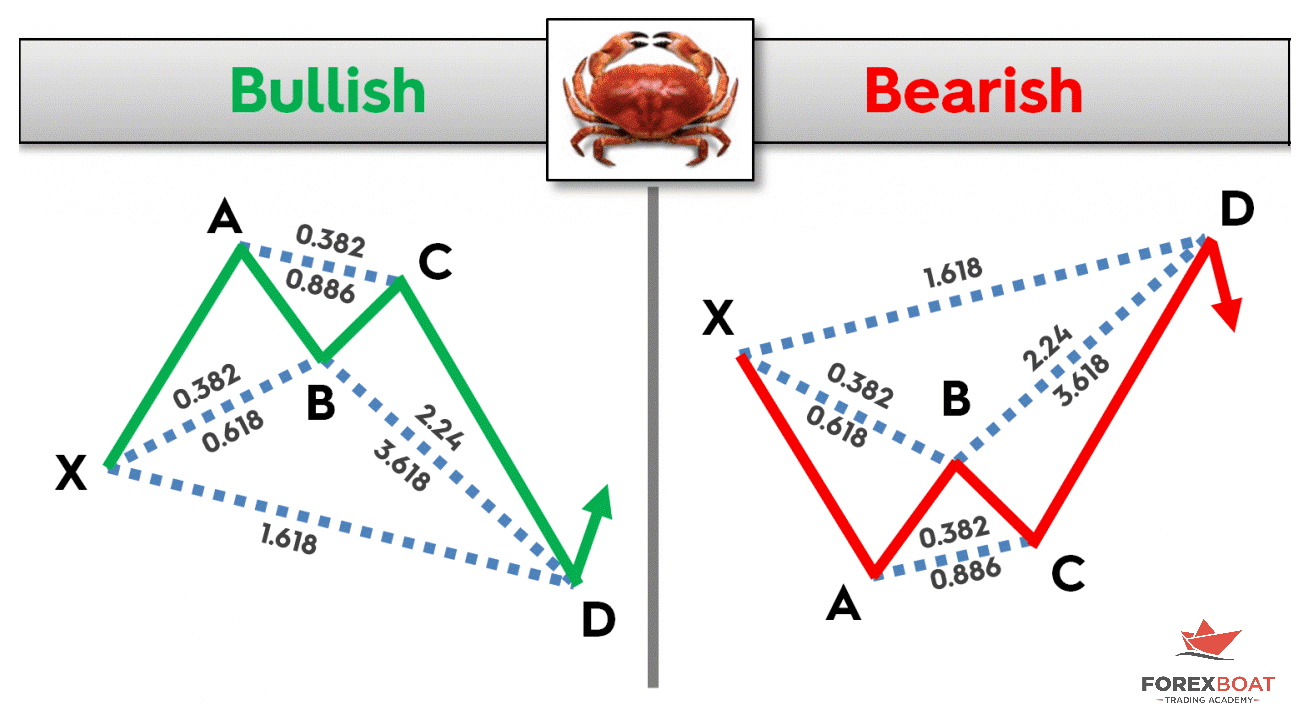 Bearish and Bullish Crab patterns
The following guidelines are in place for the Crab pattern:
- XA – Again, any bullish or bearish move that starts the trend classifies as the XA leg.
- AB – This leg is entirely the same as in the Cypher pattern and the XA retracement should end either at 38.2% or 61.8%.
- BC – The consolidation phase extends with the BC leg as the price action reverses the AB move by correcting either 38.2% or 0.886% of the prior leg.
- CD – The CD leg is similar to XA – although it occurs in the opposite direction, it is a long wave that follows the period of consolidation. If the BC leg is 38.2%, then CD is expected to end near the 224% extension mark, while if BC is 88.6% of the AB leg, then CD should be 361.80% of BC.
- XD – Finally, the D point should come at around 161.8% Fibonacci extension of the initial XA leg.
How to Trade Harmonic Patterns
When trading harmonic patterns, it is crucial to understand the importance of flexibility. In other words, the currency market has liquidity measures in trillions of dollars, so it doesn’t move based on the harmonic patterns. We use these chart formations to understand the stage in which the market is currently in and to format our investments and trades.
Therefore, we must be flexible with following the precise requirements on one side, but also not go too far with flexibility and endanger the legitimacy of the pattern. You should establish a balance between the rigid structure of harmonic patterns and the importance of following the guidelines in the first place.
For instance, the Bat pattern tells us that the AB must come at 38.2% or 50% of the XA leg. It would be complicated, almost impossible, to identify a chart pattern with the exact price points hit to a pip.
Therefore, we advise you to allow some space for the market to trade around these levels. For instance, come near 38.2% or go slightly above 50%. Some analysts also suggest that any retracement between 38.2% and 50% is acceptable.
In two examples below, we share tips on trading the Gartley patterns, which is the frequent and the most popular harmonic pattern. In the first example, we have a EUR/JPY 4-hour chart where the buyers force the price action higher in an aggressive fashion.
Bullish Gartley on EUR/JPY H4 chart
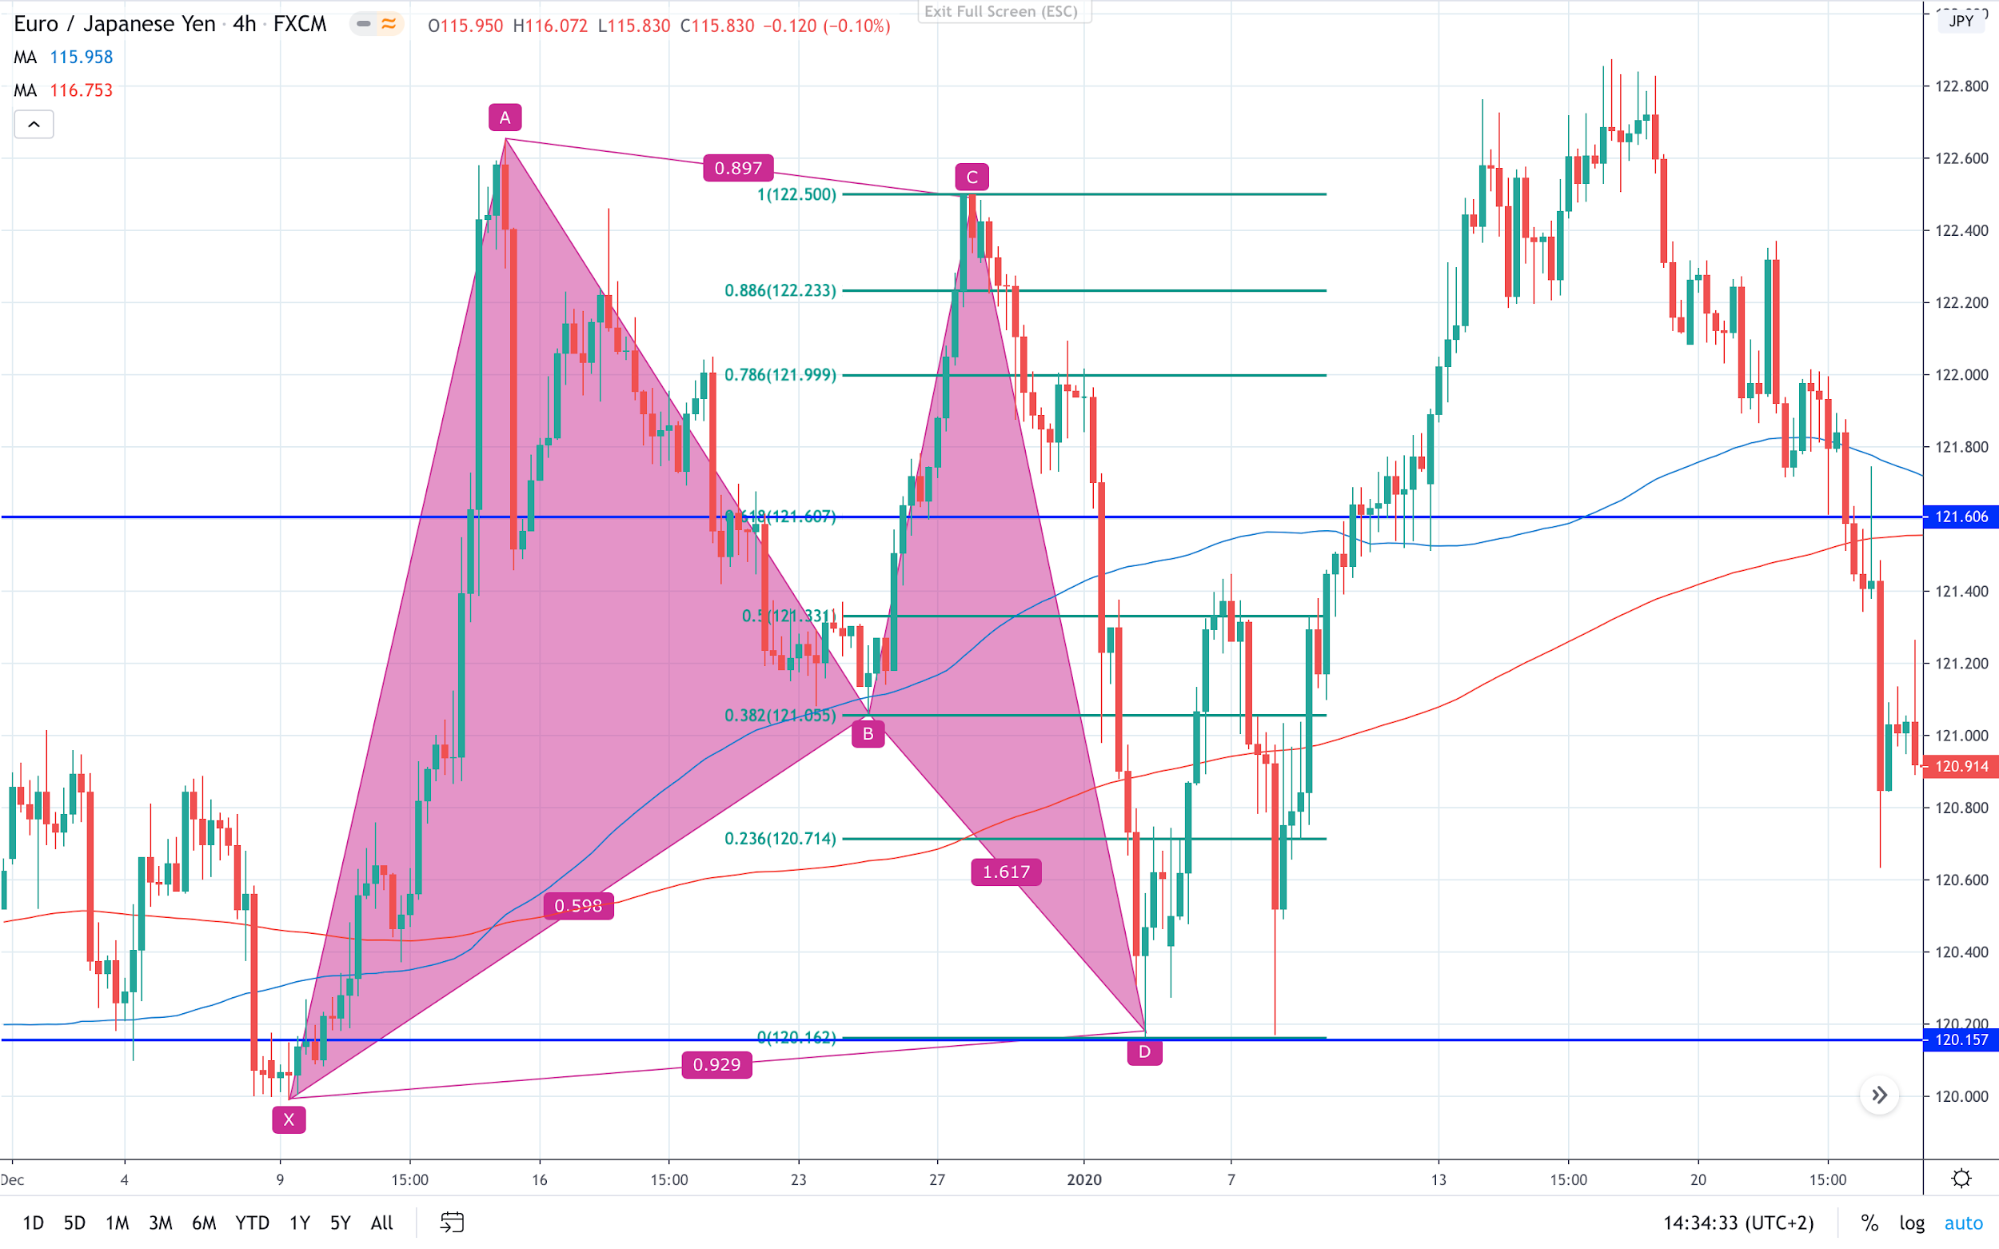
Following the pullback from point A, the price action retraces to the 61.8% Fibonacci retracement line. The BC leg also ends near the desired 88.6% Fibonacci. Finally, the sellers can force a mini-crash in the price action, pushing the price action 250 pips lower. Ultimately, point D comes at a 161.8% Fibonacci extension.
We said that XD should be 78.6%, but in this case, it is just above 90%. However, the pattern that we drew has the shape of a bullish Gartley. Hence, point D could be a buy signal.
How do we trade a bullish Gartley?
The entry point is at point D, or around the 161.8% Fibonacci extension. Some traders prefer to enter the market just before the price extends to 161.8% to make sure they get into the market. The stop-loss is located below point X, a move that would invalidate the basic idea behind the Gartley pattern – the continuation. Meaning, we can’t have an extension of the movement if the price prints a low below the initial X point.
In this case, the entry point is around 120.15, while a stop loss could be at 119.85, as we leave about 15 pips below point X to be on the safe side.
There are different ways to calculate the take profit levels in harmonic patterns. First, you can set two separate orders, ranging from more conservative to more optimistic, to target a move to point B and a zone around the A and C points. This way, you would be partially closing your trade at 121.00 and the area 121.50 – 121.65.
The other popular method advises us to draw the Fibonacci retracement lines between the C and D. This way, we should take a portion of the profits once the price action retraces to at least 61.8% or 121.60. The other part would eventually run A-C. Hence, we risked 30 pips in our trade to make 50-60 pips with one part of our trade, while the other part(s) would go to 121.00 or 121.50.
A similar situation occurs with the NZD/CHF daily chart. In this case, we have a bearish Gartley. The initial XA leg sets up the base for other legs to play out. You can see that the AB leg extends above the targeted 38.2%; however, the rest of the pattern looks very clean.
Bearish Gartley on NZD/CHF daily chart
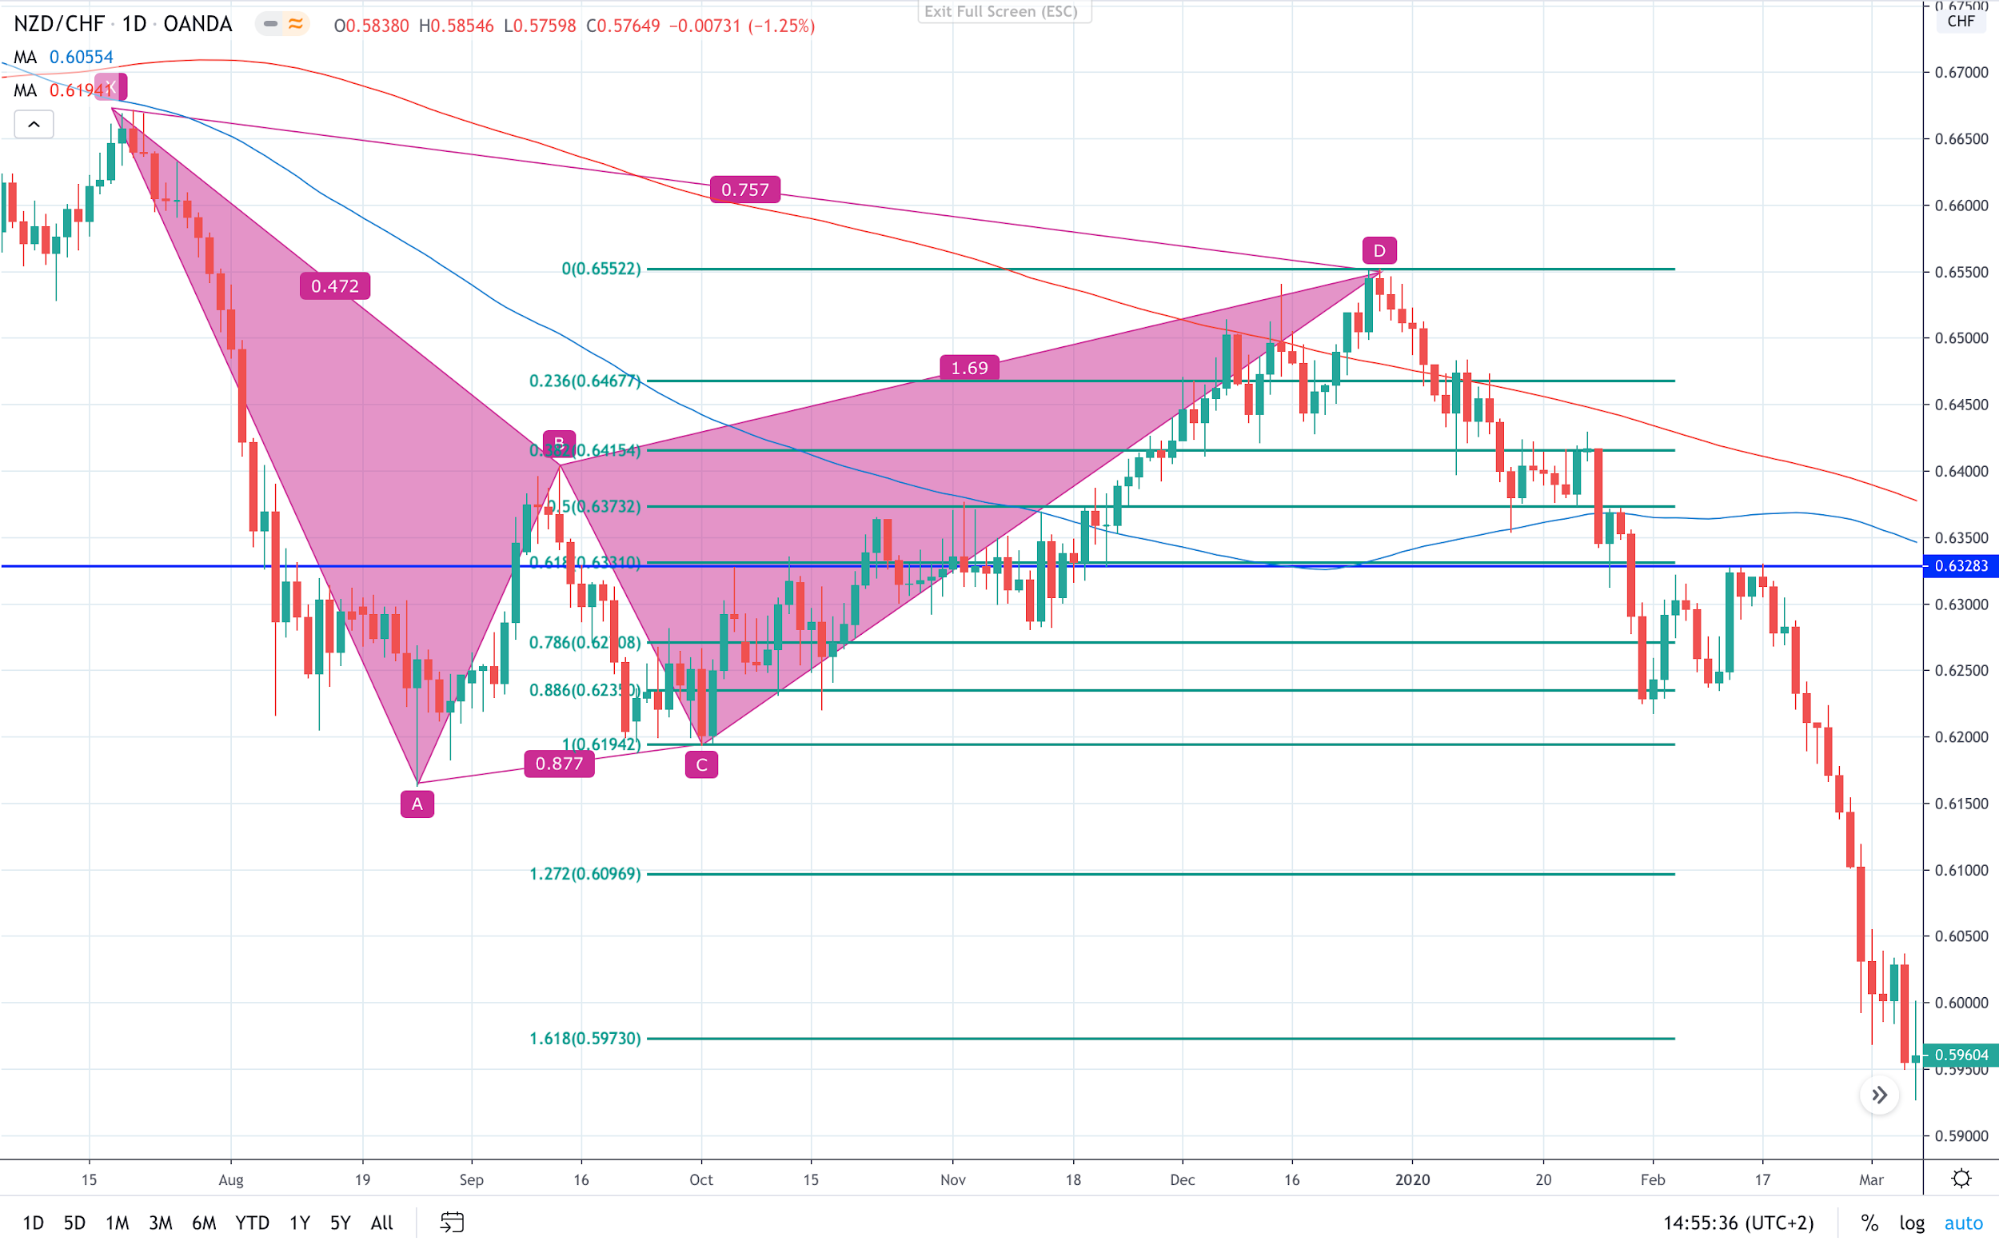
Once the price extends 161.8% above point B, we enter a sell trade at 0.6550 to play the market on the short side. You can see that the mark D ultimately went to 169%, which reiterates our point from earlier that it is essential to leave some space to market for maneuvering.
We place the stop loss again above point X, which is in this case around 130 pips above the mark D. If we combine the two approaches still, it would mean that the first take profit target would have been hit at 0.6330, while the other part(s) would be free to try and reach the A-C zone around 0.6200. Ultimately, we risked 130 pips to make 220 with one part of our trade, and around 350 with the other.
Advantages and Limitations
Harmonic chart patterns are precisely defined formations. As such, they provide us with crucial steps that we have to undertake to identify and ultimately trade these patterns correctly. Hence, the most significant advantage of harmonic chart patterns lies in their structure, which provides us with precisely defined levels to seek.
Based on the inputs of each harmonic chart pattern, we quickly identify the risk associated and profit expected. The Fibonacci ratios help us to identify the entry, stop loss, and take profit. As a result, all harmonic patterns usually generate a very attractive trading setup from the risk perspective.
On the other hand, this preciseness and rigidness are what make them scarce. Even if we believe that we spotted a harmonic pattern, Fibonacci levels will not align in the pattern. Hence, a lot of patience is required to detect, draw, and trade harmonics.
Recap and Next Steps
Harmonic patterns are chart patterns that are based on Fibonacci numbers. This set of chart patterns is believed to be first introduced by H.M. Gartley, who discusses harmonics in his book “Profits in the Stock Market”, published in 1932.
The most popular harmonic is the Gartley pattern. At the same time, we also discussed the structures of other popular harmonic patterns, such as the Bat Pattern, Butterfly Pattern, Cypher pattern, and the Crab pattern.
We shared two examples to show how profitable harmonic patterns can be. Thanks to the Fibonacci-based structure of the harmonic patterns, we are equipped with an entry, and levels to place our stop loss and take profit orders.
Ultimately, the risk-reward ratio through the harmonic patterns is what made these trading setups very attractive.
Post in the comments your experience so far with harmonic patterns and if you have spotted one lately.


Leave a Reply