Forex indicators are a big part of technical analysis and they offer some wonderful uses for traders. These include being able to quickly and easily spot trends, to give trade ideas, to create trading signals to give entry and exit points, and they even confirm those signals, further taking the guesswork out of trading.
Some of the best Forex indicators include:
- The Moving Average
- The MACD
- The RSI
and we will look at how they and other popular indicators work in this article.
Table of Contents
The main groups of Forex technical indicators are Trend following and Oscillators. Trend following indicators can detect the direction of the trend eg. Bullish (Uptrend) or Bearish (Downtrend) or Ranging (across), while Oscillators usually detect the volatility of a market. It is often useful to use two or more indicators together as you progress, so you can have a clearer picture, but to start with let’s practice the basics.
Trend Following Indicators
Trend following indicators will help you discover which way the market is moving and if you project it forward, it can help you to discern the future movement of an asset. The main trend line indicator in use undoubtedly is the Moving Average.
There are 4 main types of this indicator, Simple, Exponential, Linear Weighted and Smooth. These Moving Average lines all work on the same principle but each has a different weight assigned to them. The difference is purely technical. So for now let’s cut out the noise and focus on the key one which is Simple. As its name suggests it is easy to use and it actually smooths the price chart by drawing a line to follow the trend.
The most popular timeframes used for this indicator are 200,100, 50 and 20. The 200 MA is to identify a trend in a longer timeframe, while the 20 MA is to identify a shorter time frame.
How to Understand the MA?
Quite simply, if the asset’s price is above the Moving Average line, then the asset might be Bullish. Conversely, if the asset’s price is below the Moving Average line then the asset might be Bearish.
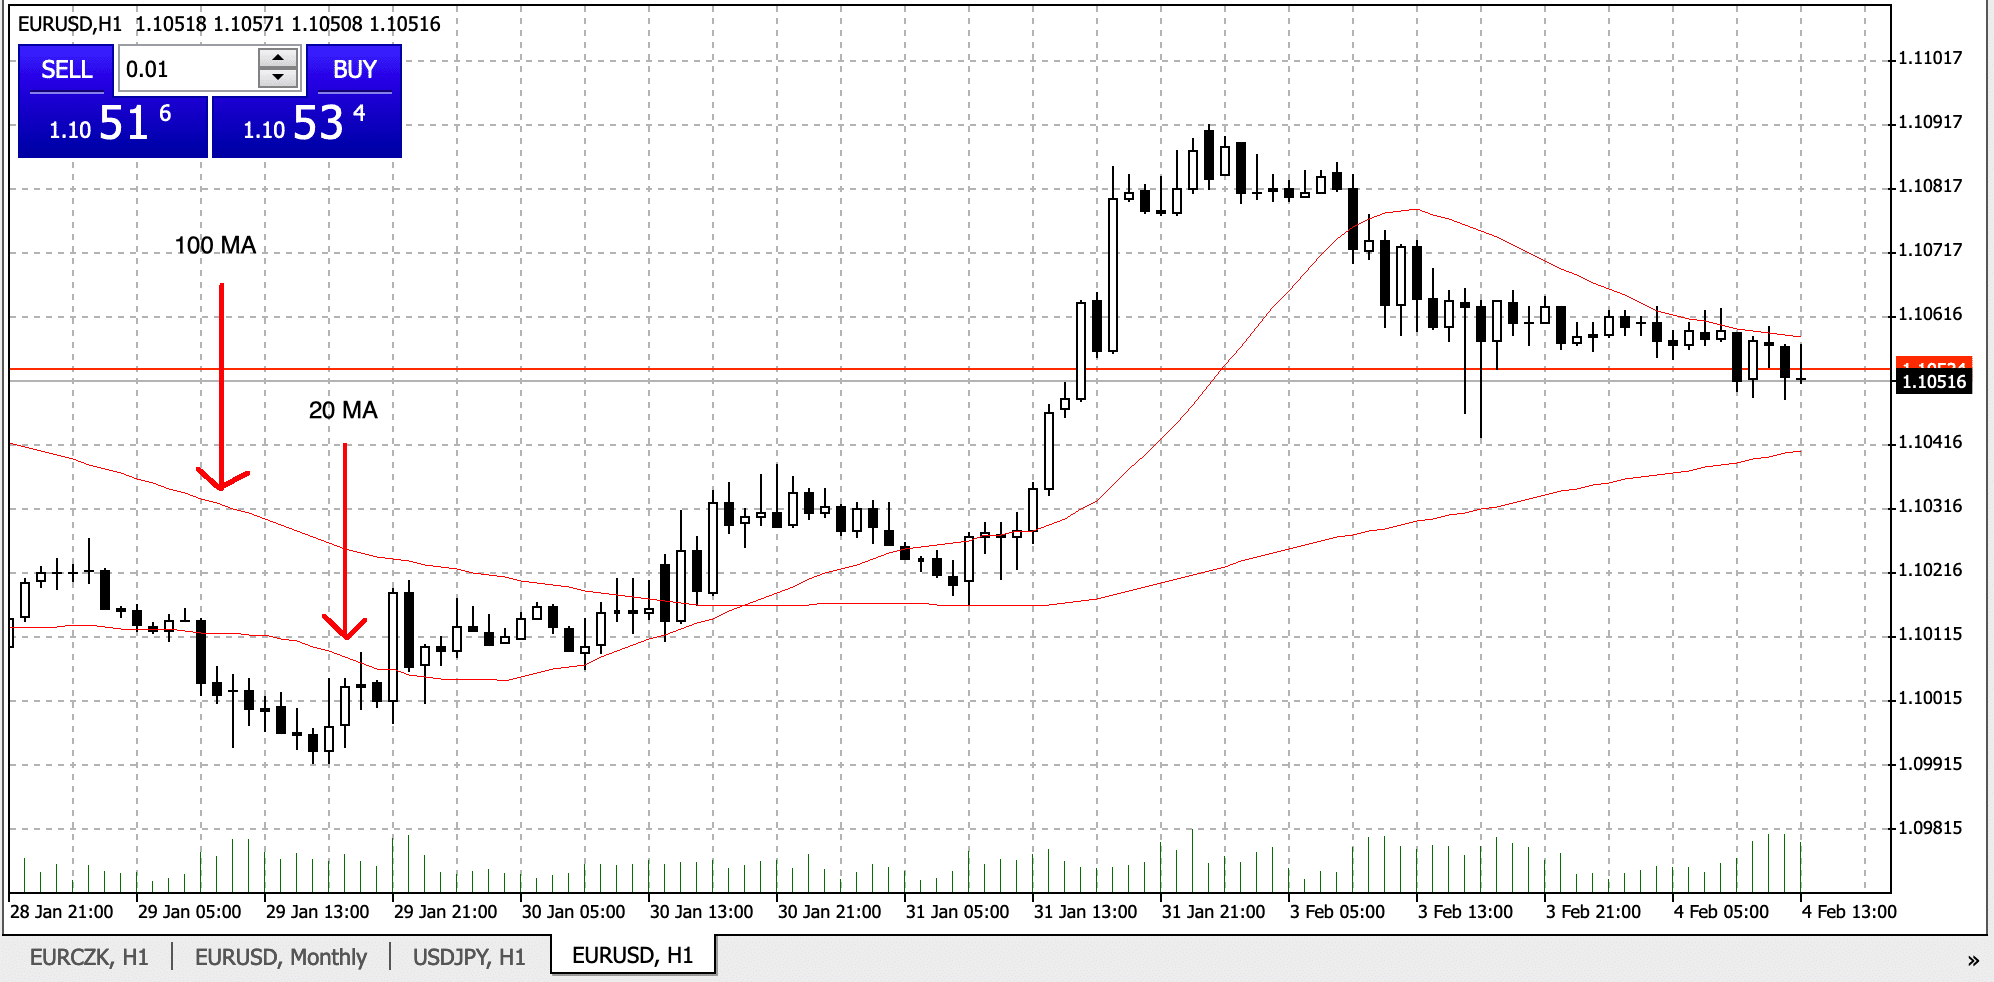
The image below shows a 20 MA. When the candlesticks are above the MA this suggests a Bullish or uptrend and when the candlesticks are below the MA line, this suggests a Bearish or downtrend.

You can also add 2 MA lines on to one chart when one is short term (20) and one is long term (100). When the short term goes above the long term this proves to be an upward bias and vice versa when the shorter time MA goes below the longer term.
Advantages of the Simple MA
- This indicator allows you to discover which way a trend is moving
- It allows you to detect when a trend is reversing itself
- It can show you potential support and resistance levels
Disadvantages of the Simple MA
- This indicator does not give an immediate picture of the market as it lags behind the current price
It’s a good time to understand support and resistance levels because these will come up a lot for you. They can be overlayed or drawn onto your chart to help you predict when trends will stop and reverse themselves.
Support and Resistance are lines that go below and above the asset price are invisible barriers which tend to stop the asset price continuing in its trajectory. It’s a level which the market finds it hard to breach or breakthrough, as demonstrated by past history.
You can use Moving Averages to understand which way the market is moving and therefore whether you should buy (when the trend line is moving up) or sell (when the trend line is moving down). What they can’t do though is tell you when to exit or enter a trade. For that you need a different kind of indicator. Which brings us to the next point.
Top Oscillators to Confirm Trading Opportunities
Oscillators are another kind of forex indicator. When viewing them on a chart, you will usually see the oscillator indicators, like the MACD in a separate band underneath the chart.
The purpose of an oscillator is to detect an overbought or oversold area of the chart.
An oscillator can measure the strength or weakness of an asset, so for instance if a currency pair like the USD/CNY is moving upwards on some strong data from the US, eventually the asset will start to run out of steam, suggesting that it has been overbought. It’s then time for the sellers to move in and sell the pair before the trend tries to move in reverse.
On the other hand when an asset has been consistently sold for a period of time over a month or more, then the asset will be in an oversold position and it may well be time for the buyers to move in.
Oscillators help the analyst to detect a trend that is not yet obviously established, for instance in a very choppy market where a trend cannot form, or when an asset is moving sideways.
Some examples of oscillators include the RSI, the MACD, and the Stochastic Indicator.
Let’s start by looking at the RSI.
Relative Strength Index – RSI
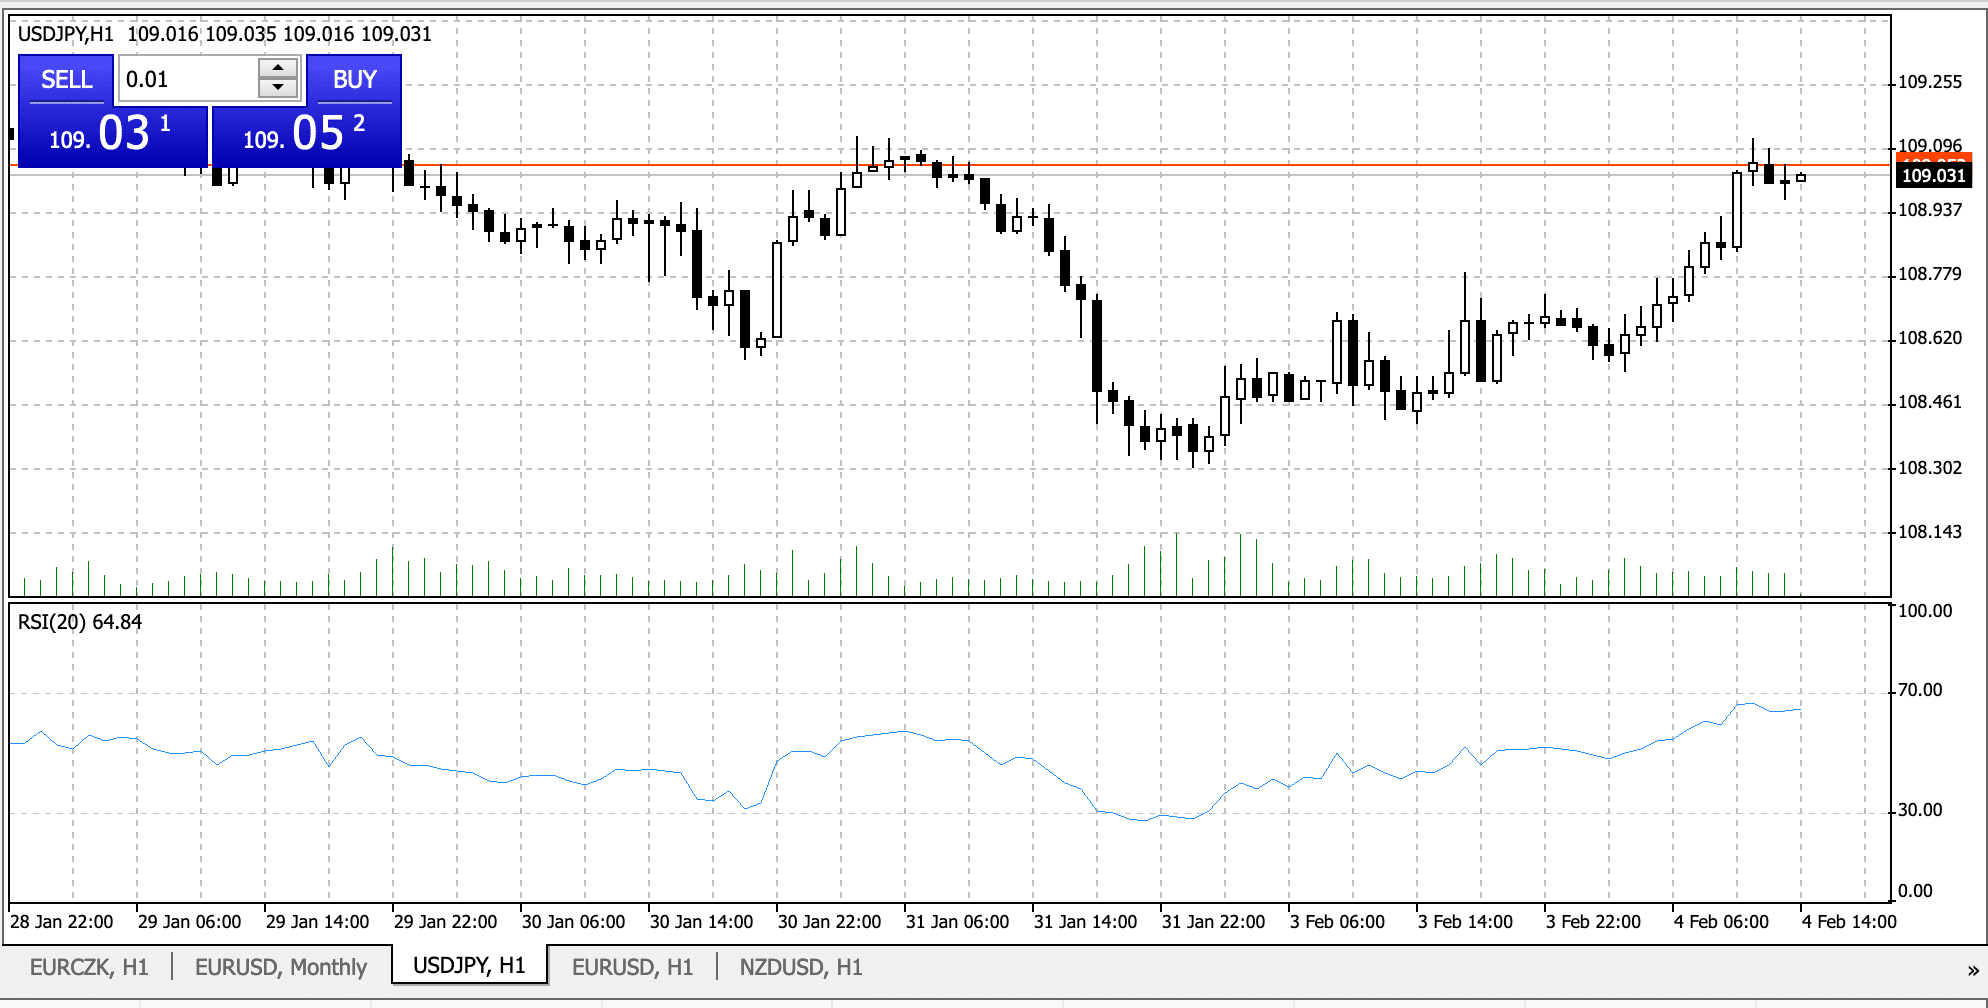
The RSI is quite simple to understand and is one of the most popular indicators out there. In the chart above showing the USD/JPY, you can see the RSI in the lower section.
It typically becomes oversold at 30 and is overbought at 70. The further from 70 the indicator is, the stronger the overbought scenario and vice versa for 30.
When the RSI stretched into overbought it is a suggestion that maybe the strength is losing some steam and is due a bounce back. It gives us a way of taking the temperature of the market.
By looking at different timelines you will get different signals, of course. So the trick is BUY when the market is going to oversold and SELL when it is going to overbought territory.
There is another way to use it and that is through divergence. These may be more reliable signals but are harder to spot. This is where the market pushes up to fresh highs or lows and drags the RSI with it.
Advantages of the RSI
- You can understand what the market is doing well before other traders not using this indicator
- You can use this indicator in coordination with other indicators to establish strong entry and exit points.
- If you use the RSI for divergence signals you can get even more reliable signals.
Disadvantages of the RSI
- RSI is an oscillator and therefore works best in markets that are oscillating, when markets are calmer this indicator doesn’t work so well.
The MACD
The MACD (Moving Average Convergence Divergence indicator) is a trend-following momentum indicator that gives buying and selling signals from Moving Averages.
In the settings, you will see 3 different numbers representing time periods, which are typically set at 12, 26, 9. These numbers come as default settings on most charting packages.
Whenever the 12-period EMA (blue) is above the 26-period EMA (red) line it will have a positive value and when the 12-period EMA is below the 26-period EMA it will have a negative value.
Take a look at our chart below. You can see two lines on the chart. The blue line is the faster moving average (12) and the red line is the slower moving average (26). The histogram line in the window below the chart is the difference between the two moving averages.
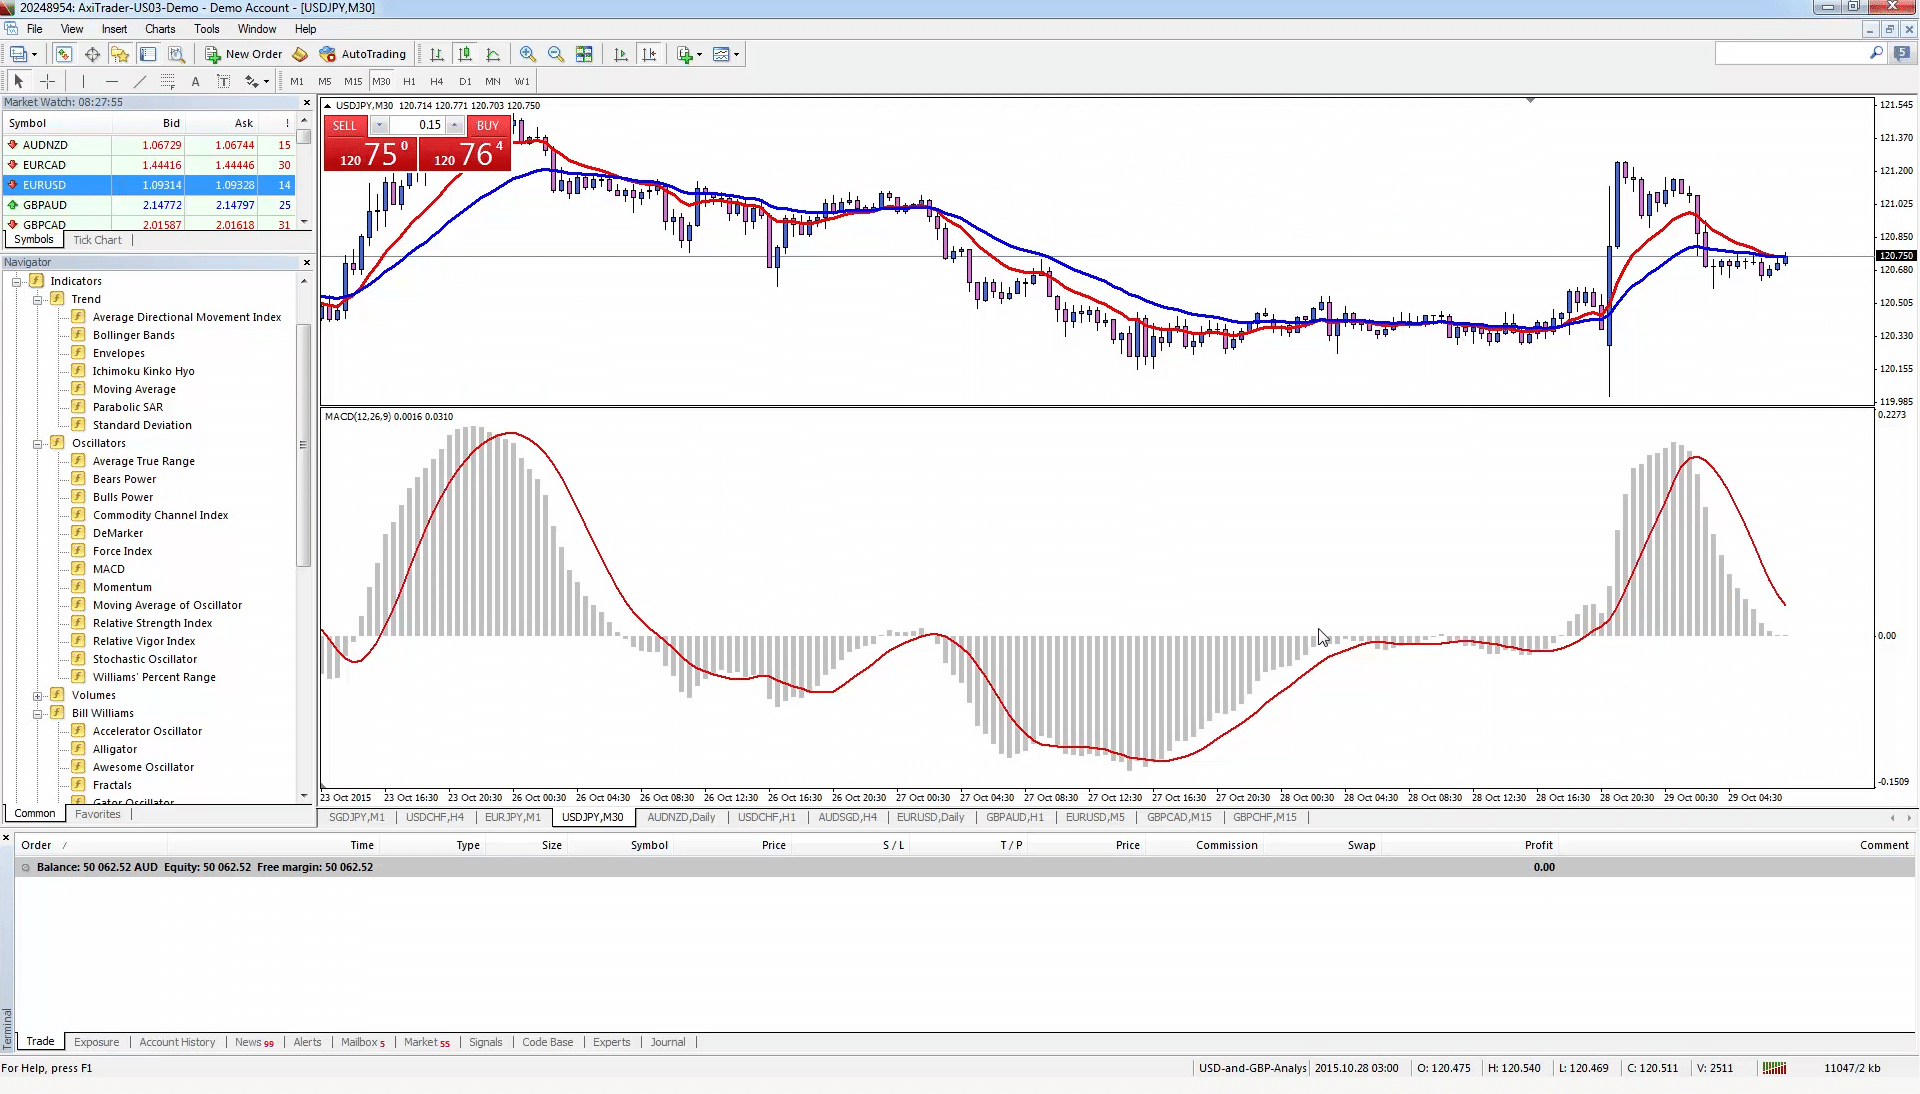
When the faster Moving Average line crosses the slower and then diverges further away, a new trend is formed. The further apart our two lines on the chart diverge, the bigger the bars on the histogram below, indicating a bigger trend. When the bars go upwards this is a Bullish trend and vice versa.
As soon as two Moving Average lines cross, the lines of the histogram will disappear as the divergence between the two lines is 0.
If the fast blue line crosses below the slow red line and the histogram disappears, this suggests that the brief uptrend will shortly reverse. That is your signal.
Advantages of MACD
- This indicator incorporates both a trend-following and a momentum indicator. As this indicator follows a trend, it will never be wrong for long
Disadvantages of MACD
- This is a time lag indicator, meaning it lags behind the real-time
Bill Williams Alligator
Professional trader Bill Williams created The Alligator indicator, which uses 3 smoothed out moving average lines to spot a trend. It also identifies a trend’s direction and can separate the good signals from the bad. It works on the principle of the Alligator splitting its time between sleeping and hunting.
This indicator uses 3 different moving average lines:
- Jaw (blue line) – 13-period smoothed moving average, moved 8 bars into the future.
- Teeth (red line) – 8-period smoothed moving average, moved 5 bars into the future.
- Lips (the green line) – 5-period smoothed moving average, moved 3 bars into the future.

You can see the three lines on this chart. When all three lines are entwined then the Alligator is supposedly sleeping, which means you will not see an uptrend or a downtrend. At times like this, Bill Williams suggests you stay away from trading this asset. See the image below to see the Alligator hunting and sleeping.
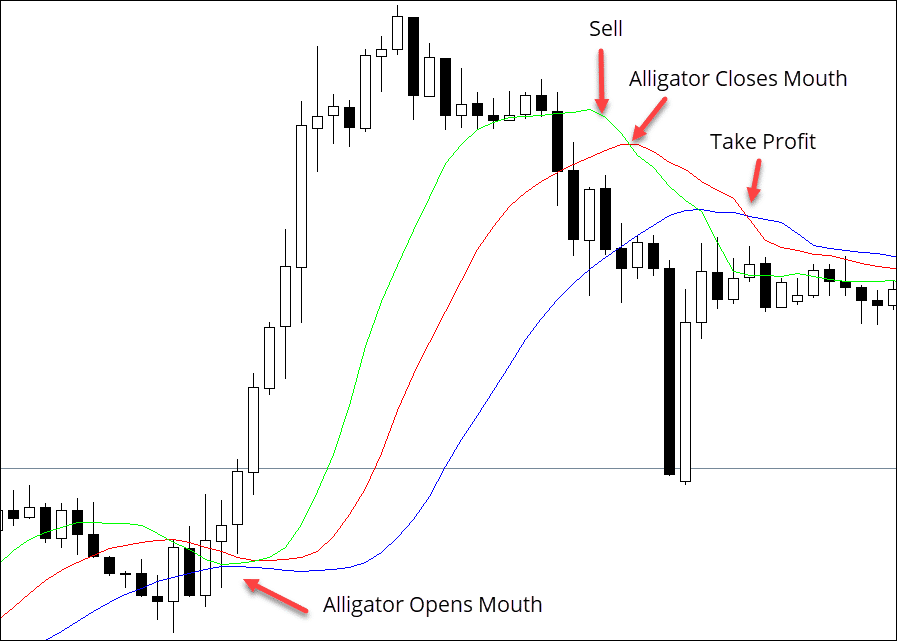
The longer the alligator stays asleep, undoubtedly the more hungry it will be when it awakes. When it finally wakes up it will open up its mouth, you will see this as the moving average lines moving away from each other. Just as it’s about to snap, then it is time to trade. Eventually when the Alligator has eaten its fill, it will then need to go back to sleep again. Then the Moving Average lines will move together again and that means it’s time to take your profit.
Advantage of the Alligator
- Helps avoid a range-bound market that can lead to losses
Disadvantages of the Alligator
- As with most indicators, the Alligator does come with its drawbacks as it can give false signals. Therefore it is worth just confirming the signal by using another signal indicator alongside this one.
Fractals
Fractals are a Forex indicator that can identify when a market is about to reverse its direction. A Fractal will appear on a chart when a particular price pattern occurs.
The pattern itself consists of five or more different candles. One central candle and two on the left and two on the right. These side candles represent the price trying to push higher. In the case of Up Fractals and lower in the case of Down Fractals. An Up Fractal shows where the price has tried and failed to go higher or conversely when the price struggles to go lower, a Down/Bullish Fractal will appear.
Formation of an Up/Bearish Fractal
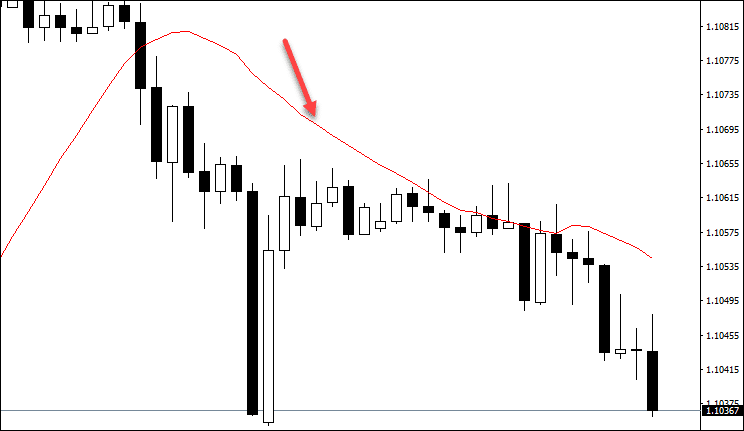
If you see an Up Fractal on the chart you will see one candle in the centre with two or more candles to its right, with two lower highs and two or more candles to the left side with two more lower highs. The red arrow you see in the image below indicates that once you have spotted a pattern of five candles in this shape, the trend will then reverse and start moving downwards.
Formation of a Down/Bullish Fractal
The reverse is true for a Down/Bullish Fractal where the central candle has two candles on the left side higher than it, forming two new higher highs and two candles on the right side forming two new higher highs. After you see this pattern it is likely that the market will reverse and move to the upside, as suggested by the green arrow below.
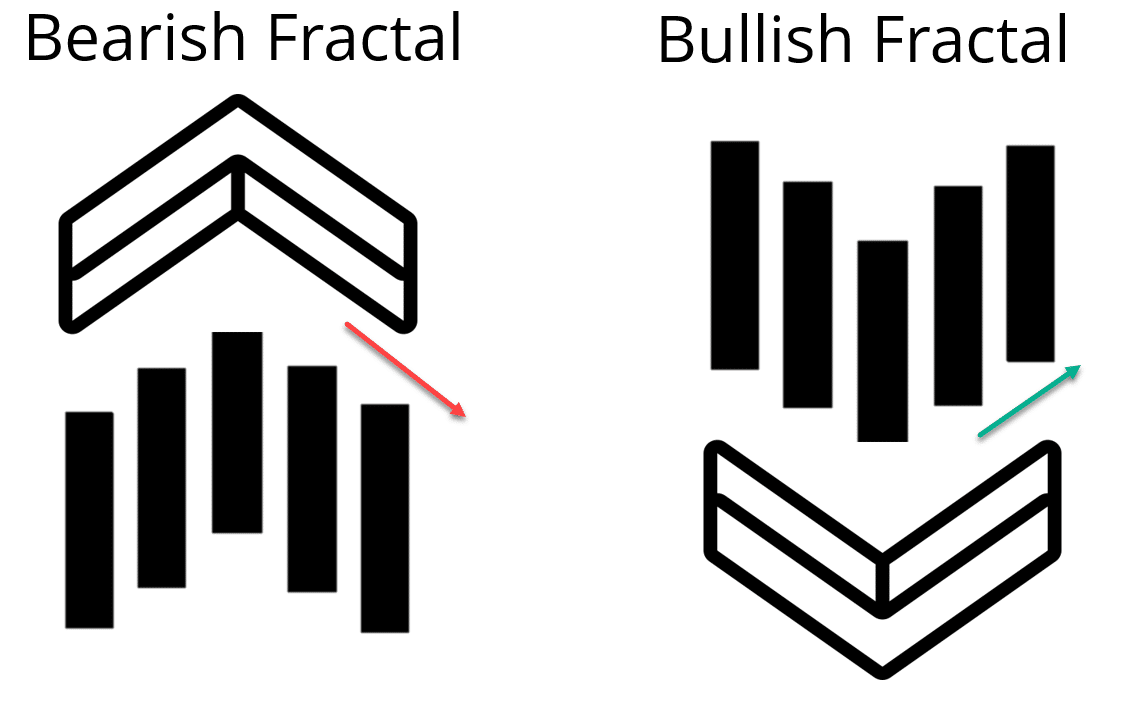 Bare in mind that the pattern will rarely look this perfect, and sometimes it can be harder to spot, but this image represents the basic pattern of five candlesticks.
Again, the important thing to note here, is that once you see this pattern, it is to be expected that the price will go higher from a Down/Bullish Fractal and go lower from an Up/Bearish Fractal.
When you see a Bearish Fractal on a chart it is usually drawn with an up arrow above the pattern.(See chart below) That’s because it is an Up Fractal and the trend should now reverse and move Up. Bullish Fractals are drawn with a down arrow above them as the market is now expected to move Down.
So if you are looking for this pattern in a Bullish market you should look for the down arrows. For Bearish markets, when trying to spot a Bearish Fractal, look for the up arrows.
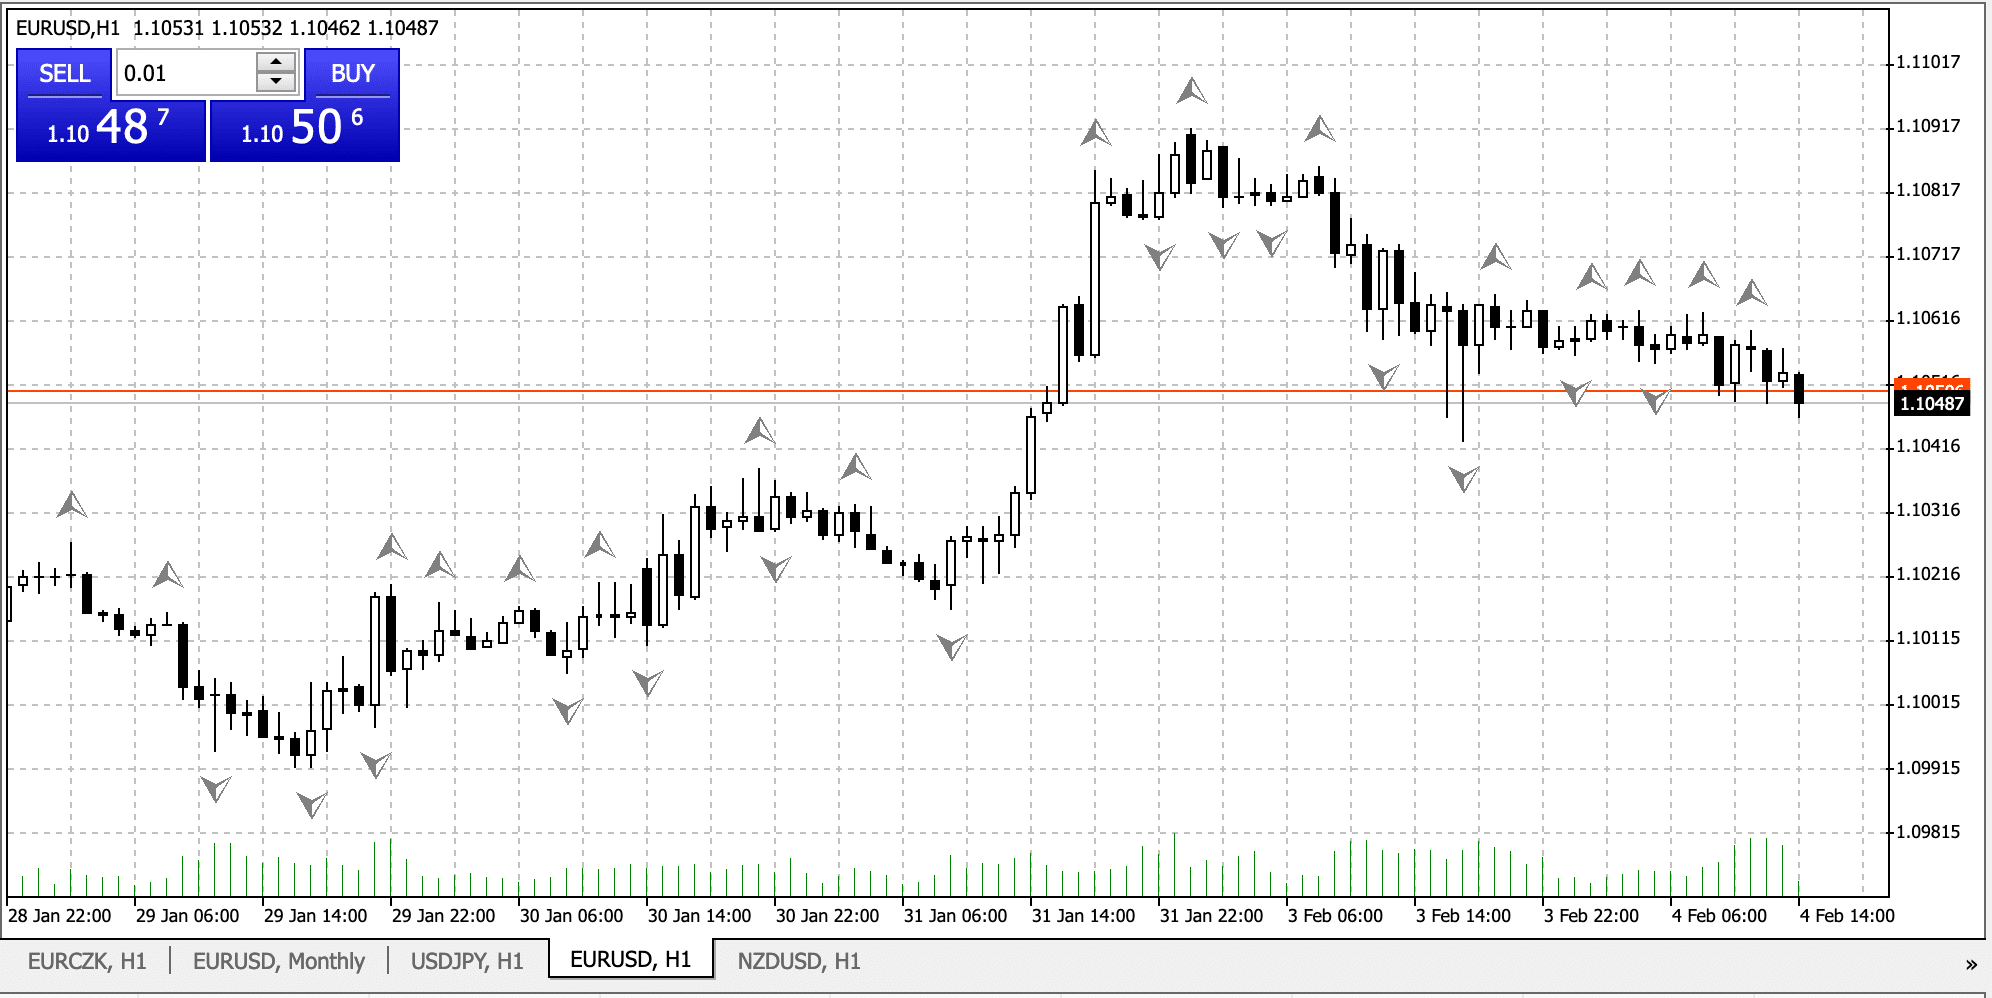
There are quite a lot of arrows on this chart. If you flick to a longer timeframe, that will cut out some of the arrows thus leading to clear signals.
Fractals work best when confirmed by a secondary indicator. Remember the Alligator we just looked at? This is a very common indicator to use alongside Fractals. If a signal appears from both the Alligator and Fractals, it will be a stronger signal than from one of those indicators alone. Some traders also like to use Fractals alongside Fibonacci retracements. Combining signals generated from Fractals alongside Fibonacci retracement levels is also a good way to create stronger signals.
Disadvantages of a Fractal
- As Fractals are lagging indicators they move slower than the market. The Fractal needs at least two candles from the existing day, that is 2 days to wait for the pattern to form.
- Since this indicator generates so many arrows on the chart, do not use it in isolation but rather combine it with another indicator.
[Bonus] Our Custom Indicators
We would love to share two of our favorite custom indicators. They work great and you can learn about them and then download them directly from the links below:
Conclusion
Forex indicators like the ones we have looked at above are used by many traders, as they cut out a lot of the guesswork associated with trading.
Traders like to create strong signals for themselves to enhance their trading edge, that is particularly true of using two or more indicators or technical studies in combination. Generating a signal is one thing, but confirming it is another thing entirely.
Go back over any of the indicators you see here and open up your charting software alongside, add the indicators on to your charts and you will see that actually they are more simple to use then they first appear.


Leave a Reply