Forex pivot points are great trading tools. Retail traders use the pivot point calculation to find important support and resistance levels. Moreover, they chose the right pivot point trading strategy to forecast the next market move.
This article aims to show how to use pivot points when trading the Forex market. As such, we’ll cover:
- Pivot point calculation
- Pivot point trading strategies
- Other types of Forex pivot points
- Fibonacci Pivot
- Camarilla Pivots
- Other Forex pivot points traders use
By the end of this article, you should have an idea about:
- what pivot points are
- how to use them to find great support and resistance levels
- other ways to use the original pivot point calculation
Technical traders love pivot points. Together with classic moving averages, traders like buying or selling at important support or resistance levels.
But, trading is not that easy. These days, any trading platform projects automatically the points needed.
No effort, no nothing. Just plot the right indicator on a currency pair and the levels appear.
Because trading is dominated by robots, classic ways to trade around pivots fail. That is, most of the time.
However, there’s a solution. The key is to use different approaches when interpreting a pivot point.
For example, to use Forex pivot points in combination with another indicator. Either trend indicator or oscillator, the idea is to have a second confirmation. D
Before going into more details, let’s start with how to find the pivot points levels.
Pivot Point Calculation – How to Calculate Pivot Points
A pivot point Forex traders use considers previous day’s data. There’s a little controversy about that.
It all starts with the daily closing. But, this differs from broker to broker.
Not all Forex brokers keep their servers in the same place. As such, the closing of the trading day differs.
For example, if a broker has the servers in New York, they use the New York’s closing. Others use the 4:00 PM EST as the previous day’s close.
But, since we discuss Forex pivot points, it is fair to use the previous day’s close. It makes no sense to use a simple point in the trading week. The Forex market goes 24/5.
Forex Pivot Points Definition
Pivot points plot horizontal support and resistance on a chart. Those levels have a name.
As such:
- P = the pivot point
- R = resistance
- S = support
But, there are not only one support or resistance levels. The Forex pivot point calculator plots three levels for each.
Therefore, there’s an R1, R2, and R3 as distinct resistance levels. They offer resistance on different levels.
As a rule of thumb, the R3 is the most difficult to break. The opposite is true for support.
S3 offers to most of it, while S1 is easier to break. When plotted, they look like the chart below.
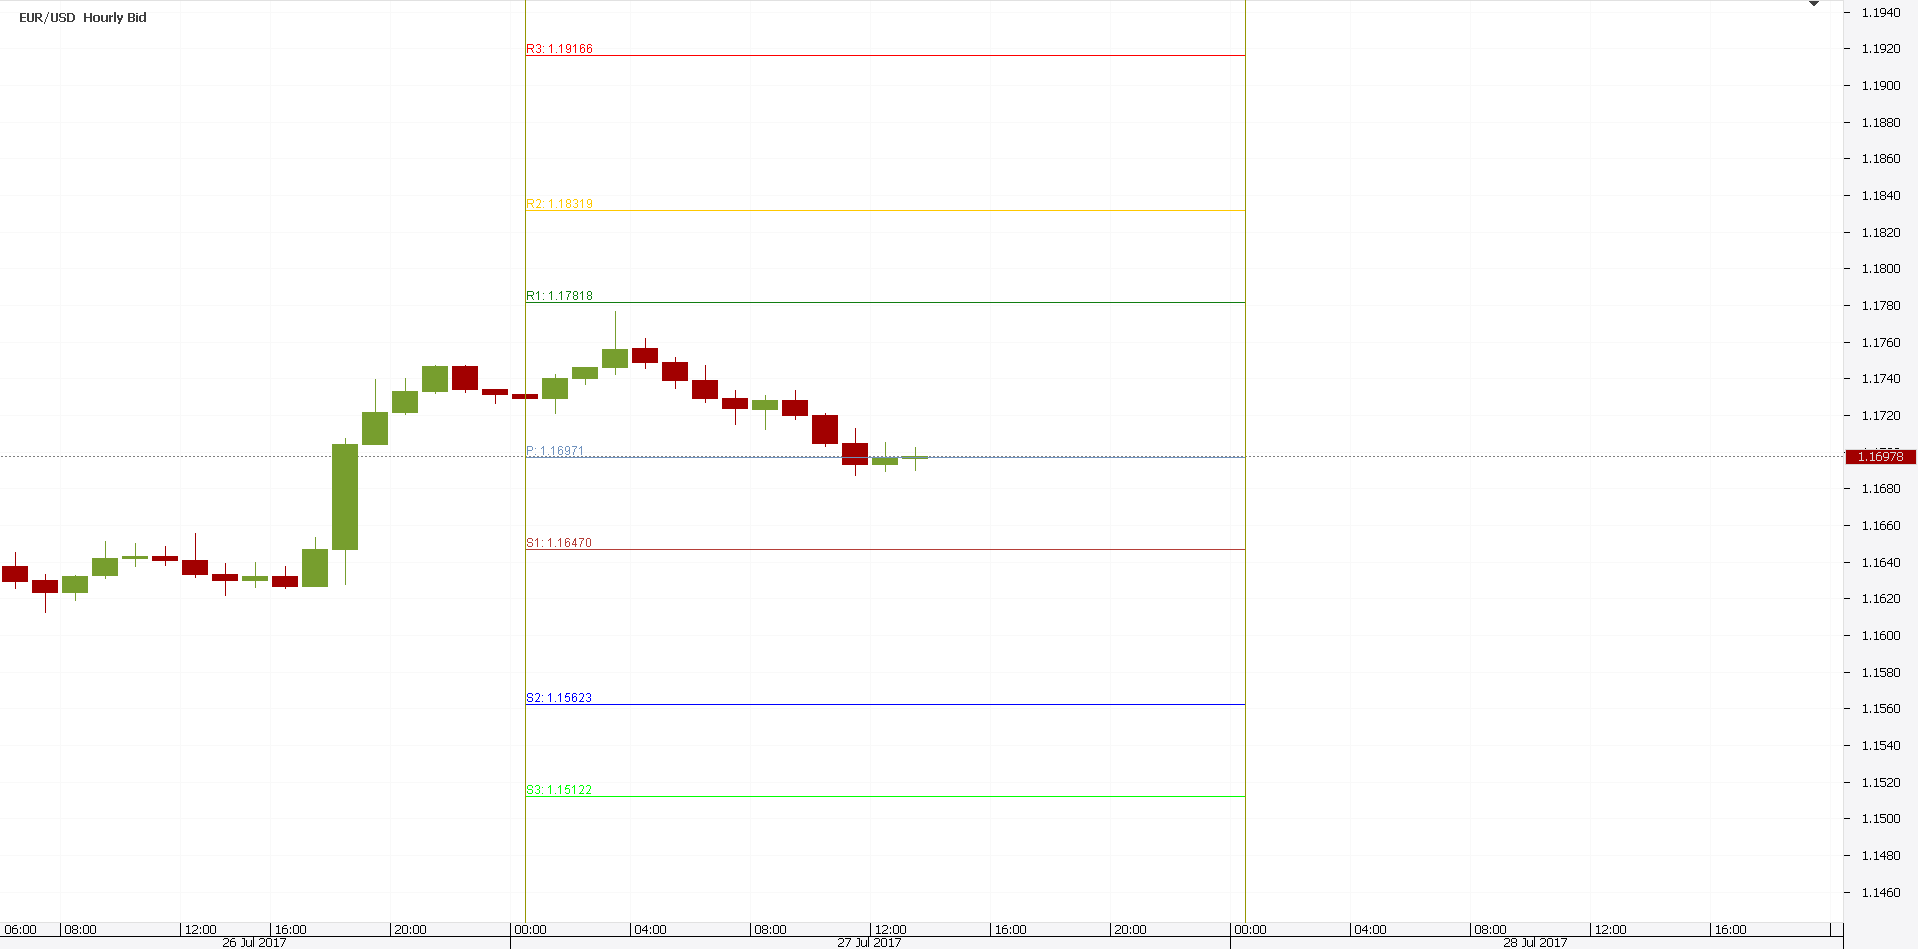
That’s the hourly EURUSD chart. When the price is at the pivot (P), the market is in a state of equilibrium.
Like the chart above shows. Anything above represents resistance. And, everything below is support.
A simple pivot point trading strategy calls for scaling into a trade. Divide the entries and sell at R1, R2 or R3. Or buy at every support.
But where do those level come from? Before answering this question, keep in mind one thing: from daily time frames and above, the pivots won’t appear anymore.
The levels simply refer to the previous day. As such, any pivot point trading strategy must consider lower time frames than the daily one.
FX Pivot Point Calculator – Showing the Method
Time for a little math exercise. As the Forex pivot points consider the previous candle, you must now the highs and the lows, open and close levels of it.
Therefore, let’s start with the main pivot point (P). Its formula is:
P = (High + Low + Close)/3
Keep in mind those values refer to the previous daily candle. Based on the result of that formula, we can calculate the rest of the FX pivot points.
Firstly, we have:
R1 = (2 x P)-Low
S1 = (2 x P)-High
Secondly, the following support and resistance layer look like:
R2 = P + (High – Low)
S2 = P – (High – Low)
Finally:
R3 = High + 2(P-Low)
S3 = Low – 2(High-P)
Sounds fancy? Not really.
Remember, all those values are known in advance. Simply check the OHLC ticker on the previous daily candle.
Yet, you don’t need to be a math genius to do this. Not even close.
The trading platforms calculate these values automatically. A pivot point indicator mt4 is easy to find. Simply upload it on the trading platform and the levels come automatically.
A Pivot Point Trading Strategy That Works
We already touched the basic Forex pivot point strategy. Buy or sell at support/resistance.
The classic way to trade Forex pivot points is to sell resistance/buy support. But, if this should come as part of a trading system.
Or, of a money management system. Look for risk-reward ratios that make sense.
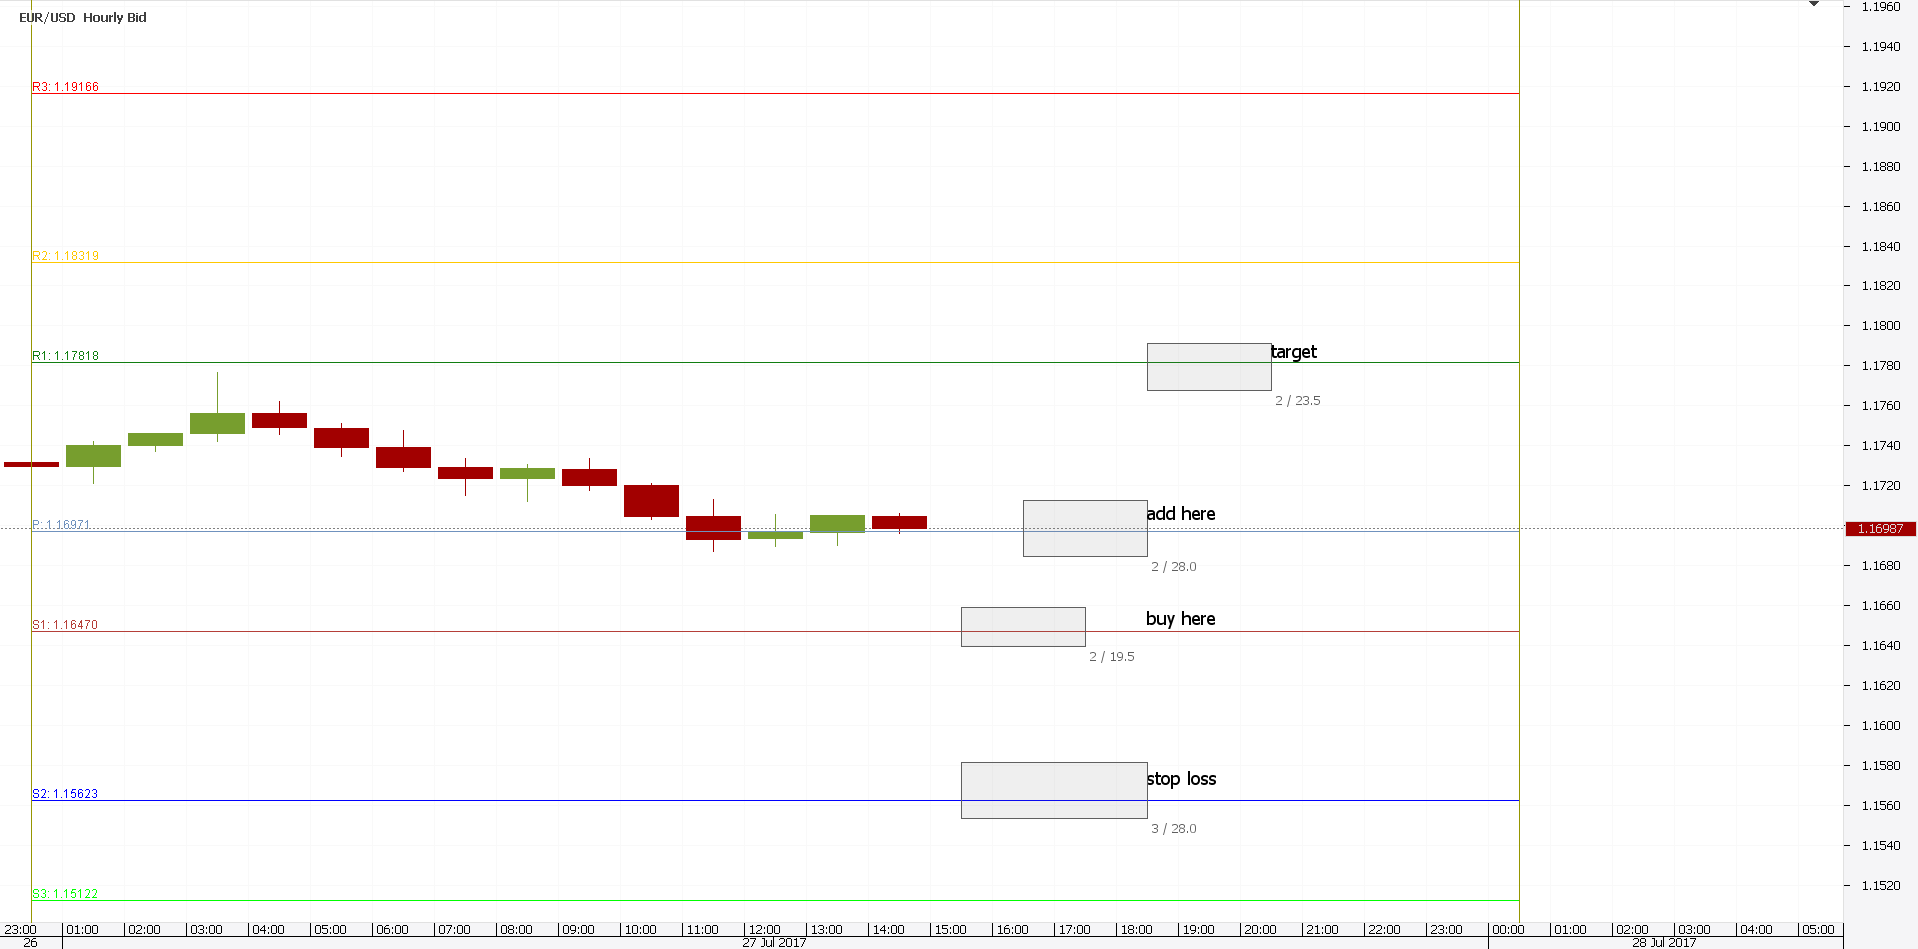
If the price is at equilibrium (pivot), there’s nothing to be done. Such a pivot point trading system relies on several points.
Firstly, wait for the price to reach S1 or R1. In the above example, S1.
Secondly, go long, with a stop loss at S2. That’s the risk.
But, that’s not enough. You must integrate it in a money management system.
This is not binary trading to risk more than the potential reward. Forex trading allows for greater risk-reward ratios.
As such, pivot point calculation’s levels are part of it. Find out the exact distance for the stop and use a bigger take profit.
Finally, use the pivot point (state of equilibrium) to add to your trade. Obviously, the R1 represents the final target.
Why not staying for more? One answer would be that you never know what the market will do.
In a ranging environment, the price will simply bounce like a pinball between S1 and R1. And, most of the times the market consolidates.
Action Forex Pivot Point – Counter Example
There’s one important thing to mention here. Not everything you find on the Internet related to pivot points is true.
Especially the trading examples. You must not forget the support and resistance lines start from the beginning of the trading day.
As such, your pivot point strategy is an intraday one. This is both a blessing and a curse.
A blessing, because it forces traders to close trades at the end of the trading day. After all, support and resistance levels will change the next day.
This is a good thing, despite many traders hating it. It keeps traders in control.
It makes traders become disciplined. Therefore, no matter what, the trade gets closed.
You must take what the market gives. So, what if the take profit doesn’t come? A rule is a rule.
You should know by now Forex trading is relative. The market swings are so wild and powerful that exact physical levels don’t come all the time.
Because of that, traders look at an “area”. The same with the Forex pivot points.
Look to sell or buy, “around” a support or resistance. Sometimes, the last pip is the most expensive one.
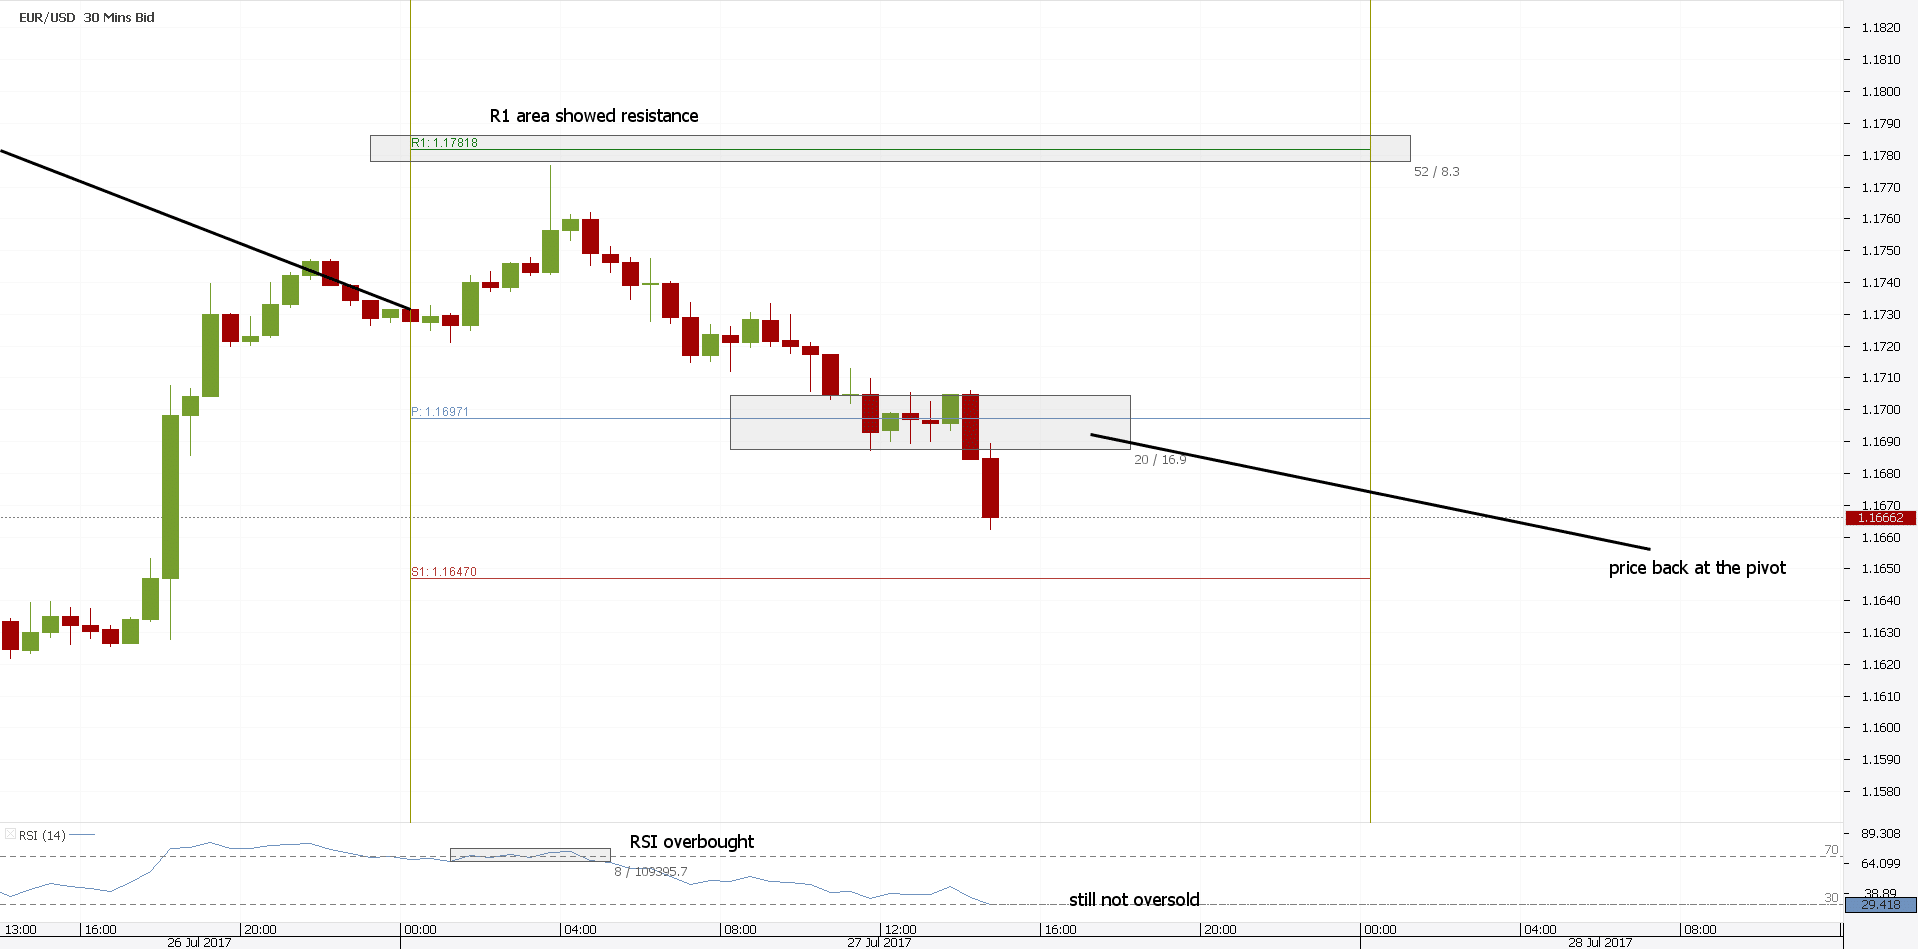
Simply put, because of a small distance, you may end up outside of a trade. Check the chart below.
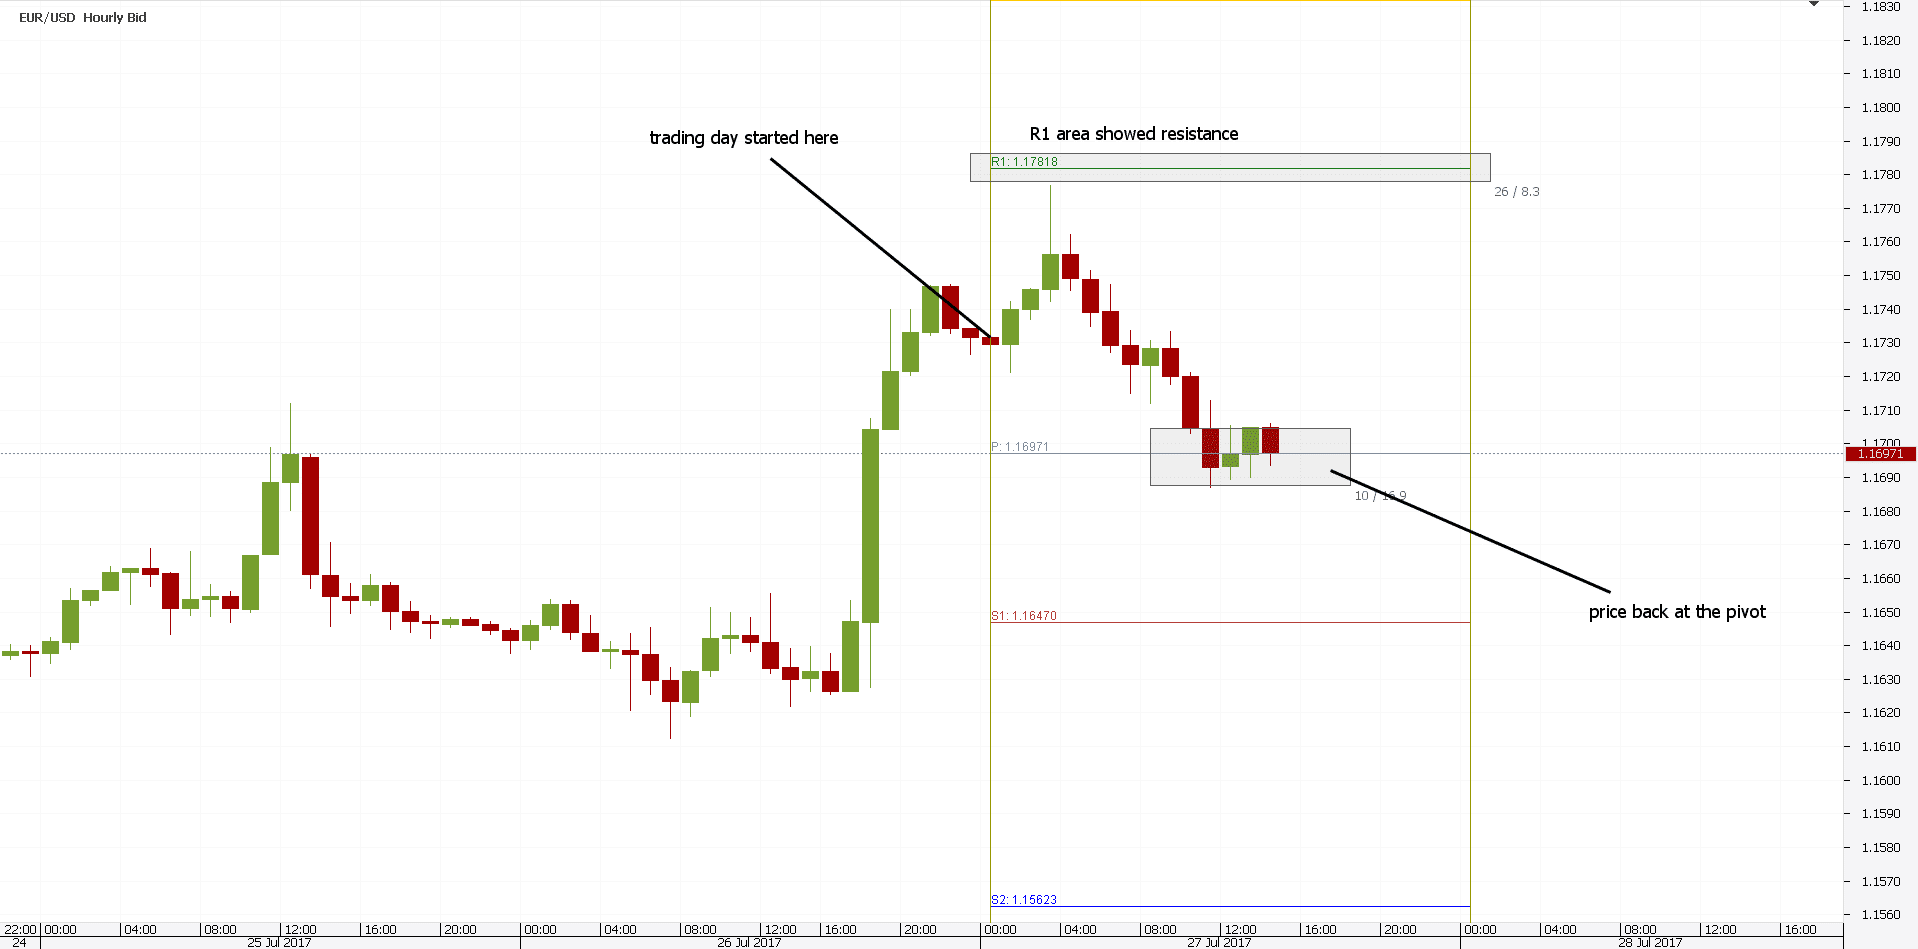
After the trading day started, the price “almost” reached R1. Yet, savvy traders took the trade.
The idea is to look for the market to come to equilibrium (pivot). It did. What next?
Traders have two options here:
- Move stop loss to break-even and trail the stop.
- Add to the short until the S1 “area” comes.
How can we tell when is the right time to sell/buy? Other indicators come to help. Especially oscillators.
Oscillators with the Pivot Point Indicator
The result of a pivot point calculation may show classical support and resistance levels. But, traders look for confirmation.
This comes from various areas. Either a Fibonacci retracement level on a bigger time frame forms a confluence level.
Or, a previous support turned into resistance. Or the other way around.
Moreover, traders use other trading indicators for help. Oscillators are great ones for this purpose.
Let’s come back to the previous example. It was on the hourly EURUSD.
The idea is to use a lower time frame and an oscillator. This way, the pivot point trading rules are the same.
But, traders get some help in the form of an oscillator. In our case, the RSI (Relative Strength Index) comes to help the trading decision.
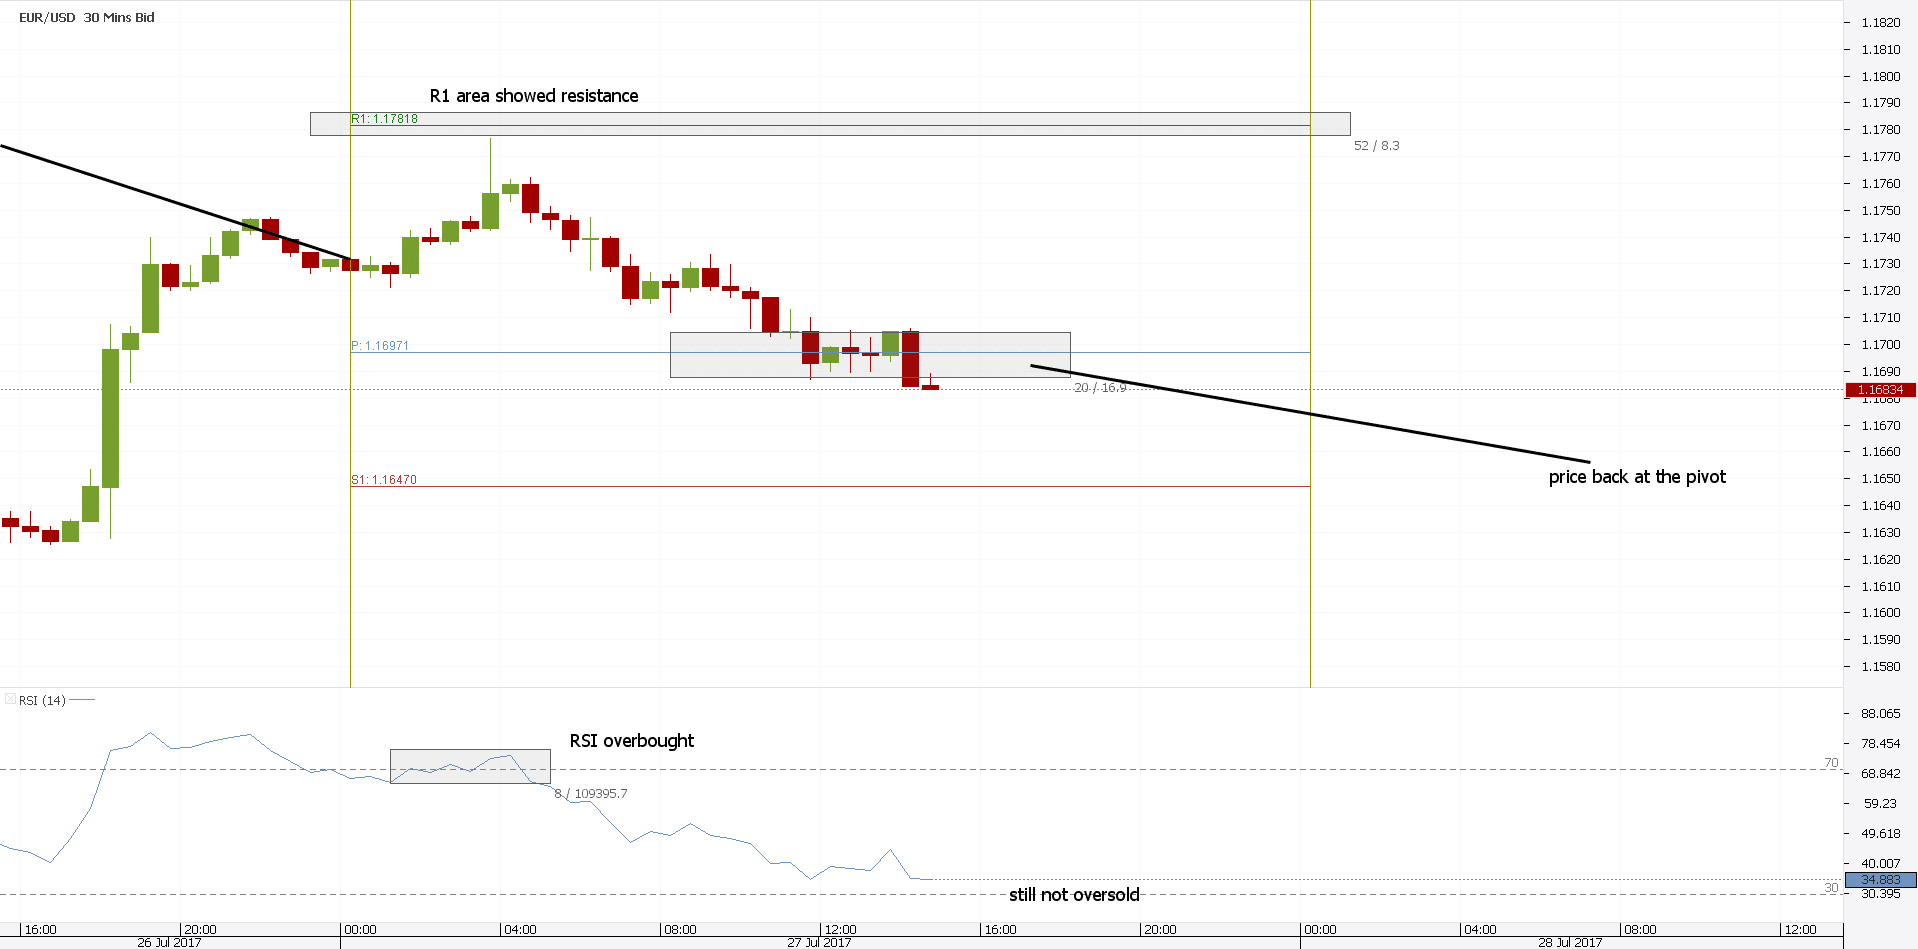
Part of a pivot point day trading strategy, the oscillator appears on the 30-min chart. The short trade is vindicated.
While the price didn’t quite reach the R1, the RSI was way overbought. Selling in the area was the right decision to take.
But, now that the price reached the equilibrium, what to do? The answer comes from the oscillator.
A closer look reveals it didn’t yet reach the oversold level. As such, traders use this for adding to the short trade when the price reaches the Pivot.
Moreover, they stay short for either the S1 area or the oversold levels to come. Here’s what price did next:
The live example we used here aims to prove one thing: pivot points work better with additional help. Any oscillator would do a great job here.
Other Types of Forex Pivot Points
Traders should know there’s more than one Forex pivot point indicator. As such, the pivot point calculation changes.
Depending on the trading platform, they are already integrated or not. Most of the trading platforms don’t offer them.
But, they’re easy to find and plot. The thing is that the pivot point trading strategy won’t change.
Yet, the levels do change. And, some traders say that pivot point trading differs with the calculation method.
As always, Fibonacci is everywhere.
Fibonacci Pivot Points – Forex Pivot Point Strategies Kept Simple
Fibonacci levels have a great influence in technical analysis. Entire trading theories were built on them.
This is especially true in the case of the 61.8% level. Yet, other levels play an important role too.
Just to give an example, the Elliott Waves Theory is built almost entirely on the Fibonacci numbers. So, why should we be surprised if there’s such a thing as a Fibonacci pivot point?
The Fibonacci pivot points start from the same state of equilibrium. The P level has the same formula:
P = (High + Low + Close)/3
But, the derived levels use Fibonacci ratios. Therefore, support levels are:
S1 = P – 38.2%(High – Low)
S2 = P – 61.8%(High – Low)
S3 = P – 1(High – Low)
Consequently, resistance is:
R1 = P – 38.2%(High – Low)
R2 = P – 61.8%(High – Low)
R3 = P – 1(High – Low)
It goes without saying, the golden ratio level is king again. As such, a pivot point trading strategy with the Fibonacci pivot points uses the S2/R2 as cornerstone levels.
A difference between the classic pivot point FX indicator exists. The Fibonacci pivot shows the previous levels on the screen.
Some traders use them to define an area to buy or to sell. Not only a simple level like in the case of the classic Forex pivot point.
The thing is that it works like a charm. It shows the power of Fibonacci numbers in conjunction with other indicators.
Pivot Point Trading Techniques with the Fibonacci Pivot – Example
A pivot point strategy works best if it is part of a money management system. We already covered that.
The example below further emphasizes this point. And, it shows why the previous S2/R2 levels are important too.
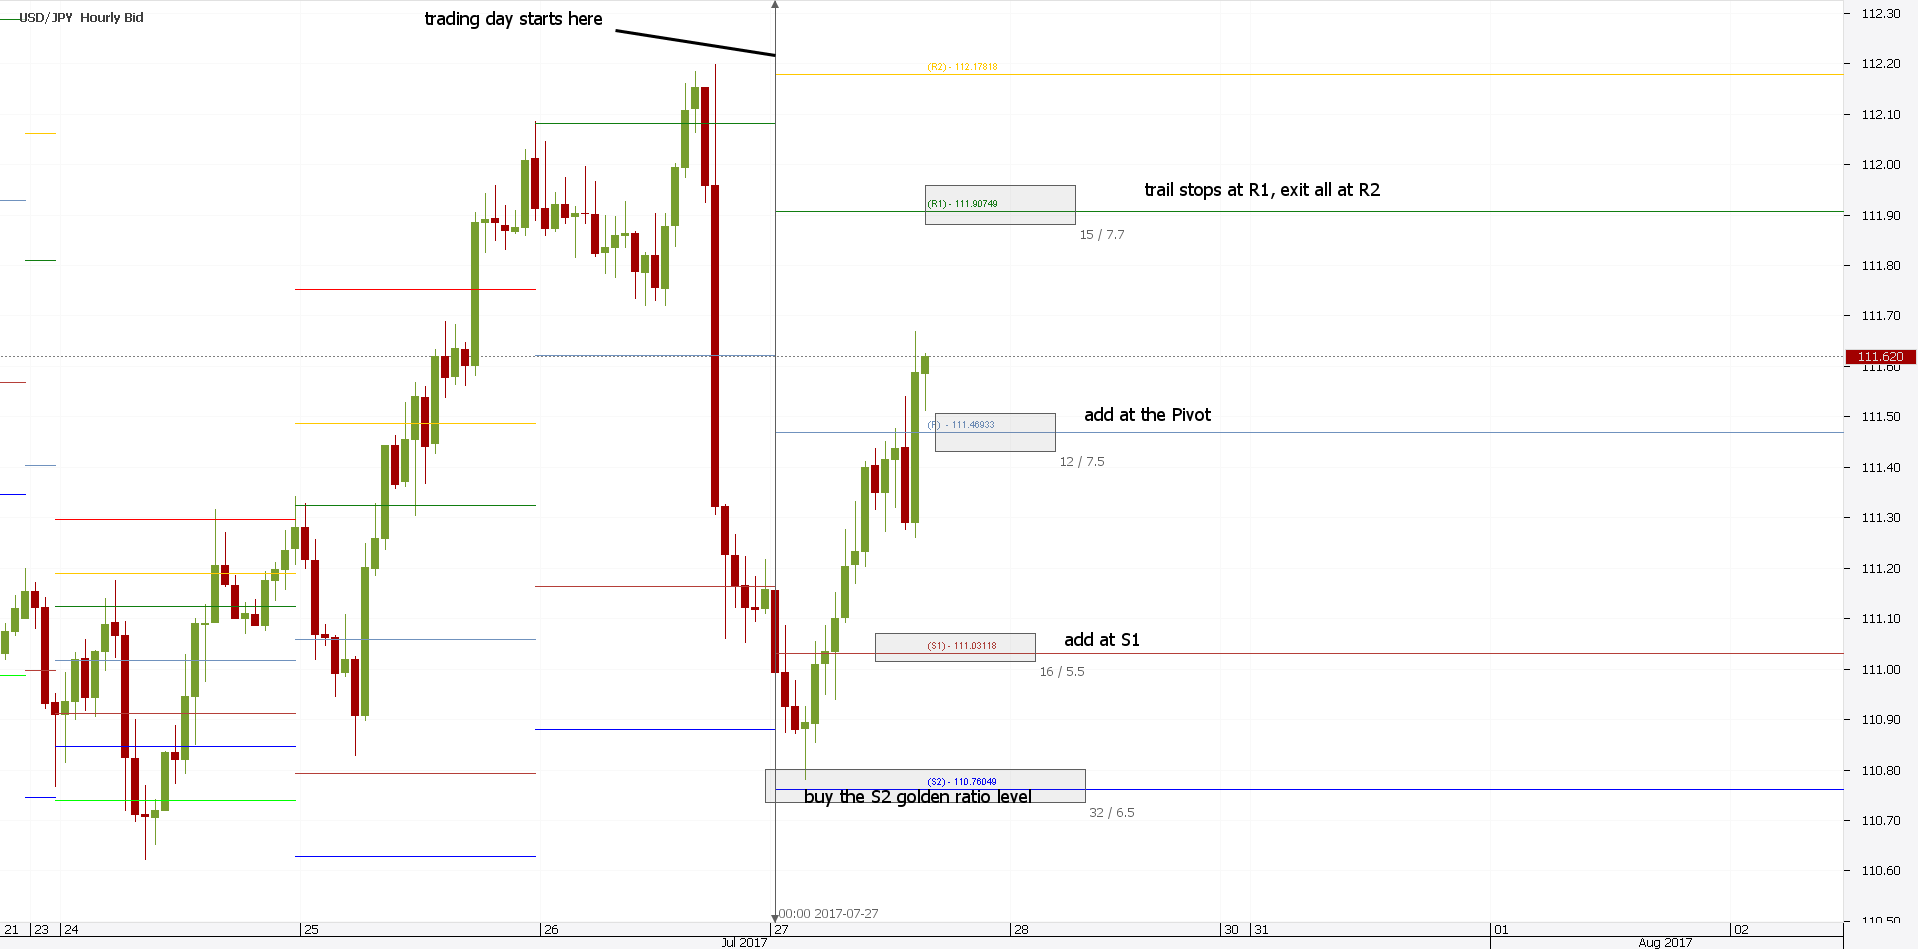
Above is the USDJPY hourly chart. The pivot point calculation used is the one described earlier.
As such, the pivot point trading strategy focuses on the S2/R2 levels. Or, the so-called golden ratio levels.
Which one comes first, traders take it. Here’s a several steps trading plan to consider.
First, make sure you know where the trading day starts. That’s important, so not to confuse the levels.
Second, find the S2/R2 levels. Mark the area around them.
Third, check the previous day’s S2/R2 levels.
Next, look for any dip/spike into the area between previous and current S2/R2. That’s the long/short trade.
Finally, wait for the price to reach one of those levels. Patience is key here.
The moment a trade comes, the stop loss is set at the next level. In our example, the S3.
For the take profit, traders look for a proper risk-reward ratio. The R2 looks amazing.
However, until then, there’s a distance to travel. Aggressive traders add at S1.
Moreover, some add even at the pivot level. And, by the time R1 comes, they trail the stop or book partial profits.
See the difference between this pivot point trading strategy and one derived from classic Forex pivot points? The risk-reward ratio looks nicer.
However, one caveat applies here too. The moment the trading day ends, traders take what the market gave.
After all, what is pivot point if not an intraday strategy for scalpers?
Is there Something Else to Know about Forex Pivot Points?
The right answer is yes. In time, traders looked for various ways to calculate other pivot points.
Not that the pivot point calculation as we know it doesn’t work. But, the stronger the support/resistance level, the better.
As such, other pivot points were introduced in technical analysis. In 1989, Nick Scott, a bond trader, discovered Camarilla pivot points.
Other successful technical analyst, Tom DeMark, found a unique way to calculate pivot points. Hence, DeMark pivot points appeared.
However, the idea is the same. The aim is to find such a place on an intraday basis, to profit from daily market swings.
Conclusion
Pivot points offer a way to find price direction. Traders use them to find support and resistance levels.
But, levels are not a line in the sand. They are merely an area.
Sometimes, when a new trading day starts, the price is above or below the pivot.
As such, a trading decision is difficult to take. However, if traders follow a pivot point trading strategy with clear setups, they’ll prevail.
There’s no holy grail in trading. There’s only patience, discipline, and the strong desire to follow a plan.
A losing trade is just that. A losing trade.
Therefore, traders set a stop loss. To avoid being caught on the wrong side of the market.
Pivot points have the great advantage of showing intraday levels. Moreover, visible levels.
As with everything in technical analysis, traders look for confirmation. Be it a candlestick reversal pattern, an oversold level with an oscillator, or any other clue that helps – they only reinforce the pivot points’ power.
To sum up, Forex pivot points as classical patterns changed in time. And, they’ll still change.
New approaches will appear. New traders with a new vision will look at Forex pivot points differently.
But, every approach aims at the same thing: to find the most powerful support and resistance levels for a trade.
When combined with fundamental analysis, pivot point levels are even more powerful. The idea is to look at events in the economic calendar and filter the trading signals accordingly.
In doing that, your trading becomes complete.
START LEARNING FOREX TODAY!
share This:


Leave a Reply