Price action trading is a form of technical analysis. But, a special one. A price action trading strategy focuses on current price levels derived from previous ones. That’s what differentiates the price action of a currency pair from trading with indicators. Moreover, Forex price action works on all time frames.
When it comes to price action, the focus is on past prices. However, there’s a catch.
By past prices, one refers to the actual ones. Not current values derived from past prices.
Let me explain. An oscillator or a technical indicator plots current values derived from past prices.
Whereas a price action trading strategy deals with current prices based on actual past prices. Not derived from them.
For many, it means the same thing. But it is not.
There’s a thin line between the two in the wording here. Like in a central bank’s communique, it’s all about how you put it.
Forex price action tries to describe human nature. Or, how traders observe and trade the markets.
In its most simplistic form, price action represents classic technical analysis. Or, the starting point in any technical analysis process.
This article will go through what price action trading is. Essentially we’ll deal with concepts like:
- Support and resistance levels
- Market geometry
- Trend lines
- Rising and falling channels
- Basic price action patterns: rising and falling wedges, head and shoulders, and triangles
- Forex price action around tops and bottoms
- Why automated trading matters in price action trading
Above all, price action means trading without any indicator on a chart. Or, trading with a naked chart.
Is this even possible? Of course, it is!
The examples here will explain the logical process of building a chart from scratch. Pure technical analysis at its best.
Price Action Trading Definition
Price action or the action of price shows how prices change. These changes happen for various reasons.
Typically, imbalances in supply and demand make the price change. However, they aren’t that obvious in the Forex market.
Because of the huge volume, the Forex price action strategies would have to rely simply on how price moves. Without considering other indicators, price action setups must rely on something else.
As such, major candlestick patterns, triangular formations, and everything that comes out of behavioral observations fit the bill. Pure, naked, technical analysis or behavioral technical analysis forms price action trading.
This article helps you to read a price chart. But, without using any technical indicator. Are you ready for it?
Are you ready to learn to base your trade on pure price movement? And nothing else?
Forex Price Action Basics
As mentioned earlier, a price action pattern starts from a simple trend line. And, it can take various shapes.
Everything you know about pattern recognition trading is part of the price action Forex traders use. Because of the vast subject, we’ll cover the important points only.
And, we will do that using clear examples. Basically, we’ll build price action setups starting from the very definition: technical analysis on a naked chart.
Price Action on a Naked Chart
Before continuing, let’s review the difference between using an oscillator and a price action strategy. The first one projects current level derived from past ones. The second one uses past levels to trade current ones.
As such, basic technical analysis works best. If you want, it is common sense when looking at a chart.
Below is the current EURUSD price action. Quite a bullish one on the four-hour time frame.
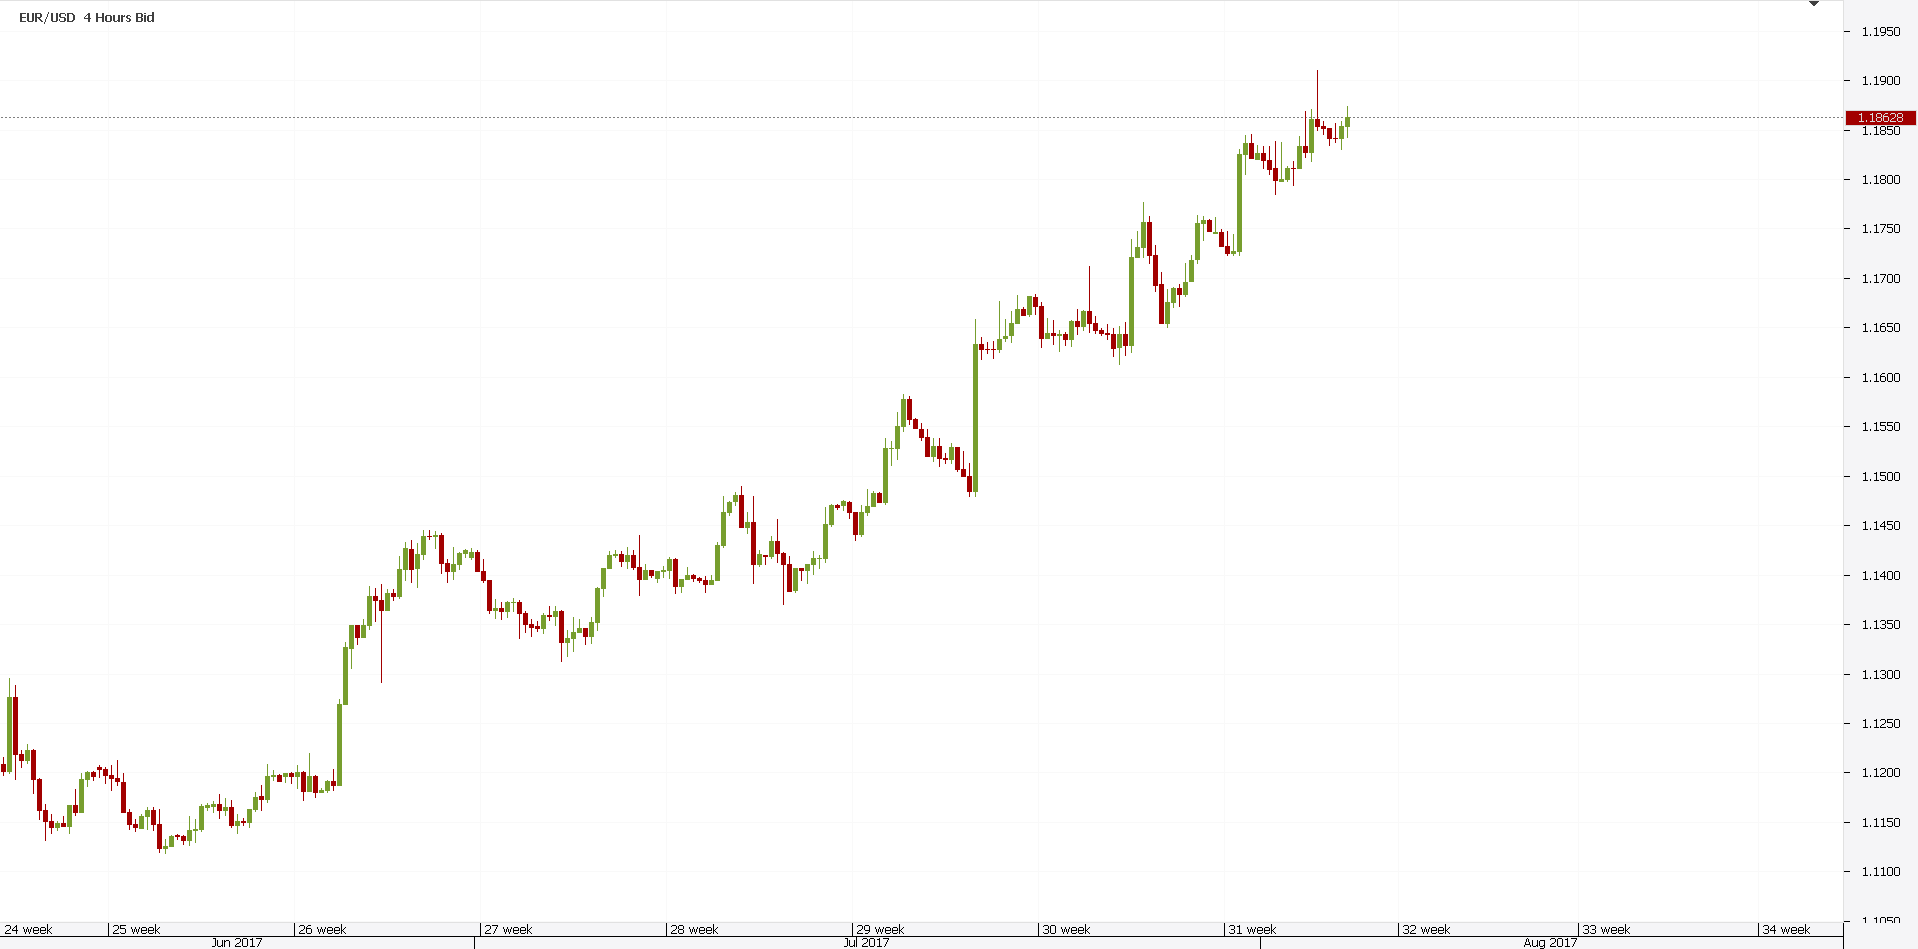
Can we do something with this naked chart? Without using any indicator?
Is there a price action trading system that works? The answer is yes. There are several things one can do.
Firstly, we notice a rising trend. As such, it all starts with a trend line.
After all, it is the line of the trend. Right?
Therefore, the idea is to connect the lowest points (price action from the past). Next, drag the trend line on the right side of the chart.
When/if price meets the trend line again, that is a level to consider. If price rejects from it, that’s price action trading in its purest form.
And, it did. Not only that, but it strongly traveled in a bullish move.
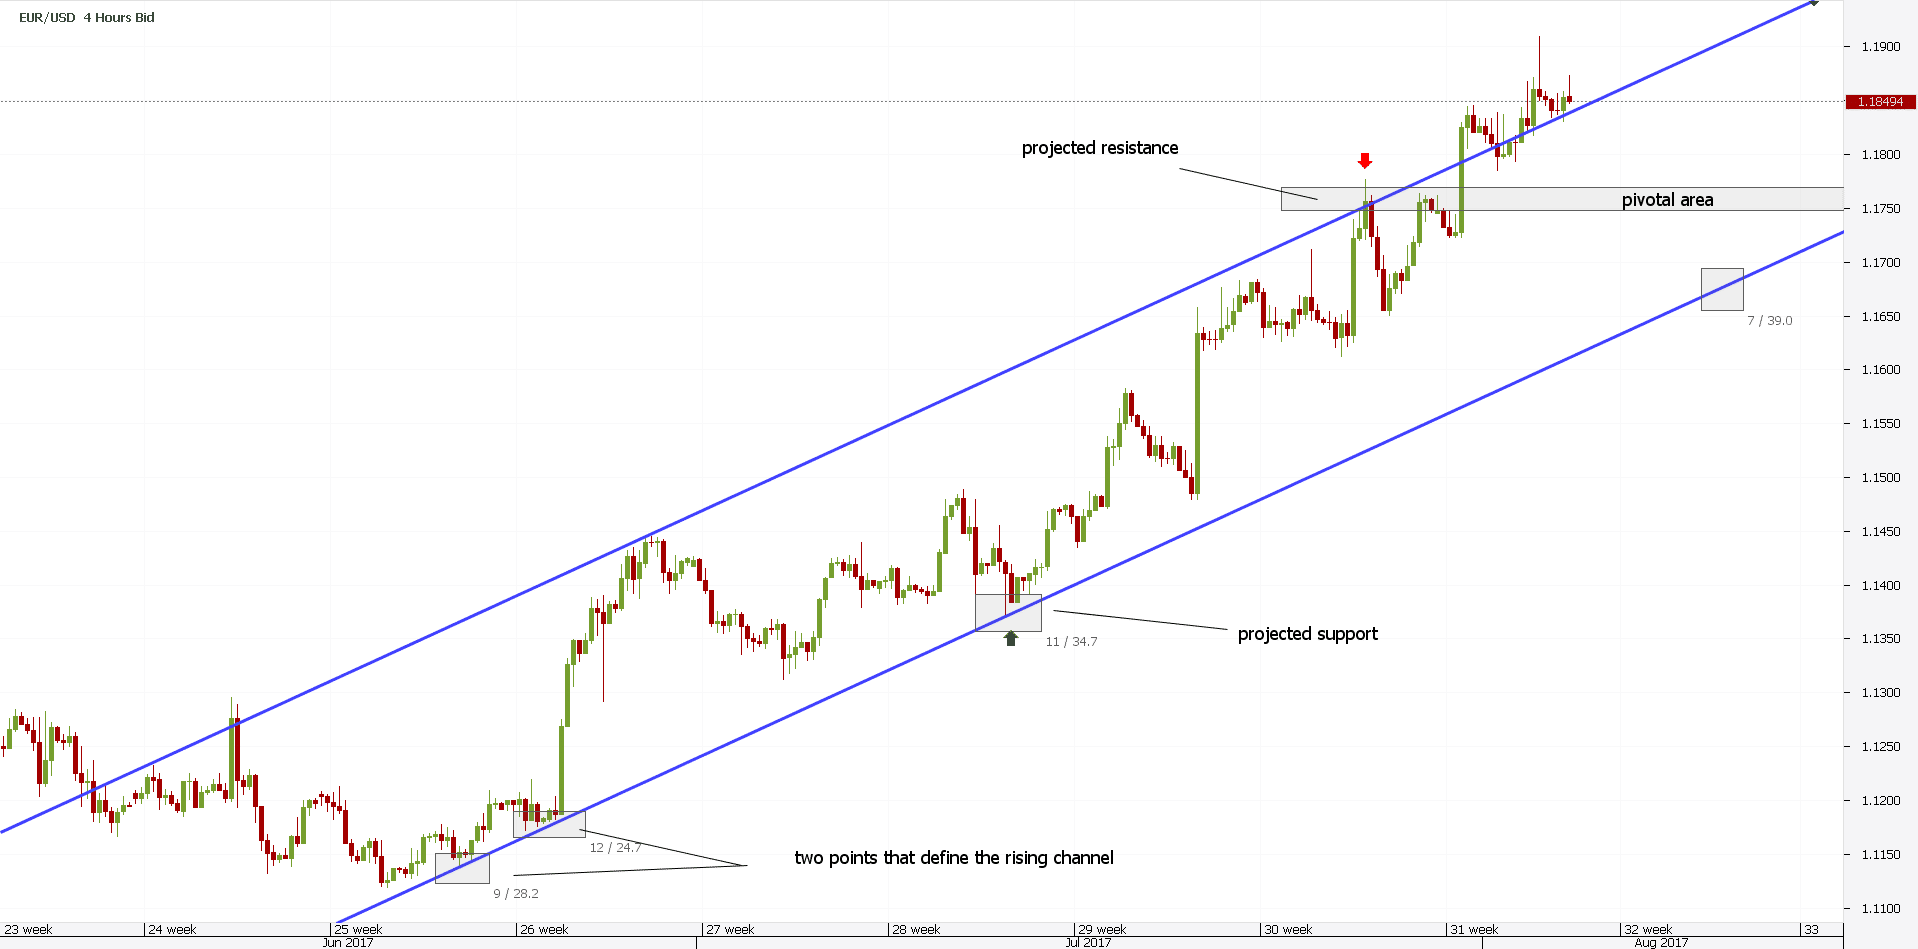
Secondly, now that the trend line has proven itself, we can reuse it. That’s smart, as it builds a rising channel.
The focus now shifts to the Forex price action around the opposite/parallel line. Or, the upper edge of the channel.
It acts as resistance. A dynamic one.
However, price action is so bullish, it breaks the rising channel. As such, a price action trading strategy is to look for the projected resistance to become support.
Or, the entire area to become a pivotal one. But, what to do now that the price has broken the channel to the upside?
Market Geometry as a Price Action Trading Strategy
The answer comes…from understanding price action. We can use that spike to trade the pair from a market geometry point of view.
Market geometry refers to the ability to project support/resistance areas. That is, from the left side of the chart to the right side.
When trading, there’s a saying: the information on the left side of the chart is free information. Therefore, traders use it to project future patterns.
A price action trader has several steps to follow. First, he/she measures the spike outside the channel. Second, will project that distance from the lower edge of the channel.
Finally, will copy/paste the main trend line (the line of the trend, remember?) from those two points.
The result is a market geometry support. Not any kind of support, though. But one derived from market geometry resistance.
The chart below shows the outcome of this price action trading method. Traders will focus on price to break the pivotal area.
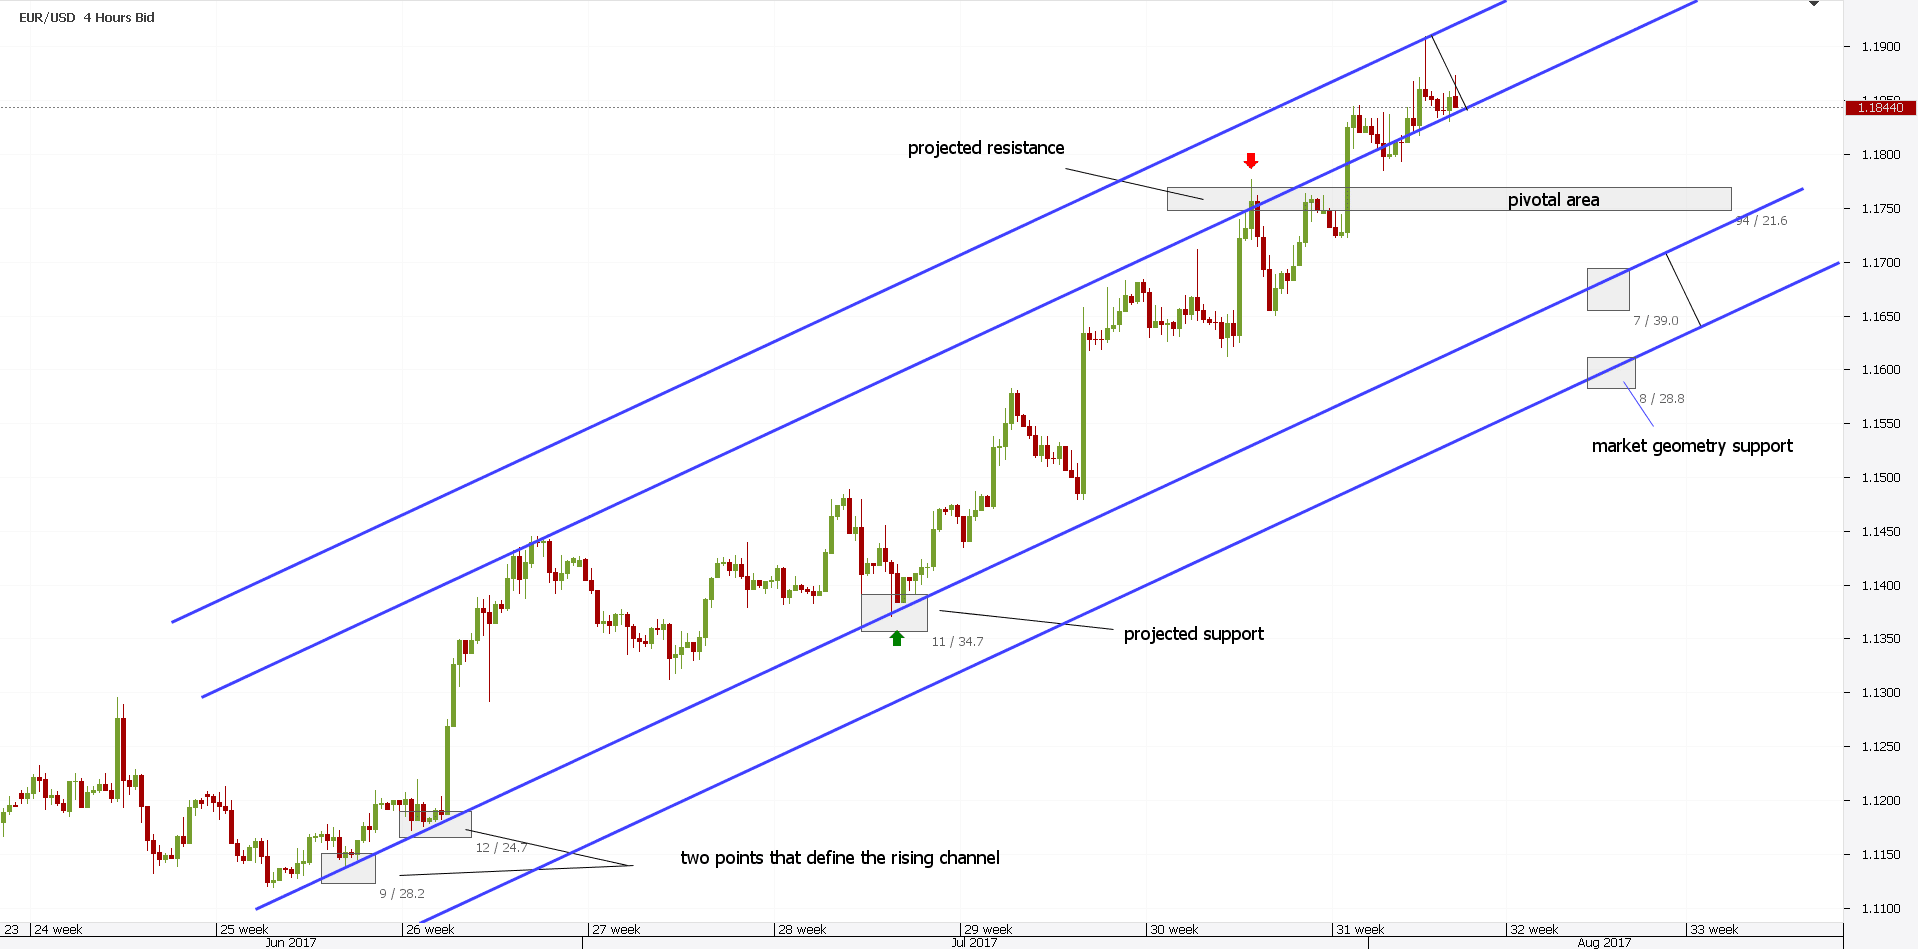
And, they’ll stay short until the market geometry support comes. At that moment, they book partial profits. If there’s a potential bounce, that’s the area to bounce from.
Now, step back from the screens a bit. And, check again the first EURUSD chart posted. The naked one.
Next, compare it with the one above. The difference between the two is the result of a price action Forex strategy.
Psychological Levels as a Price Action Indicator
Daily price action around psychological levels represents the perfect way to understand price action trading. For whatever the reason, the Forex market likes round numbers.
Values like parity (one), or 1.10, 1.20, and so on, attract price action. As such, the market makes various patterns around them.
Depending on the currency pair, the velocity around these numbers differ. For example, the AUDCAD pair struggles for years around parity.
Just check for yourself. The moment price goes above parity, the Forex price action loses momentum. And, eventually, it will turn.
The same happens on a bearish move. Eventually, price action loses steam and it will turn.
However, before doing that, the market forms patterns. Classical patterns.
Rising or falling wedges, double and triple tops and bottoms, candlestick reversal patterns, classic support and resistance levels…all these form a trader’s arsenal to read price action. They show what is price action.
Price Action Forex Trading – the EURAUD and 1.50 Level
At the start of this article we mentioned that we would use plenty of examples. This is what we do.
Understanding price action trading works only if one loves charts. And, believes in them.
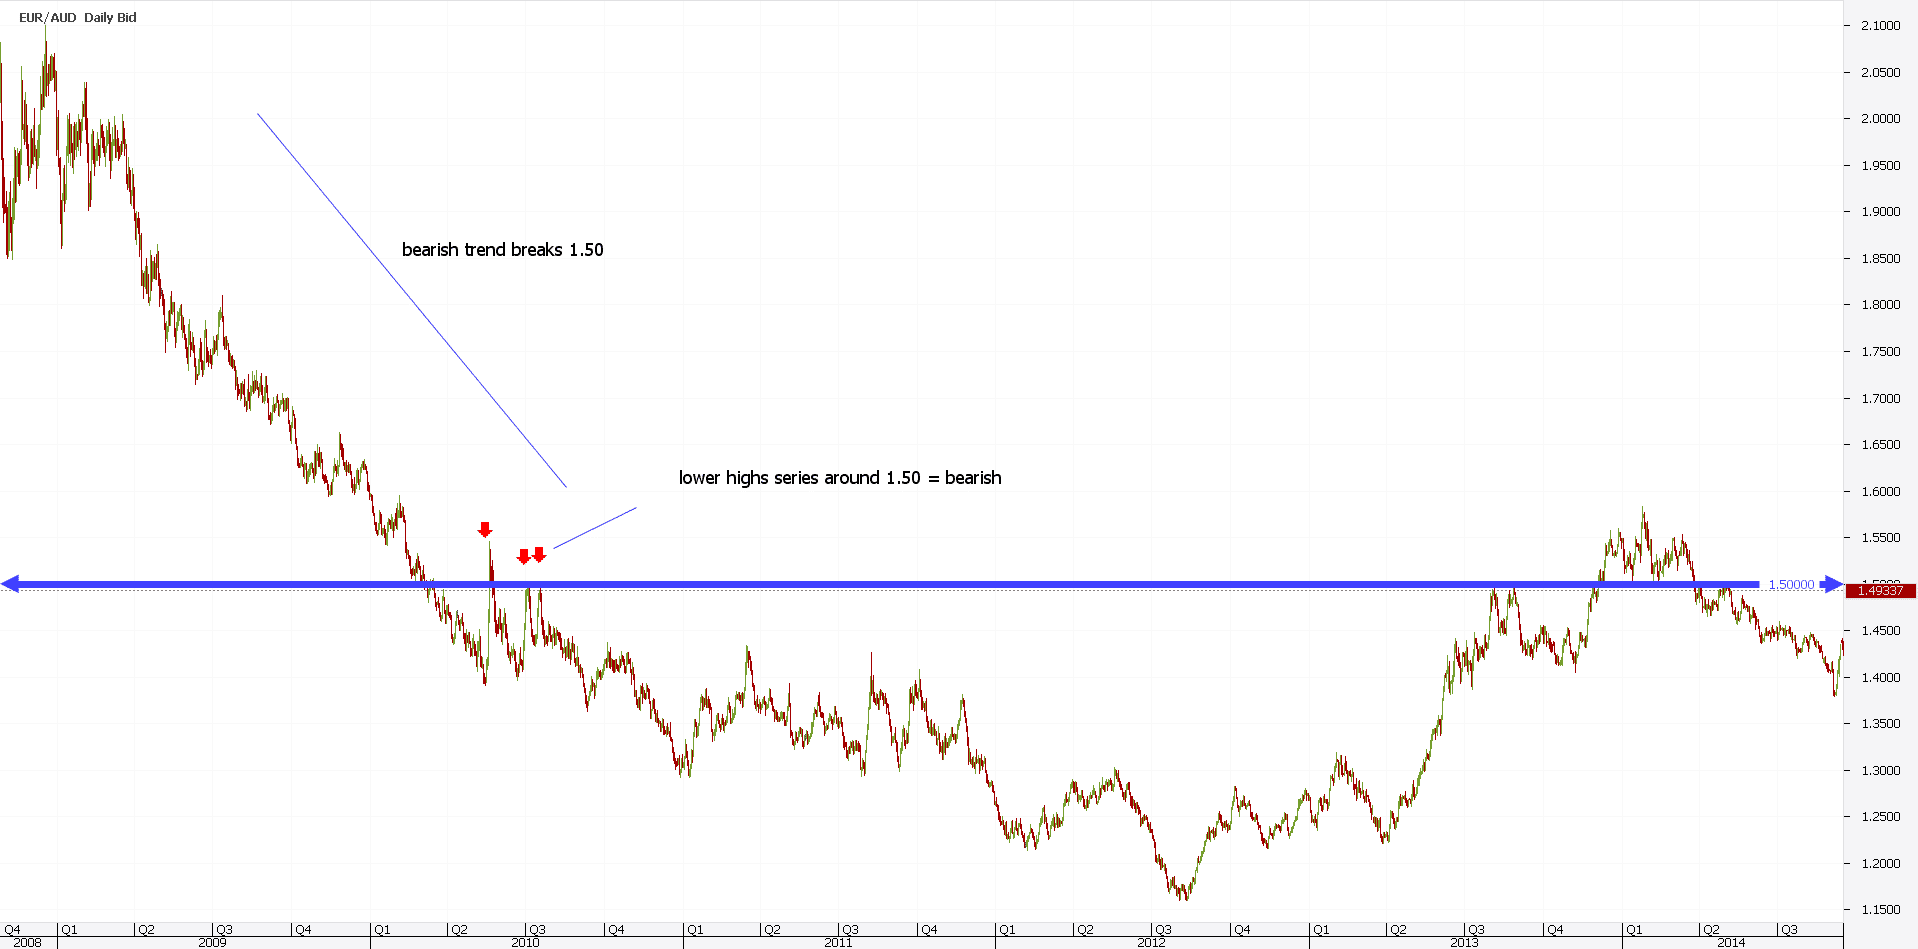
The blue line above shows the 1.50 level on the EURAUD cross. This is one cross that travels a lot.
Therefore, deviations from a static point (like a round number) are bigger. In plain English, price swings aggressively on nothing at all.
The Forex price action was bearish. A strong downtrend saw the pair breaking the 1.50 in early 2010.
Keep in mind this is the daily chart. So, don’t use it for Forex price action scalping. It simply won’t work.
However, it suits swing trading. And even investing using a price action trading strategy.
From the moment the psychological round number broke, price action around it tells everything about future prices. As such, support turned into resistance.
Moreover, part of price action trading, a series of three lower-highs forms around it. That’s bearish.
Bearish means selling the pair. It will further fall. So, it did.
But, eventually, it lost momentum. And turned back to the 1.50.
Yet, the Forex price action left some traces. Here’s how versatile traders use them.
Price Action Technical Patterns to Use
Moving forward with the EURAUD example, price action was still bearish. It reached below 1.20.
But, soon after, a reversal pattern formed. A head and shoulders.
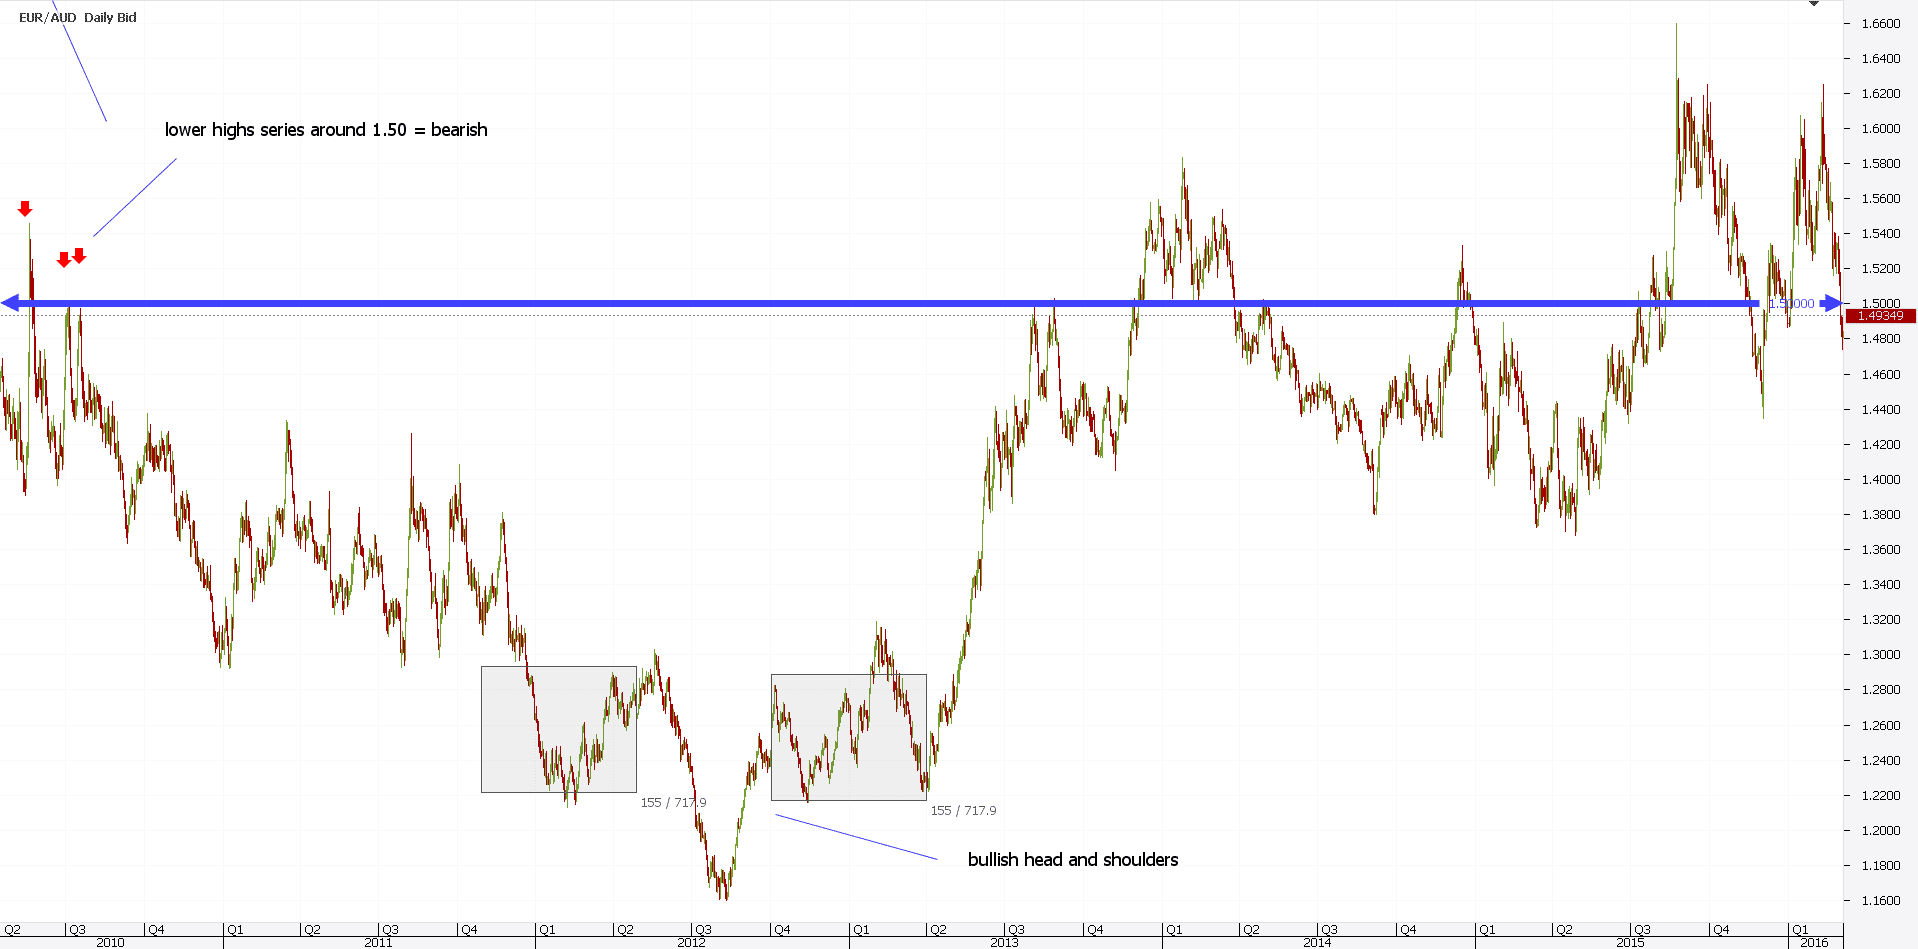
While not marked on the chart above, a bearish symmetrical triangle formed prior. That’s why the price fell further.
Coming back to the head and shoulders pattern, price action trading should focus on the long side now. What’s the target?
You guessed…the 1.50 round number. But, how to trade the setup?
Any price action Forex trading strategy must consider the time frame. That’s what gives the risk-reward part of any money management system.
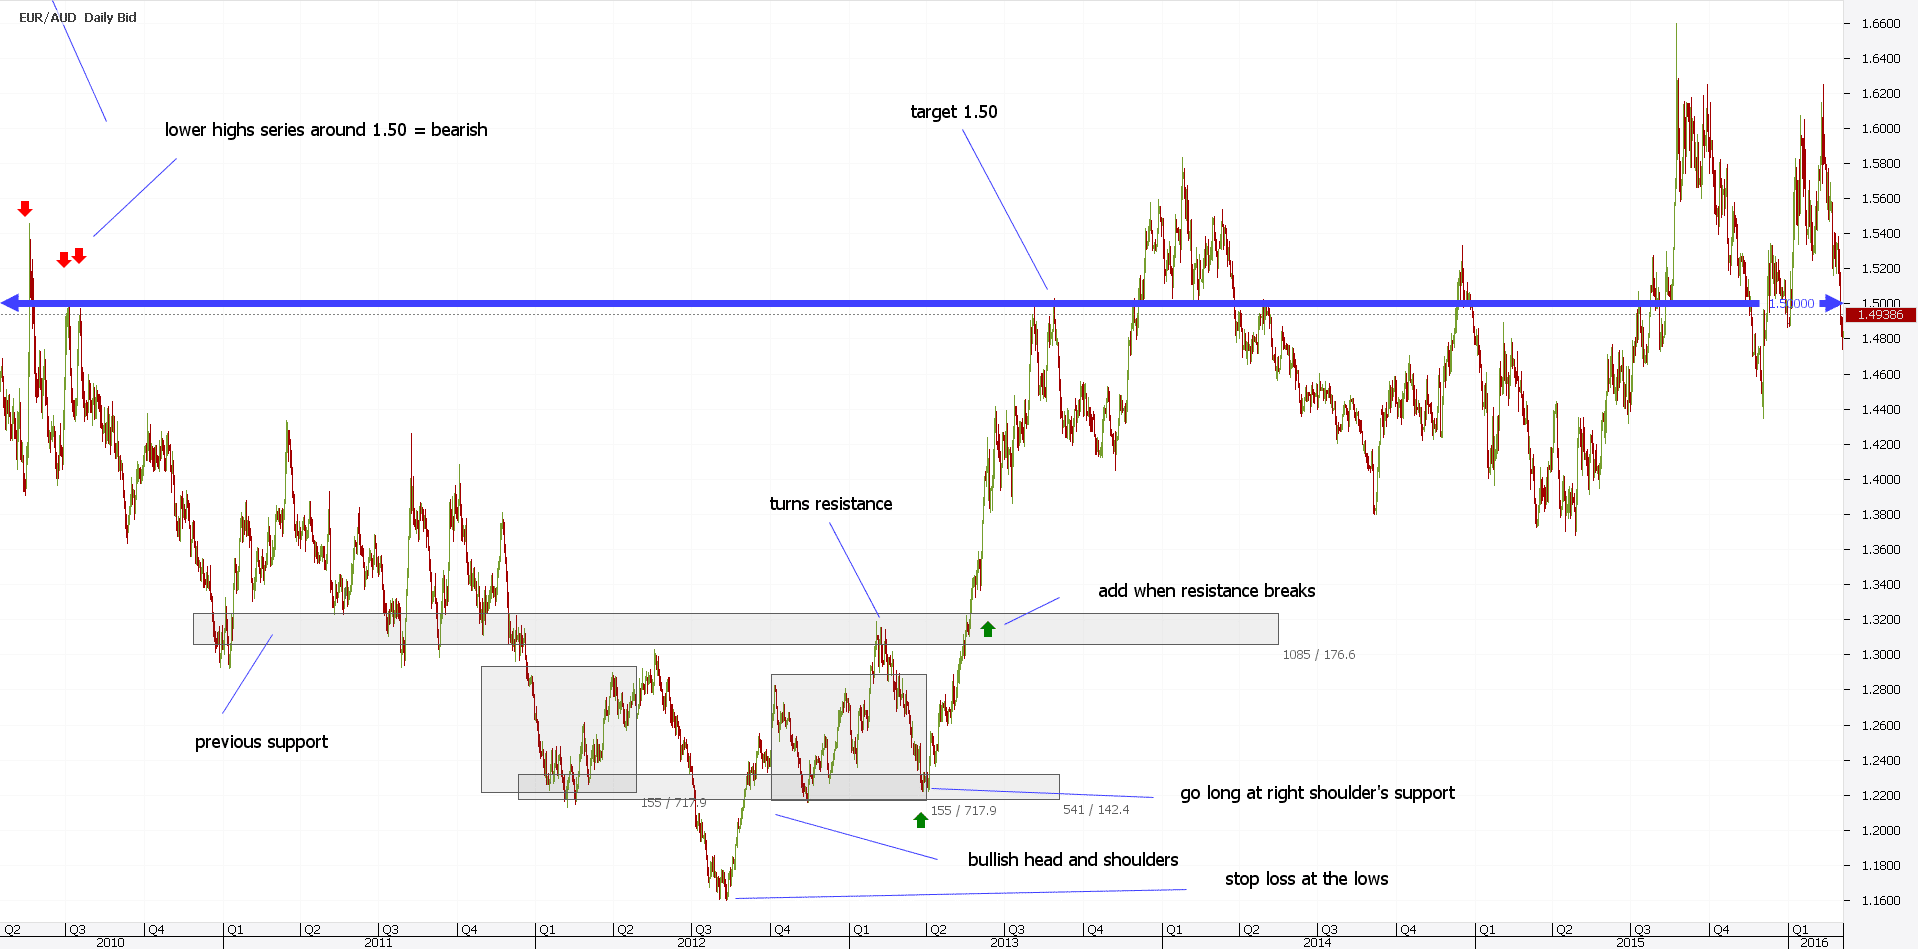
A head and shoulders pattern gives great trades. That is if you use the right shoulder.
Remember one of the previous statements? Information on the left side of the chart is free information.
Same here. The left shoulder offers free information for trading the right one.
The price action trading strategy to go long is to buy on the right shoulder’s support. Price action sends the market there.
That is after it rejected it from previous symmetrical triangle’s resistance. A perfect entry for the perfect trade.
A proper stop loss must be at the lows. And, a proper price action Forex strategy needs a good risk-reward ratio.
If you compare the risk (the stop loss level) and the take profit (the 1.50 round number), you have that ratio. But, if the price hesitated once on the previous support turned resistance, why not add when resistance breaks?
It turned out that the price never looked back. After all, what is price action trading if not waiting for the market to break levels? So, it did.
Price Action Scalping
What followed next, is part of any price action course. While the examples are still on the daily time frame, one can use them on lower ones too.
That is if an important level forms. Let’s analyze the chart below from a price action trading point of view.
Keep in mind the following: anything that suggests price continuation or reversal is part of price action.
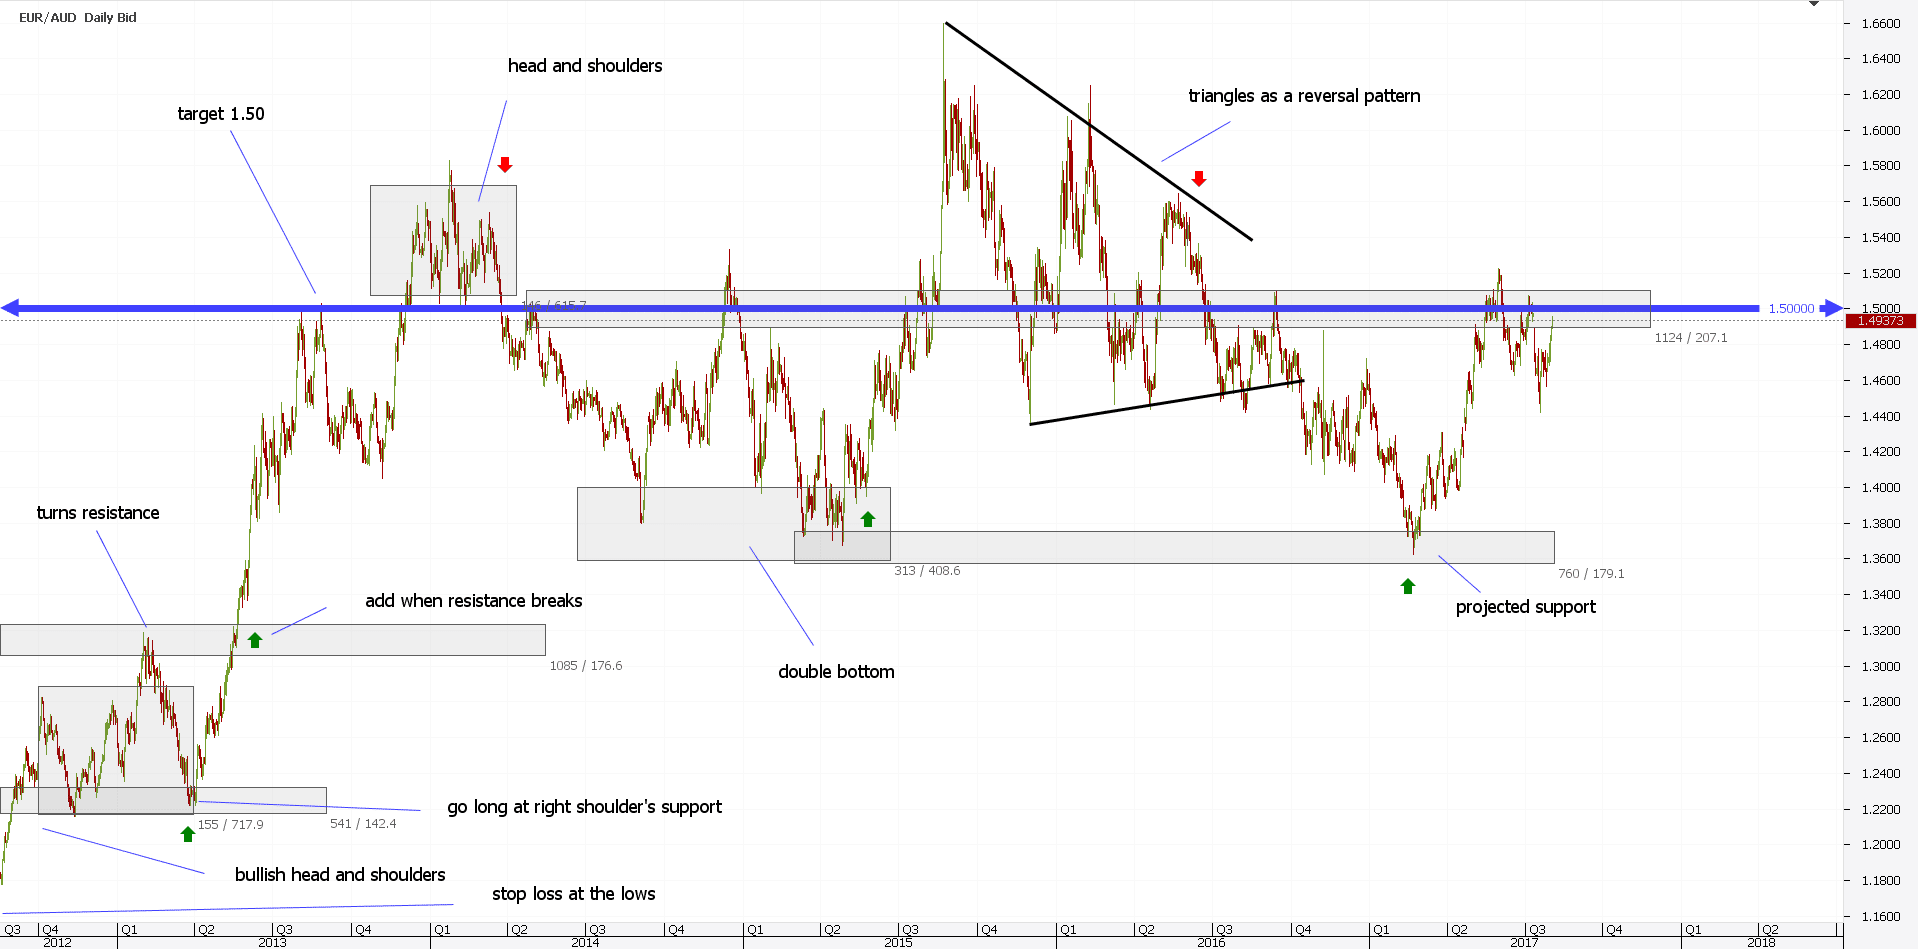
After 1.50 came, the market formed another head and shoulders pattern. A bearish one this time.
Then, a double bottom with the middle point right to the 1.50 line. A price action trading strategy buys the second dip for the measured move.
The first leg of the reversal triangle completes the measured move. Then, the triangle breaks lower.
But, the price can’t break previous support from the double bottom. As such, bulls stepped in and sent the price back to 1.50.
In other words, look at reversal patterns in any Forex price action analysis. Or, continuation ones.
As such, you’ll end up staying on the right side of the market.
High-Frequency Trading Part of Today’s Price Action
Trading as we know it today differs than the one a few years back. Technological progress changed the way markets moved.
Especially the Forex market. Over eighty percent of the trades are automated now.
That’s right. Only twenty percent or so is manual trading.
The rest belongs to EA’s (Expert Advisors), quants, trading algorithms, and so on. The high-frequency trading industry changed the way the markets move.
And, it changed the patterns too. A double top or bottom today differs from one a couple of decades ago. And so on.
On top of that, news trading changed patterns. Or, automated news trading.
The sharp reactions you see around news releases influence price action trading too. Yet, they’re part of today’s price action.
In the end, they’ll fit into a pattern. But, traders need to be cautious.
One way to deal with this is to stick on the bigger time frames. That’s one reason why we used the daily time frame on the EURAUD example.
As such, traders will filter the day to day noise. Check that EURAUD analysis, and you’ll see it stretches for quite some time.
Imagine, how many NFP’s (Non-Farm Payroll), or ECB meetings and press conferences took place in the meantime? Yet, the price action trading strategy worked.
Like it or not, technical analysis works. The sooner traders understand this, the better.
But, trading changed and it will keep changing. Technical analysis will, too. And Forex price action as well.
How to Spot Algorithmic Price Action Trading
Forex trading is a dog-eat-dog world. I try to screw you, you try to screw me. No hard feelings.
Robots, or trading algorithms, influence price action trading. As such, a price action EA (expert advisor) is programmed to trip stops.
Retail traders fall for such traps most of the times. Check the AUDUSD chart below.
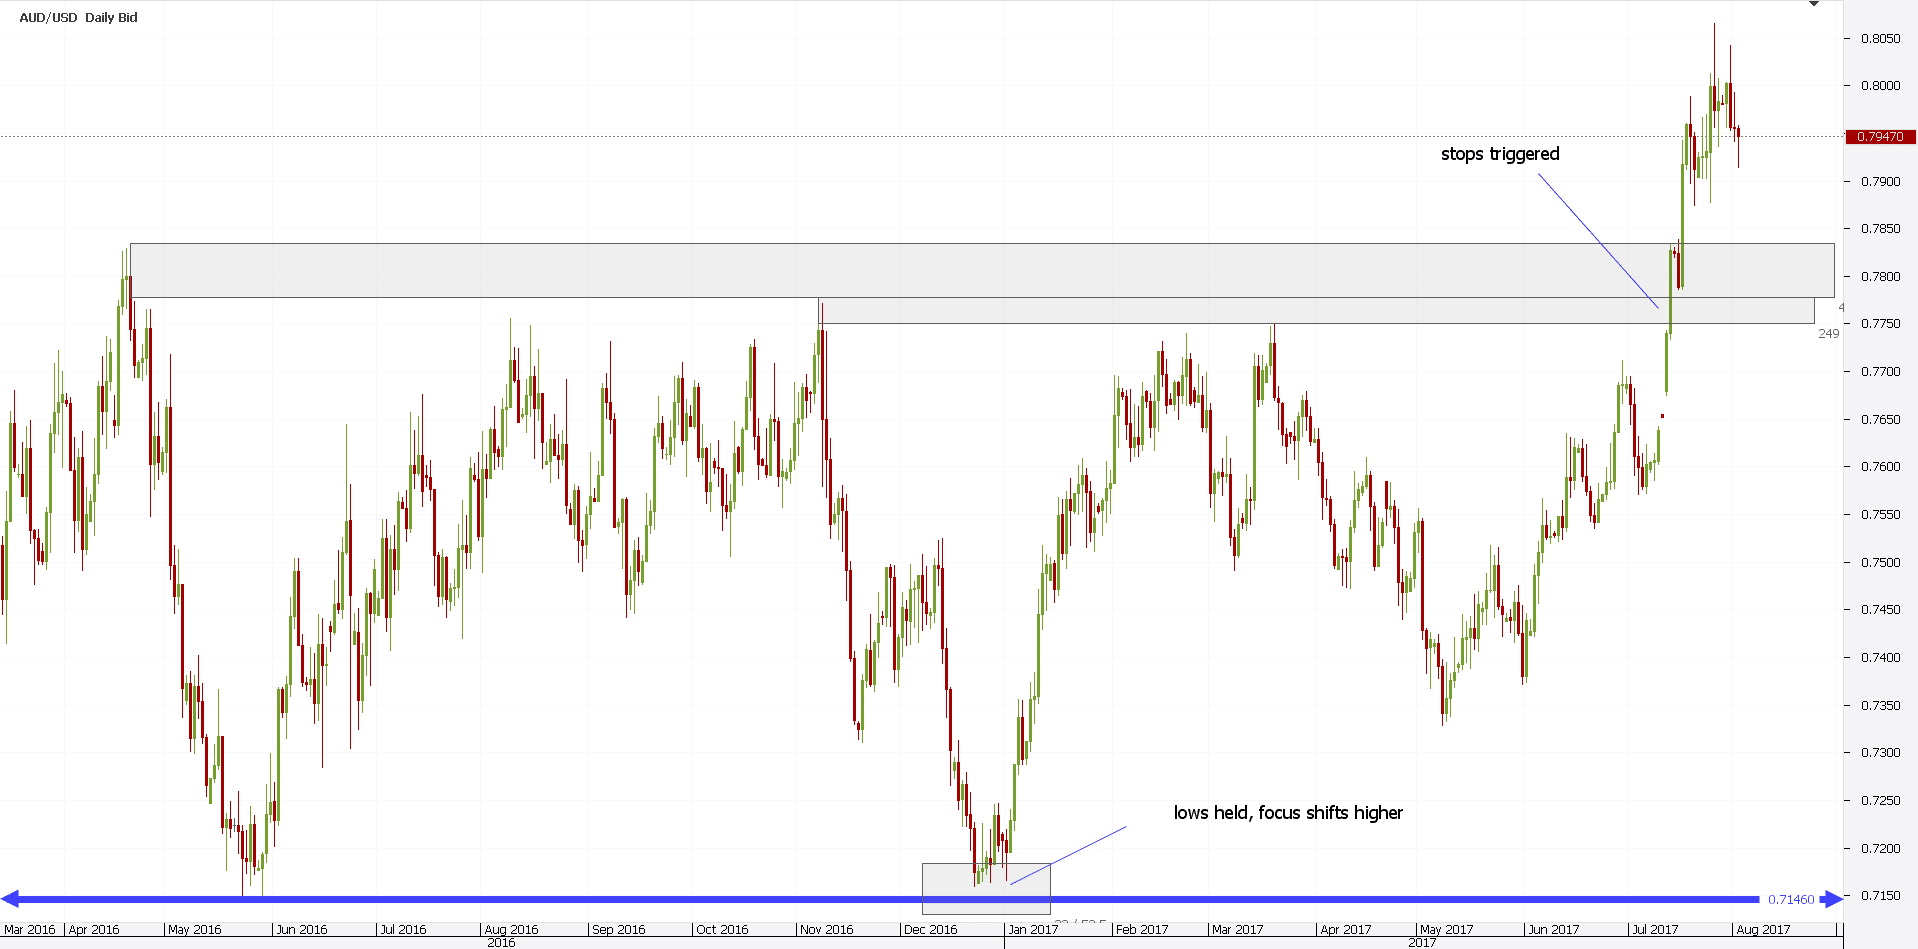
For a couple of years, the pair struggled on the daily chart. Yet, 2017 started with a strong bullish move.
But, before that move, we noticed that the previous lows held. That’s bullish Forex price action.
Moreover, it tried for the previous highs. It failed, retraced a bit, and then tried again.
Basically, it only built energy to break higher. Slowly but surely, price grinds higher, preparing to trip stops.
That’s not retail trading. That’s algo trading.
If you add to this the round 0.80 level was just above the previous highs…you have the overall price action trading strategy for the pair.
Conclusion
All traders know that a “trend is your friend”. That’s true until it isn’t anymore. Or, correlations work like magic. That’s, again, true. Until they simply break.
Trading price action trends is not easy, for a simple reason. You must know when the trend ends.
Therefore, classical price action reversal patterns help. In fact, Forex price action can do three things: trend higher, lower, or chop around an important level.
You should not be surprised to see the Forex market ranging most of the times. That is, because trading algorithms also trade on news. Not only on price action.
This article showed you how to determine which of the three possibilities the market forms. And, the price action trading strategies to use.
Unfortunately, there’s no price action indicator offered by the mt4 platform. At least, not a single one.
The sum of the technical analysis patterns forms price action. Yet, technology is about to change this too.
Some trading platforms started to incorporate automatic recognizable patterns. Rising or falling wedges, triangles, and so on…everything we discussed here, will automatically be plotted on a screen.
While this is great from a Forex price action point of view, it will change the way high-frequency trading will react. Remember? This is a dog-eat-dog world.
And, usually, retail traders lose money.
However, if you are armed with the right knowledge and understanding about price action, you’ll have a chance to survive. Price action trading works in all markets, not only on Forex.
Yet, retail traders mostly use currencies to speculate with. Hence, Forex price action deserves a special place in today’s technical analysis.
START LEARNING FOREX TODAY!
- Chart patterns
- Forex channel
- FOREX Strategy
- Forex trend
- Price Action
- Support and Resistance trading
- trading strategy
share This:


Leave a Reply