Yet another Japanese concept, the Heikin Ashi candles provide a great setup in both swing trading and Forex scalping.
When the Western technical analysis world met the Japanese approach, it was stunned to find out the simplicity and the power of the Japanese candlesticks.
As it turned out, the Japanese traders used candlesticks patterns to forecast rice futures in the 1700’s, way before the stock market concept in the United States was even born.
Today’s retail Forex traders use more technical concepts coming from the Japanese approach. Relevant ones are:
- Ichimoku Kynko Hyo indicator
- Morning and evening stars
- Doji candles
- Candlesticks chart
- Bullish and bearish engulfing
- Dark-cloud covers and piercings
- Hammers and shooting stars
On top of that, the Heikin Ashi candles come to complete the Japanese approach to technical analysis. Useful both in swing trading and Forex scalping, they represent an alternative to the classic types of charts offered by any brokerage house.
In this article we’ll cover the Heikin Ashi candles as a Forex scalping indicator. More precisely, we’ll have a look at:
- what is Forex scalping
- how to do scalping in Forex
- how to build a Heikin Ashi candles chart
- The best scalping Forex strategy using Heikin Ashi candles
- The difference between Forex scalping and other trading styles
- How to read Heikin candles
- Understanding Forex trend candles on short-term timeframes
Above all, this article aims at providing an understanding of both Heikin Ashi candles and Forex scalping. The Forex scalping strategies presented here blend the two concepts to give powerful trading setups.
At the end of it, you’ll find out that Heikin Ashi candles come to complete the Japanese approach to technical analysis.
Understanding Forex Heikin Ashi Candles
A rough translation from Japanese quickly tells us that Heikin stands for “average” and Ashi for “pace.” Hence, average pace is what a Heikin Ashi candles chart shows.
Obviously, the average pace of prices.
The main Japanese contribution to technical analysis came with the introduction of the candlesticks chart. Up to the candlesticks charts, the Western world use bars chart.
The difference between the two comes from visibility. You guessed candlesticks are visible, their real body tells a story, and the shadows too.
Heikin Ashi comes as an integrated indicator in the MT4 platform. However, it doesn’t appear on the regular indicators tab.
Instead, the MT4 trading platform offers it as a custom indicator. In fact, it is such an indicator as it builds unique Forex candles.
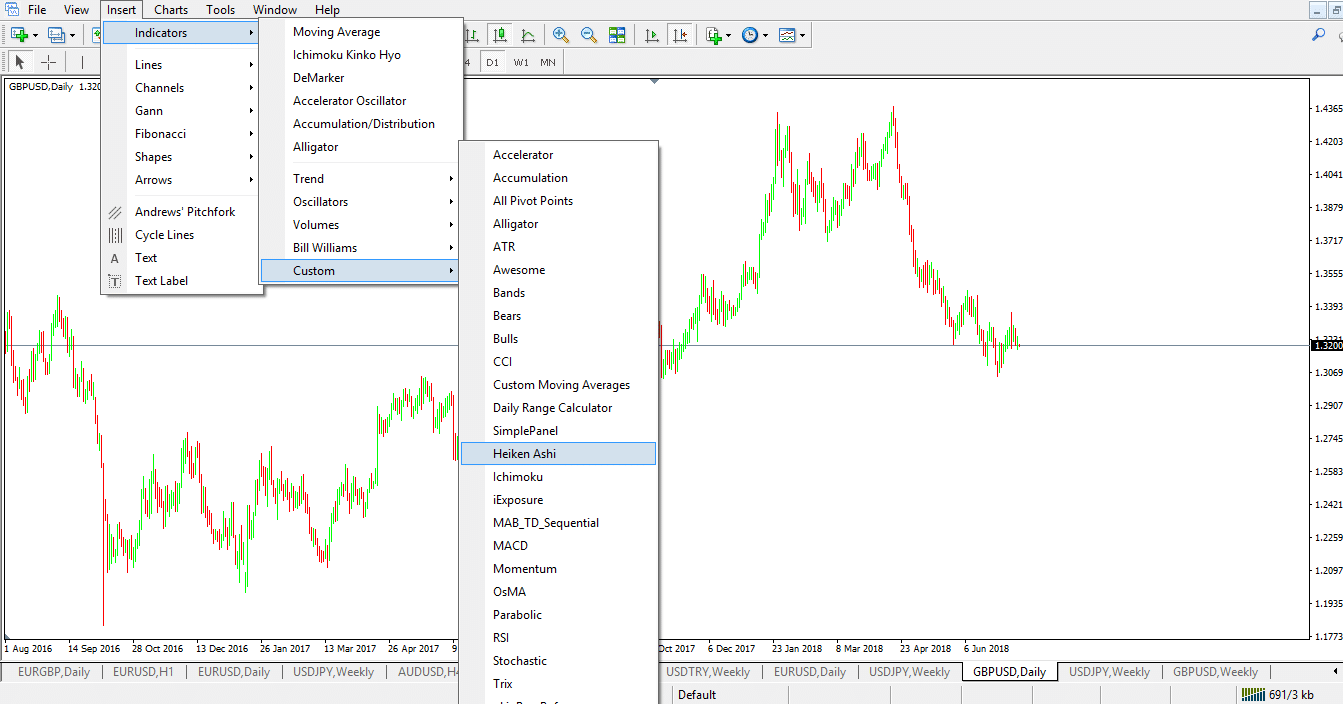
Once applied on a chart, it’ll radically transform it. Hence, before jumping into any Forex trading strategy with Heikin Ashi candles, we must understand how to build the chart.
Building a Heikin Ashi Candles Chart
A proper understanding of a Heikin Ashi candles chart starts with comparing the two. Moreover, the comparison must consider the same currency pair and chart.
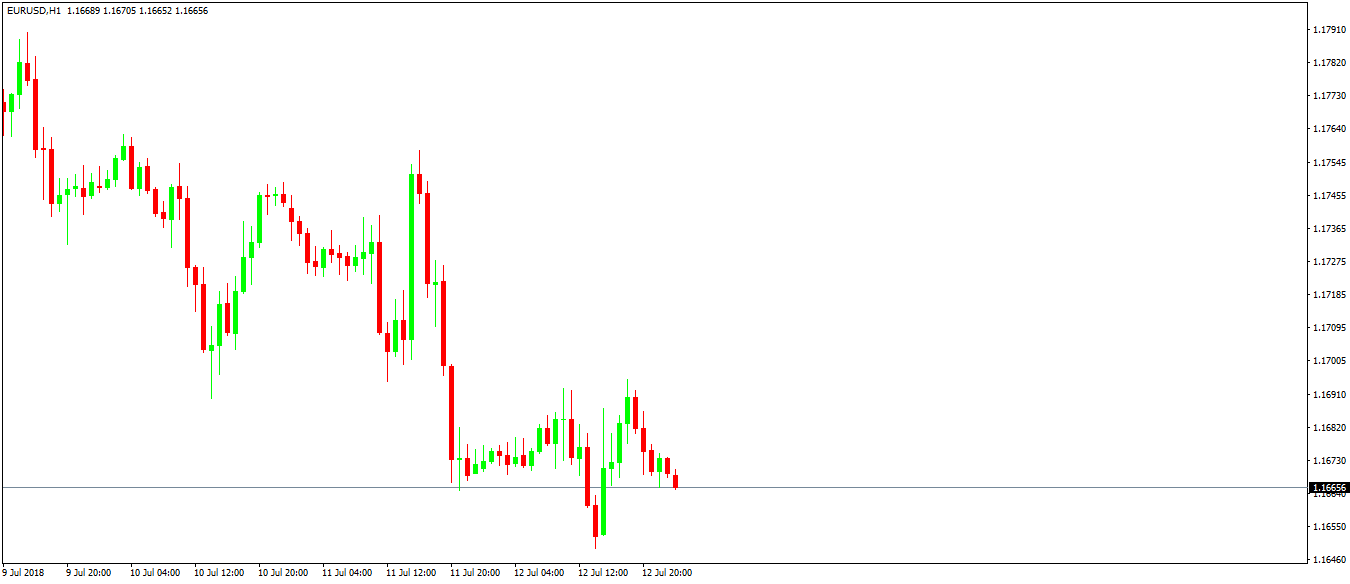
This is the EURUSD hourly chart. It shows candlesticks with green or red real bodies. And, various upper or lower shadows.
In a candlesticks chart, the following play a key role:
- opening price
- closing price
- the high
- the low
Armed with this info, traders build a Heikin Ashi candles chart. Using the formula, we’ll reveal later, the EURUSD chart transforms as below:
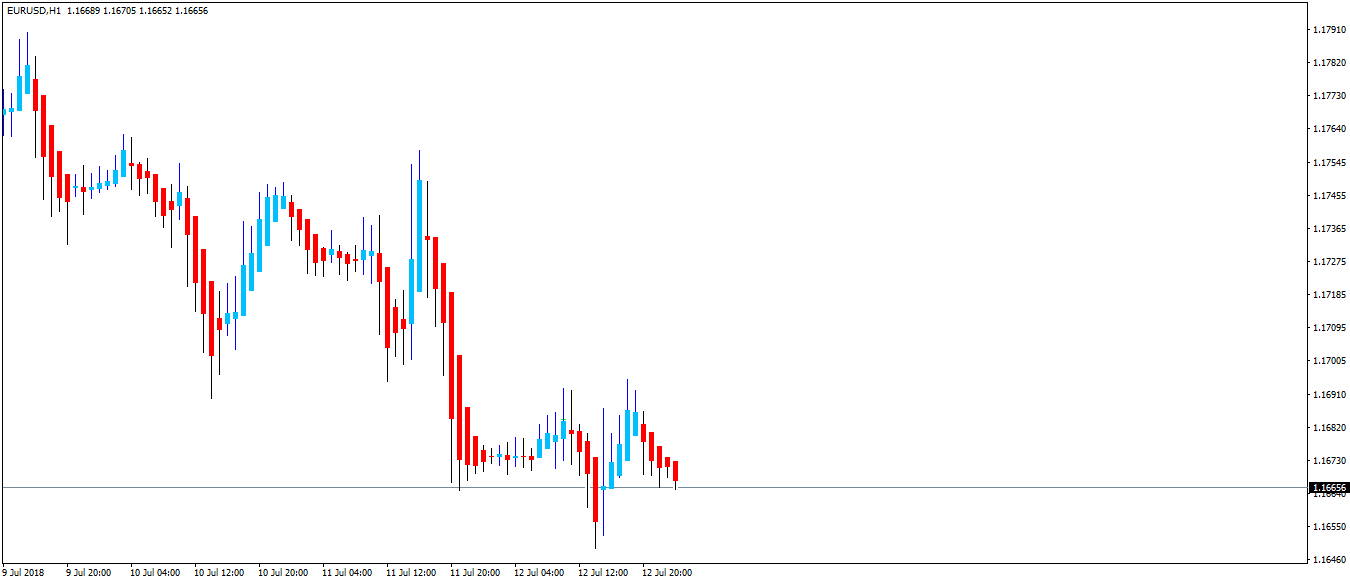
A quick comparison between the two charts won’t tell much. However, candles differ.
Moreover, their colors have continuity. In this case, we used the color blue for bullish and red for bearish conditions.
These is the color setting used so that we avoid any unwanted elements from the original candlesticks chart.
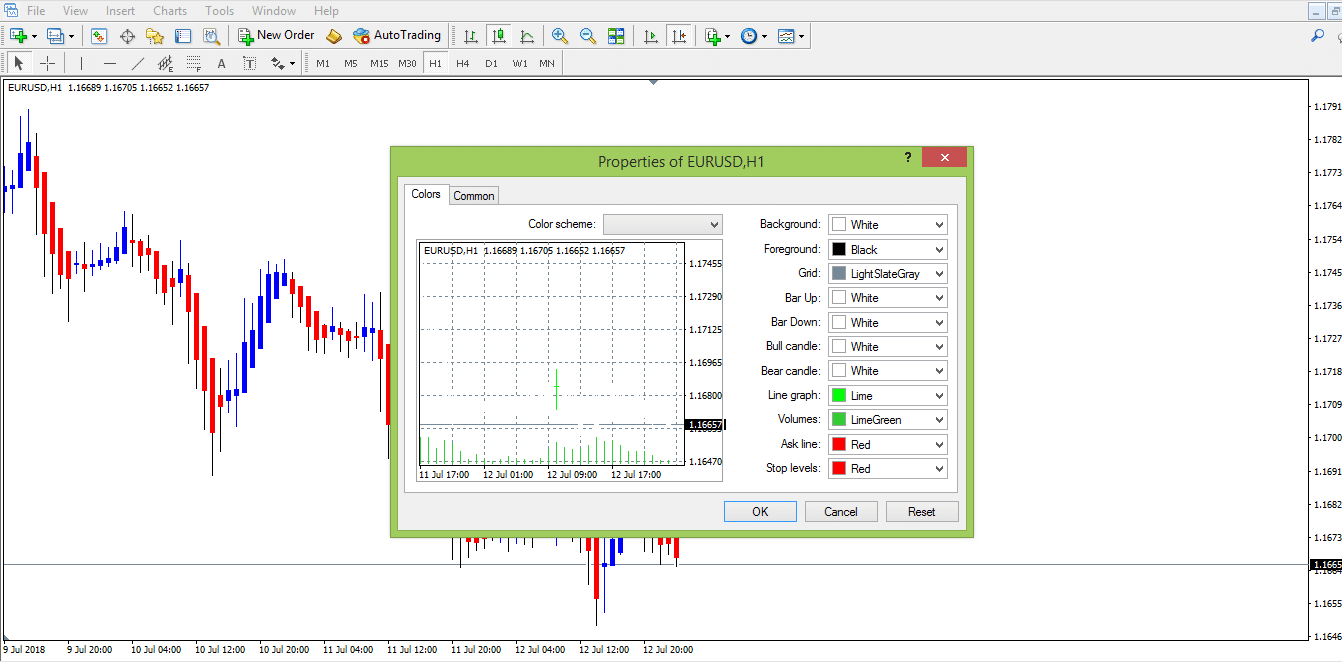
For a full visibility of the Heikin Ashi indicator, all bars in the MT4 setup have the white color enabled. Furthermore, the background is white too, revealing the Heikin Ashi candles in all their power.
Heikin Ashi Candlesticks Calculation
Obviously, there’s a formula behind the “average pace” prices shown by such a chart. And, it is quite an interesting one.
This Japanese approach to represent prices uses the key elements of a candlesticks chart as we described earlier. Here they are again:
- opening price
- closing price
- the high
- the low
A Heikin Ashi candle’s calculation needs info from both the current and past candles. Moreover, it needs info from both the regular candlestick provided by the Japanese candlesticks chart and the previous Heikin Ashi candle.
Calculating the Heikin Ashi Close
The first step is to calculate the Heikin Ashi close. That’s easy. Just average the four prices of the current period.
More precisely, add them all (open, close, high and low) and divide them by four.
Calculating the Heikin Ashi Open
For the Heikin Ashi open, we need another average. Only this time, the average considers only two elements: the prior Heikin Ashi open and close.
This way, the entire chart starts making sense, as each candle depends on the previous one.
Calculating the Heikin Ashi High
That’s an interesting value to find out. More exactly, the Heikin Ashi high is the maximum value of three points. Namely, the indicator compares the following and picks the highest value of them all:
- the current candlestick’s high
- Heikin Ashi open for the current candlestick
- Heikin Ashi close for the current candlestick
Calculating the Heikin Ashi Low
Apparently, the Heikin Ashi low is the minimum between:
- the current candlestick’s low
- Heikin Ashi open for the current candlestick
- Heikin Ashi close for the current candlestick
By this time, the Heikin Ashi candles chart starts making sense. Traders find great value in using this Forex indicator as the method used is nothing but unique.
Forex Scalping with Heikin Ashi Candles
The net effect that the Heikin Ashi indicator has on a chart is that it makes it uniform. For this reason, the Heikin Ashi candles work great in short-term trading. Or, Forex scalping.
Forex scalping is the preferred way the retail traders use to approach the market. Leaving the HFT (High-Frequency Trading) industry aside, Forex scalping is mostly done by retail traders.
Scalpers buy or sell a currency pair multiple times a day. Typically, scalpers don’t keep positions open overnight. Hence, they don’t need to worry over the possible negative swaps a currency pair charges for holding a trade open more than a day.
When compared with swing traders, scalpers are very short-term oriented traders. A trade may take a few seconds or minutes, and rarely lasts hours.
On the other hand, swing traders keep trades open for more extended periods. It may be that a trade remains open for a few hours, but also a few weeks.
The last trading style, investing, belongs mostly to fundamental traders. They interpret economic data in the long run and bet on the changes that will take place on the macro level. For investors, time is not an issue.
Coming back to Forex scalping, traders use the lowest timeframes possible. Namely:
- one-minute
- five-minute
- fifteen-minute
- thirty-minute
- hourly
note, though, that the hourly chart is there only to show the maximum timeframe for this trading style. Otherwise, scalpers rarely use it. Instead, the focus sits with the lower timeframes.
Forex Scalping Strategies with the Heikin Ashi Candles
The strategies explained here belong to Forex scalping and work on all the timeframes mentioned above.
One of the easiest ways to use Heikin Ashi candles is to take advantage of the chart’s uniformity. More precisely, just focus on the colors.
However, the primary task a trader has is to define what he/she want’s to do:
- follow a trend
- spot a reversal
Trends do form on the lower timeframes too. In fact, trend trading on lower timeframes makes sense as the Forex market consolidates most of the times on the bigger ones.
Forex Scalping Trend Trading with Heikin Ashi Candles
Trend trading is every retail trader’s dream. Studies show that this is the main reason why traders come to the Forex market. To ride a trend.
However, one issue with trend trading is that trends do not form that often. That is, on the bigger timeframes.
On the lower ones, mini-trends or micro-trends appear every day. Hence, traders can ride them easily, especially if they use the Heikin Ashi indicator to “filter” the noise.
Yes, that’s one of the main advantages of using the Heikin Ashi candlesticks: they filter the noise.
Besides identifying the Forex market candles as belonging to bullish and bearish trends, the Heikin Ashi chart shows the direction clearly. However, traders still need to do one thing: to define the trend.
For this, the rules of a trend apply:
- wait for a series of lower lows and lower highs for a bearish trend
- wait for a series of higher highs and higher lows for a bullish trend
Forex Scalping When Heikin Ashi Changes Colors
Keep in mind this is a trend trading Forex scalping technique. As such, trading always takes place in the direction of the underlying trend.
Therefore, the first thing to do is to define the trend. Using the rules mentioned a couple of paragraphs above, here’s a bearish trend on the current EURUSD five-minute chart:
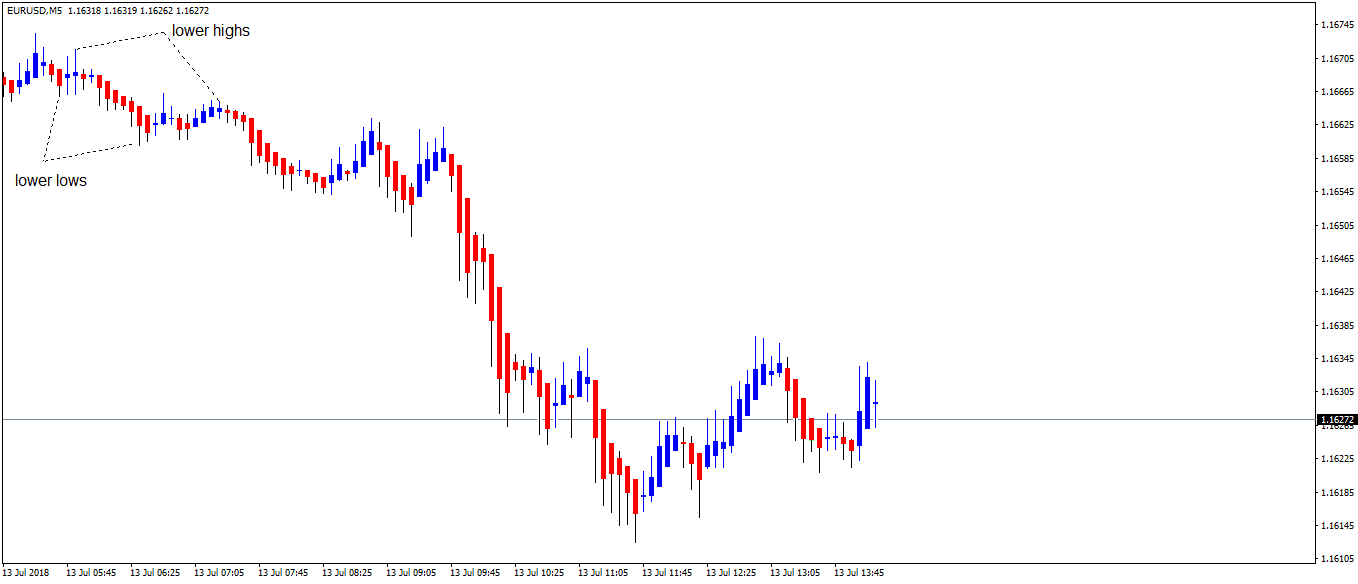
The lower highs and lower lows series is enough for telling us a bearish trend is in place. Hence, traders involved in Forex scalping will consider only selling signals.
As the name of this paragraph suggests, the entry on the short side is when the Heikin Ashi candles change from blue to red. Or, when the bearish trend resumes.
In Forex trading, money management is more important than the trading strategy. For this reason, the focus should always be on using a risk-reward ratio as big as possible.
Appropriate ones when trading Forex are ratios bigger than two or close to three. More precisely, for every pip risked, traders end up gaining two or three pips. Not bad for a trade, is it?
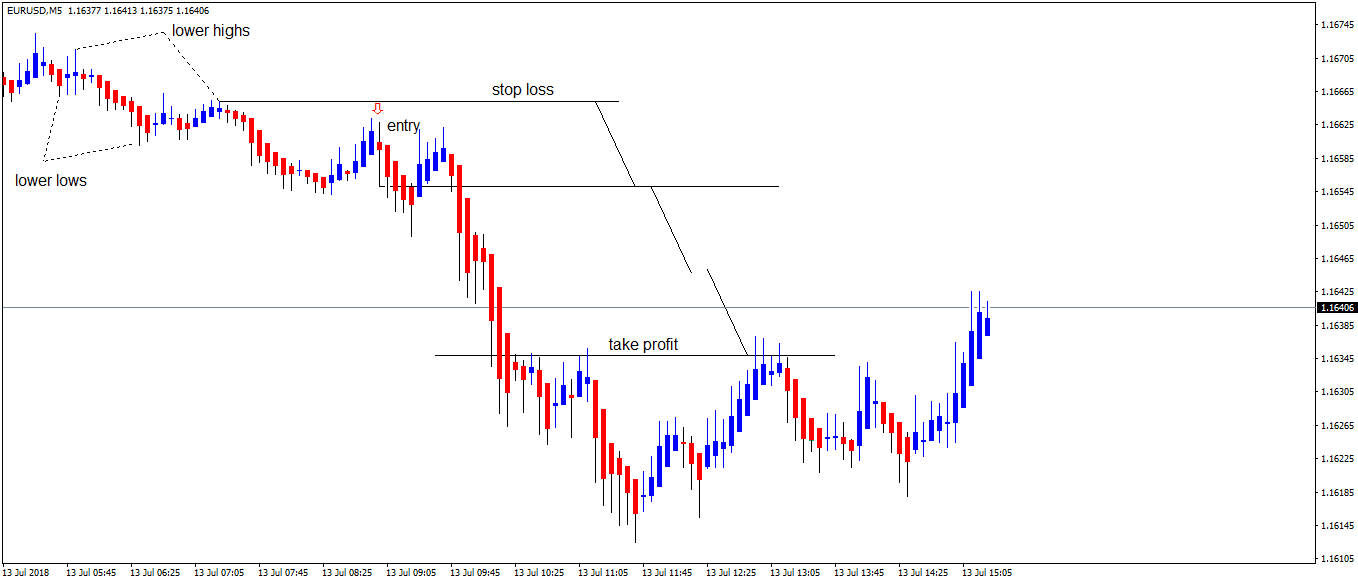
With everything described above in mind, here’s the first entry using the Heikin Ahi chart as a trend indicator. When the first candle after the series of lower highs turned to read, or bearish, traders enter on the short side.
The stop loss is the tricky part due to the fact that the Heikin Ashi indicator “hides” the shadows of the actual candlesticks. Or, more precisely, some of them.
For this reason, placing a stop loss at the high of the entry candle isn’t recommended. Instead, traders use the previous swing’s highest point to set the stop loss.
That’s the risk defined. Next, traders project the risk to find out the minimum risk-reward ratio to use.
Adding to a Forex Scalping Position
We explained earlier that Forex scalping means taking multiple positions during the course of the trading day. To do that, traders look at different currency pairs and follow the same trend trading strategy.
Or, they add to the original position. Adding increases the exposure on any one timeframe and currency pair.
Some say that in this way the risk increases too. Well, that’s incorrect!
As long as the money management rules still exist, traders avoid overtrading.
In this case, the same rules apply to every individual trade. Namely:
- traders go short on every red candle after a blue candles’ correction
- place the stop loss at the highest point of the previous swing (previous lower high on the Heiken Ashi candles chart)
- use a risk-reward ratio of 1:2 or 1:3 for the exit.
Conservative traders immediately move the stop loss to break-even by the time the price reaches the 1:1 level in the defined risk-reward ratio.
This way, scalpers control the risk aggressively and even trail the stop to avoid losing even one single pip.
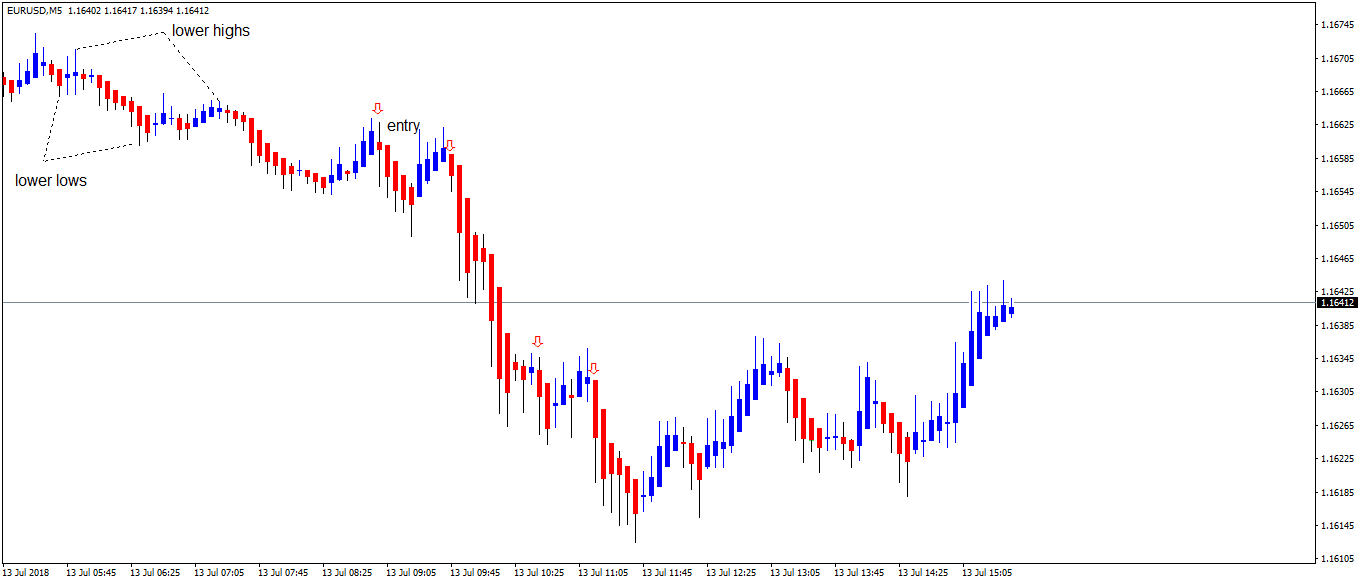
Here are three other examples of short trades part of the same Forex scalping strategy. Eventually, one of them will be stopped.
That’s the signal that the bearish trend ended. The argument for that comes from the price that had the power of breaking the lower lows series.
Or, if it does that, the rules of a bearish trend aren’t in place anymore. Hence, the trend trading Forex scalping strategy ends with the first trade that gets to be stopped.
Forex Scalping – Trend Reversals with Heikin Ashi Candles
Another way to do Forex scalping using the Heikin Ashi candles is to spot reversals. Despite the conventional wisdom, a trend reversal is not that obvious as trend continuation with this indicator.
Here’s why!
Because the way the Heikin Ashi candles appear on the chart, classic Japanese reversal patterns won’t work. We listed the most relevant ones at the start of this article.
Instead, the candles projected by the Heikin Ashi indicator look alike. Or, almost alike.
There is one reversal pattern, though, that works with the Heikin Ashi charts too. The Doji pattern.
We’ve treated the mystery of the Doji candle in some other articles here on our blog. Now would be a perfect time to check the concept.
As a reminder, a Doji candle has a small real body, almost invisible. Effectively, the perfect Doji candle has the same opening and closing prices.
This is difficult in today’s Forex market due to the nature of it. Nowadays the Forex brokers use five-digit quotations for most of the pairs part of the Forex dashboard.
Hence, for a candle to get the exact closing price like the opening one is unlikely. Therefore, traders adapted the concept and used instead candlesticks with a small real body. That’s key in spotting reversals on the short-term timeframes using the Heikin Ashi candles.
Spot something unusual when trends reverse? The Heiken Ashi chart shows multiple Doji candles in the same are.
To scalp on the signals, traders wait for the price to reverse beyond the highest or the lowest Doji candle’s value (depending on the trend). Next, they enter short or long. Finally, they set the take profit at a distance equal to three times the risk (stop at the top or bottom).
Conclusion
Forex scalping with Heikin Ashi candles provides an excellent opportunity to profit from the market swings. By using lower timeframes, traders take advantage of all market moves.
However, Forex scalping has the disadvantage of being a time-consuming activity. Therefore, traders dedicate many trading hours in front of the screen to rip all the benefits of Forex scalping.
All classic technical analysis patterns are easy to spot on an Heikin Ashi chart. Triangles become apparent, flags as well, etc.
The indicator provides a clear picture of the overall market activity and traders use it more in trend trading strategies than in reversal ones.
It is only reasonable to do that. After all, the Heikin Ashi candles chart filters the noise in the Forex market and reveals the underlying trend, if any.
All in all, this is a great indicator to use together with sound money management rules. Risk-reward ratios of 1:2 or 1:3 are easy to spot and trade, and that will allow the trading account’s balance to grow.
Yet another Japanese concept was embraced by the Western world. And, for the right reason, as it provides excellent technical analysis setups.
START LEARNING FOREX TODAY!
- Chart patterns
- FOREX
- Forex Analysis
- Forex candlestick patterns
- Forex indicators
- FOREX Strategy
- Forex Technical Analysis
- FOREX trading
- Technical Analysis
- trading strategy
share This:


Leave a Reply