Any trading platform offers multiple indicators for analyzing a market. Either trend ones or oscillators, they help traders finding places to buy or sell. The Forex Stochastic oscillator is an accurate indicator for both scalping and swing trading. Moreover, the stochastic oscillator formula is simple and easy to use.
Trading is a game of probabilities. As long as traders understand there’s no magic formula that works one hundred percent of the times, profits will come. The idea is to find a proper way to make money with the winning trades. Of course, the bigger the winning rate, the better.
Risk management or money management plays an important role. Most of the times, traders face difficult decisions. In theory, it sounds very simple. Every trader knows he/she needs to cut losses asap. Or to let profits run. Everyone agrees with that. Yet, this is a difficult thing to put into practice. The stochastic oscillator comes to help with this decision.
As often is the case, retail traders end up losing money despite correctly reading the market. Greed and fear are the worse enemies. You may know where the market goes, but this doesn’t mean you’ll make a profit. Discipline and patience matter the most, while an indicator like the Forex stochastic one comes to help.
Its biggest advantage is visibility. Traders see any signals generated and have plenty of time to react. This is especially true if the time frame is big enough.
Another plus comes from its characteristics. It is essentially following the market. The currency pair makes a new high? Chances are, the stochastic oscillator Forex indicator does the same. If not, trading strategies derive from it.
What is Stochastic Oscillator?
First of all, being an oscillator, it appears at the bottom of a chart. Any oscillator appears in a separate window at the bottom of a chart. This tells much about its usability: to spot fake moves the price may make.
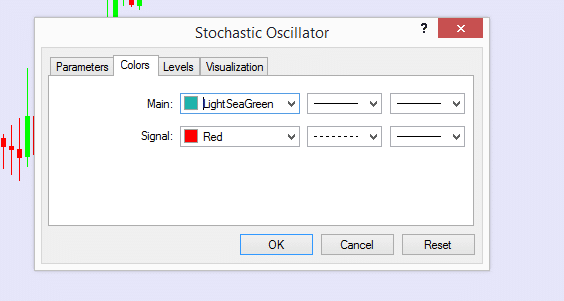
Second, it has two lines: the main and the signal line. They go hand in hand on that small window below the chart, and all eyes should be on these two lines. The signal one (the MetaTrader shows it with the red color) is a fast moving average, while the main one is a bit slower.
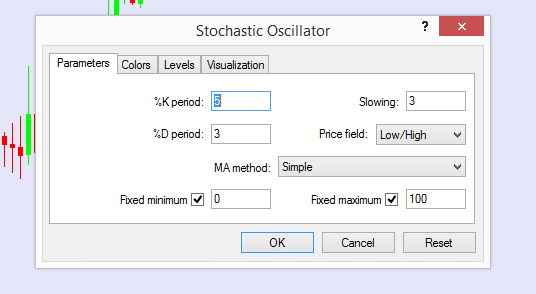
The default settings show the 5 and 3 periods for the two lines, with the fastest one having the smaller number. While the default scenario uses a simple moving average, any type works: exponential, smoothed, etc. All options work just fine.
George Lane, the guy who developed the stochastic indicator Forex traders use, was a smart guy. He wanted to have an indicator that measures the difference between the actual price and the price range over a period of time. And this is exactly what the stochastic oscillator calculation shows.
One thing is important here. The default settings are just default settings. By no means, one cannot change them. However, before doing that, keep in mind the two lines will flatten. This will make trading signals difficult, if not impossible to spot. Not to mention, irrelevant.
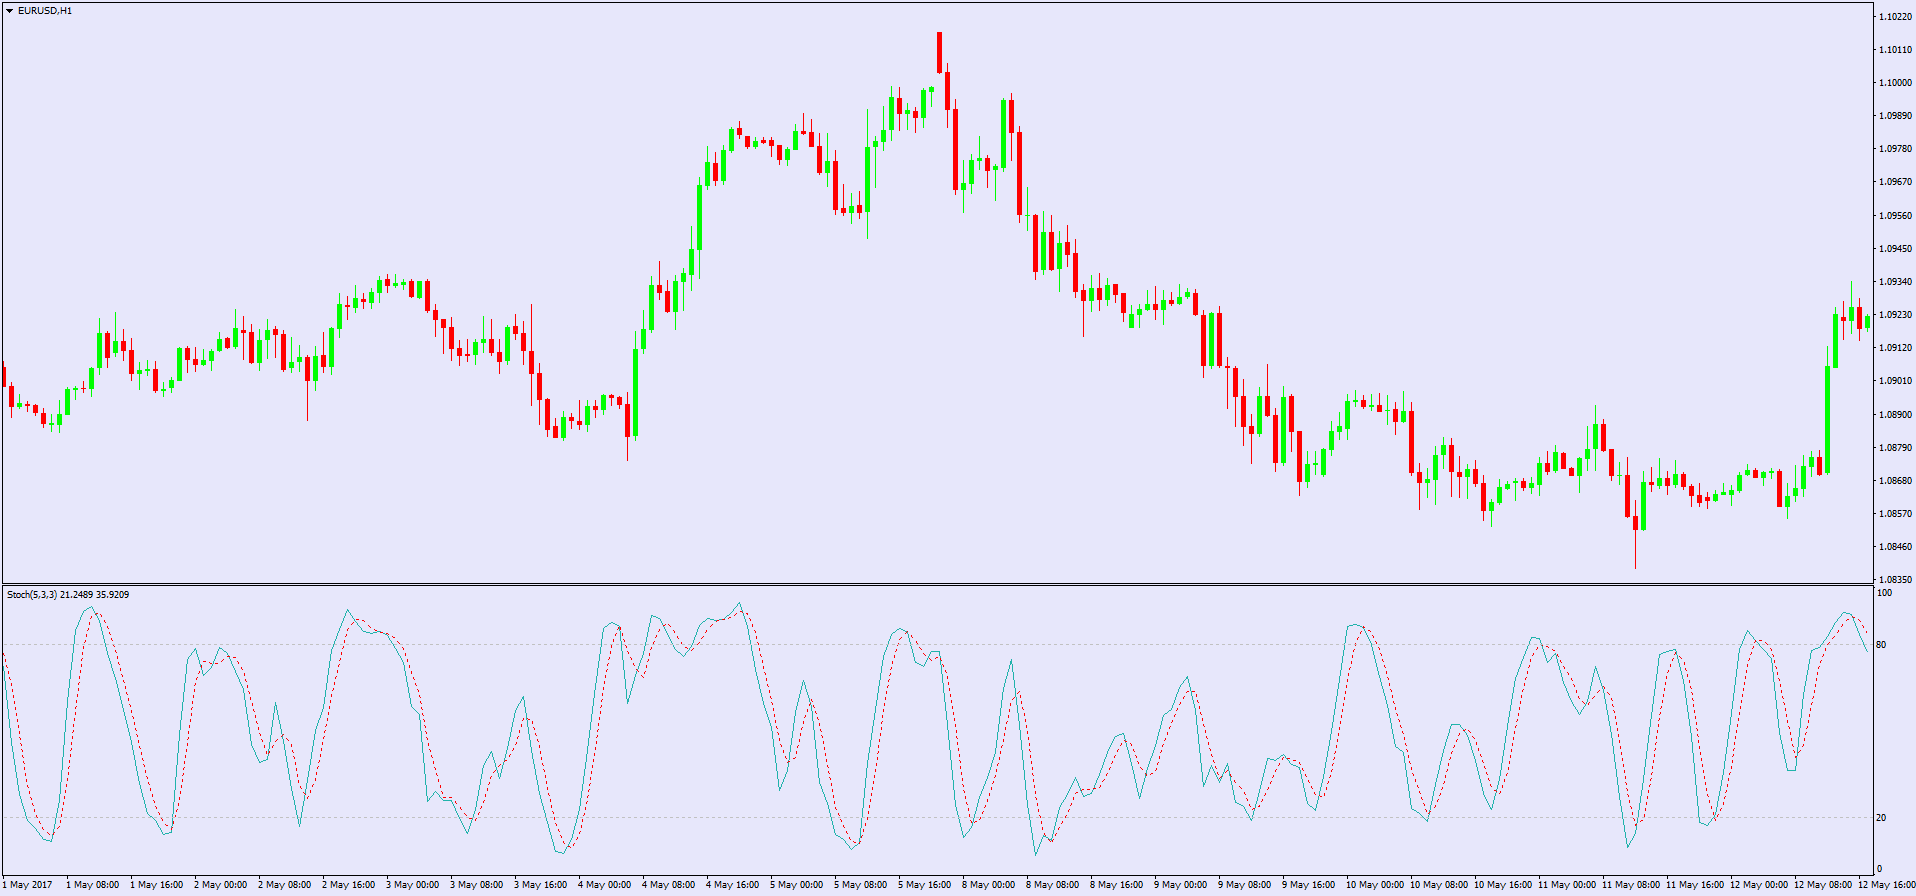
For this reason, it’s best to use it with the default settings. If you apply it on a regular chart, it will look exactly like the image below. The usual caveat applies here too: the bigger the time frame, the bigger the implications.
Stochastic Oscillator Formula
Before discussing the actual formula, we should look at what it means. The indicator travels only in positive territory: between the zero and one hundred levels. You’ll never see values bigger than one hundred or smaller than zero. This just comes from how the stochastic oscillator parameters work.
As mentioned above, its formula considers the main and the signal lines. The main line is %K and the signal %D. The actual formula is irrelevant. What matters the most for Forex traders is to know how to read the stochastic oscillator, not the mathematical formula.
For math fans, though, this is how the mainline formula looks like:
%K = 100[(C – L5close)/(H5 – L5)]
where
C = the most recent closing price
L5 = the low of the five previous trading sessions
H5 = the highest price traded during the same 5 day period.
The %D line is much simpler: %D = 100 X (H3/L3). Now you know why the oscillator comes with the 5 and 3 values as the default ones: the five and the three day-periods make up the formula.
As a rule of thumb, an oscillator’s purpose is to detect a lie. Or a fake move that price might make. Between the price and an oscillator, traders should always trust the oscillator. How come?
The answer is straightforward: there are more periods considered, whereas the price shows the current market stance. If one of the two is making a fake move, the price is the one. Hence, the Forex stochastic oscillator settings for day trading work best when traders use them against the current price.
Stochastic Oscillator Settings for Scalping
Traders open and close a position based on various things. The most important one is time. To be more exact, the time horizon of a trade gives the type of the trading style used. Therefore, swing traders consider a few hours or even days for a trade.
Investors don’t worry about time that much. What they do is they focus on the macro-picture. For investors, it matters most to be fundamentally right, then quick profits.
And then there are scalpers. This is where the average Joe, the Forex retail trader fits into. Retail traders start with a huge disadvantage: their own expectations related to trading. Most of them come to Forex trading for a quick and fast buck. The quicker, the better. The less effort, even better.
Trading doesn’t work this way. Or, it may, but is not profitable this way on the long run. Yet, the stochastic oscillator formula is the same for all investors. The only difference comes from the time frame used.
Here’s a quick guide for correlating a Forex stochastic strategy with the right time frame, having the time for a trade in mind:
– investors use it on the weekly and monthly charts, focusing on the last one
– swing traders come down to the daily, four-hour and hourly charts
– scalpers typically use the five-minute and lower time frames.
The strategies with the Forex stochastic oscillator to be explained here follow George Lane’s intention. That is, to create an indicator based on a simple formula that helps to spot fake moves. The beauty of this indicator is that all traders can use it.
Are you in for a quick buck and scalping suits your personality? Use the stochastic indicator! Is swing trading your thing? How about trying this indicator? Even investors find tremendous value in it.
How to Use the Forex Stochastic Oscillator?
George Lane wanted multiple things from this oscillator. And, in a way, he did a great job. Any oscillator, in the end, shows overbought and oversold levels. Hence, the first thing to look for is to buy oversold and sell overbought levels. But, an oscillator is more than that.
The focus should always stay on it. When dealing with an oscillator, some traders won’t even look at the actual price. They simply trade the oscillator’s moves more than the ones the price does.
Because the idea is to find out fake moves for the actual price, traders look for divergences. To be more exact, divergences between the price and the oscillator. Hence, a great stochastic oscillator strategy is to trade these divergences.
Moreover, if the absolute range is between zero and one hundred, can we do something about it? Is there any stochastic oscillator trading strategy derived from this?
The rest of this article deals with three ways that show how to use stochastic oscillator. For this, we’re using the default settings, just like George Lane intended. All of them have one thing in common: they consider the cross between the signal and the main line.
As always, keep in mind the time frame. The bigger it is, the bigger the implications for every strategy described below.
Trading Overextended Levels
In Forex trading, overextended refers to overbought or oversold levels. Therefore, the standard interpretation of an indicator that shows such levels is the following: buy oversold and sell overbought.
The chart below shows the EURUSD hourly time frame. Moreover, this stochastic oscillator trading strategy uses the current prices. This is important as one can test the relevance of it.
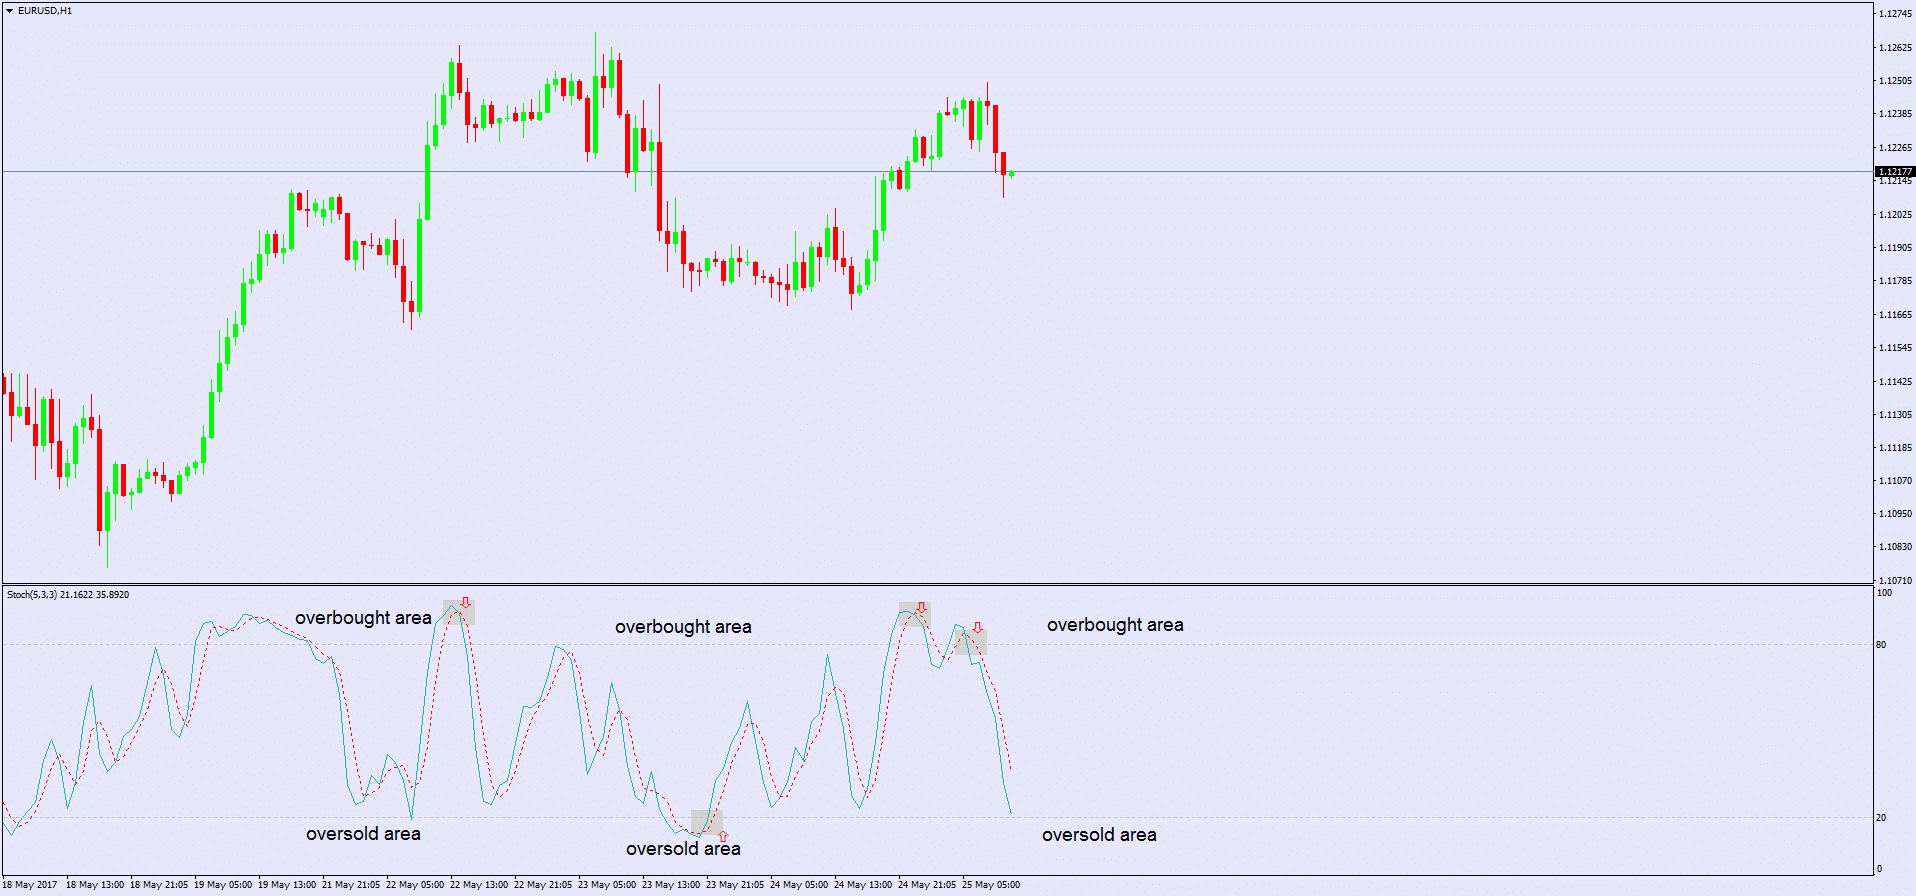
The stochastic oscillator indicator shows overbought and oversold levels above or below 80, respectively 20. However, keep in mind what was mentioned earlier: the cross between the two lines matter.
As such, using the Forex stochastic oscillator this way assumes traders should look for a cross in an overbought or oversold territory. More exactly, above 80 or below 20. Since these are the levels, they give the entries.
The idea is to sell on a cross above 80 and stay short until the fast line reaches the 20 level. And then, reverse. Go long on a cross below 20 and stay that way for the fast line to reach the 80 area.
This approach of how to read the stochastic oscillator worked like a charm. At least, the EURUSD hourly chart above shows great entries. However, there’s a catch: it works when the market is in a range.
The problem comes from the way the market behaves. While ranges predominate, they will be broken. Eventually! And when that happens, no overbought and oversold level can help your trading account.
In trading, there’s a saying: the market can stay in overbought/oversold areas more than a trader stays solvent. That is so true! As a consequence, there must be some other ways of using stochastic oscillator when the market breaks a range.
A stochastic oscillator divergence will show the right direction. Moreover, if used with proper risk/reward ratios and a disciplined approach, trading is fun.
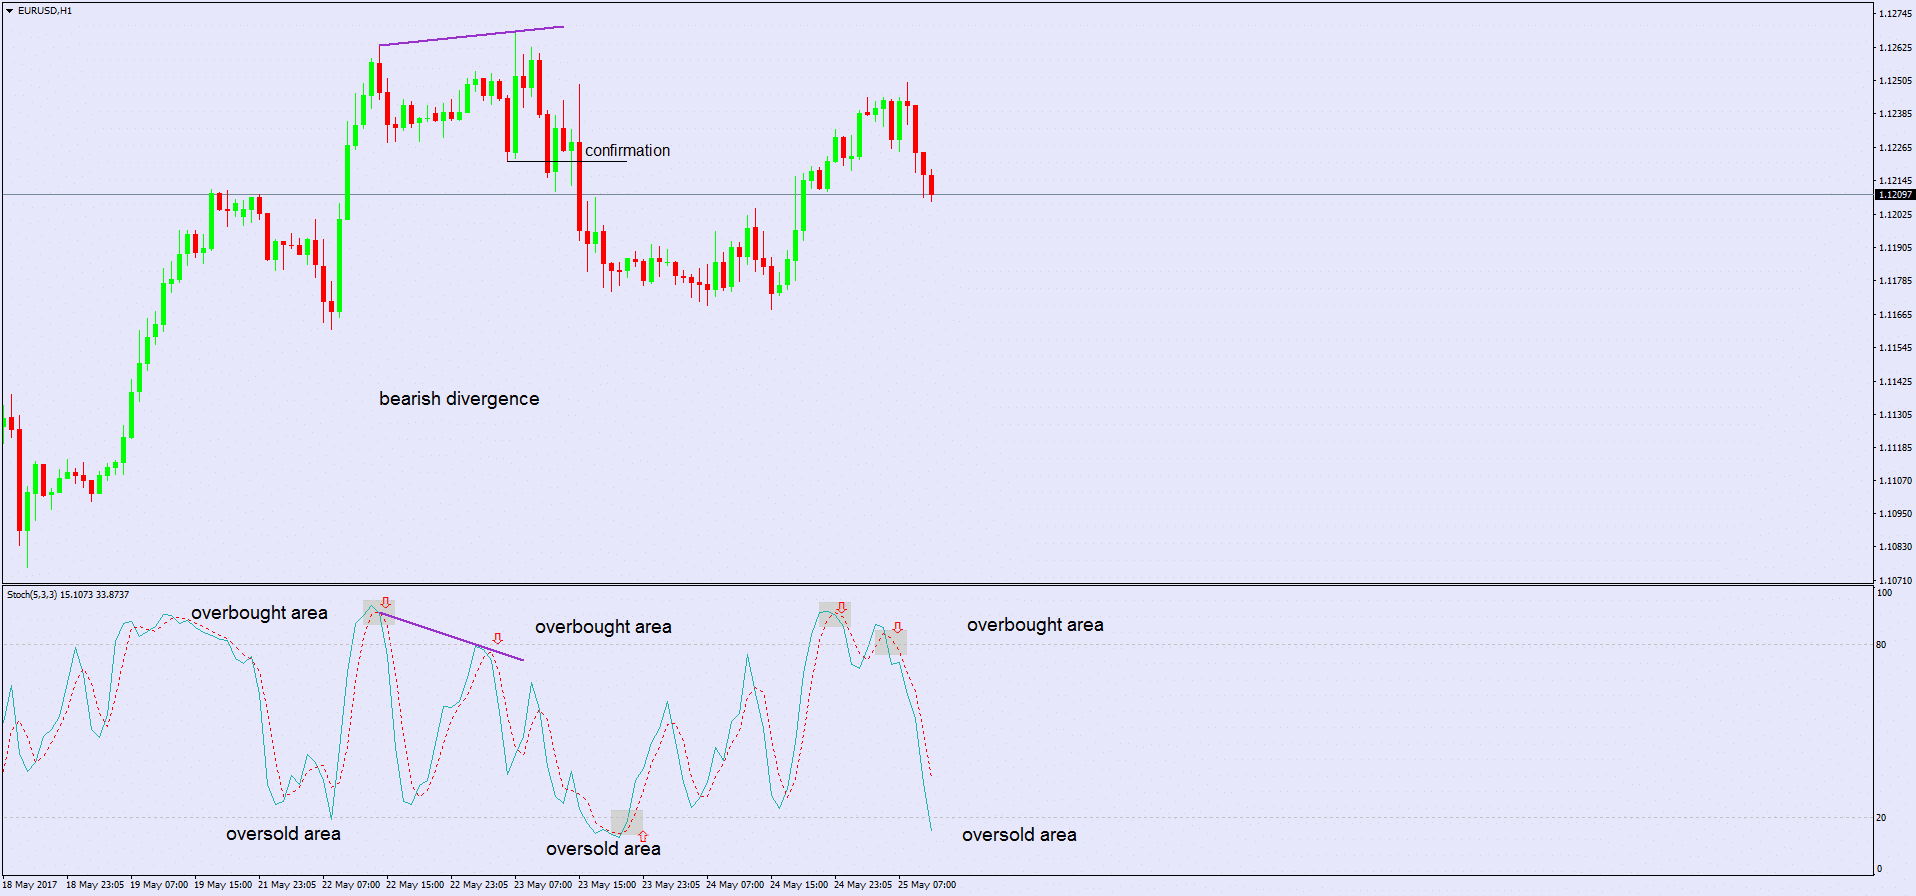
How to Use Stochastic Oscillator Divergences
A divergence forms when the price does something different than the oscillator. Or, the other way around. In both cases, one is lying, and that one is the price. Hence, traders should focus on the oscillator, rather than the price.
Divergences are of two types: bullish and bearish ones. The rule calls for long trades after a bullish divergence and short trades to follow a bearish one. Needless to say, bullish divergences appear at the end of bearish trends, and bearish divergences at the end or bullish ones.
Therefore, trading them is risky! Have you ever heard of “catching a falling knife” in trading? If yes, it was invented when traders bought bullish divergences. However, traders are of two types: conservative and aggressive ones.
Aggressive traders will always look to buy the absolute low. That is possible but very difficult. How about waiting for a confirmation?
Divergences show how to use stochastic oscillator in Forex trading when a decision needs to be made. Have a look at the chart below in order to understand what a divergence is and how the market confirms it.
Unfortunately, not everyone waits for a confirmation. That is when trading becomes expensive. Aggressive traders will argue here that better risk/reward ratios derive from being earlier in a trade. As a side note, the reward should be always bigger than the risk. Two, three or even higher multiples are part of a successful trader’s toolkit.
In any case, divergences give an educated guess regarding the future price direction. If anything, they show the trend hesitation. The oscillator’s ability to diverge from price tells much about the undergoing momentum or the current move’s lack of strength.
As a tip, when looking for divergences, try to find two higher/highs or lower/lows that the oscillator doesn’t confirm.
Crossing the Middle Range
The example above shows what conservative traders should look at before entering a trade. The bearish divergence gets confirmed by price moving below the lowest value of the previous swing. That is when selling should take place. After all, when dealing with your own money, you want to take all the precautionary measures possible.
Besides the two strategies from above, there’s another way that shows how to use stochastic oscillator in Forex.
The key to this is to use a trick given by the stochastic oscillator formula. How about splitting the range? The entire range matters here, not the one between overbought and oversold areas.
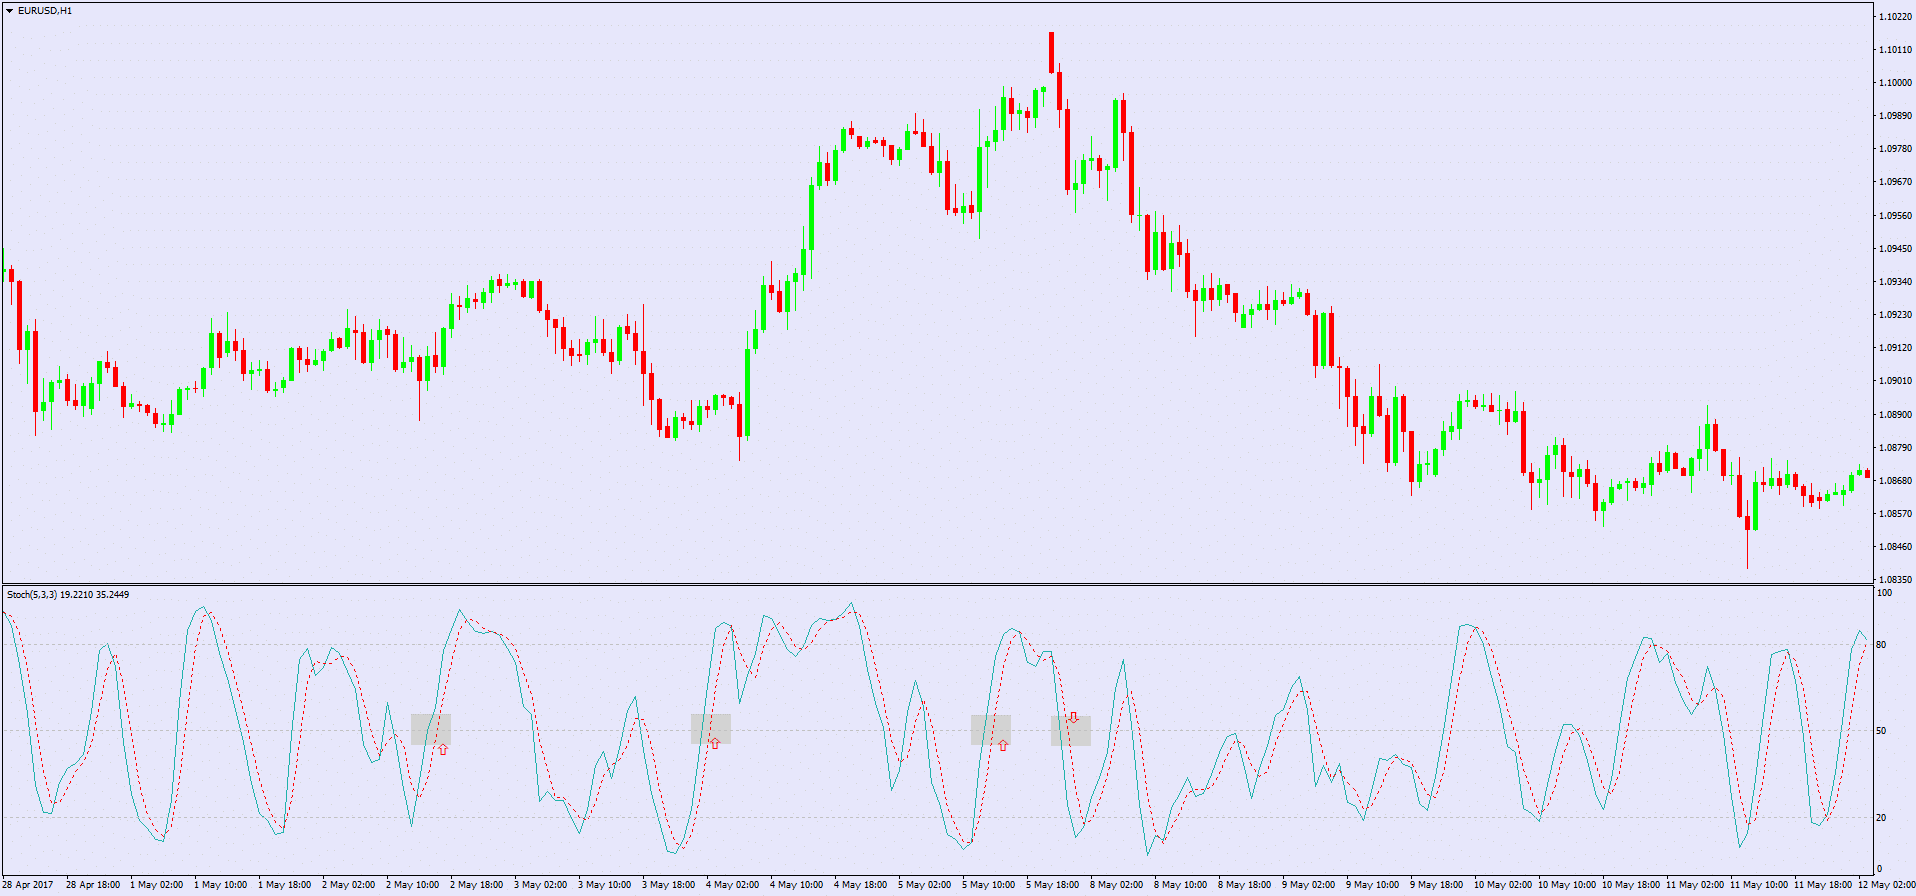
Having said that, the middle point between one hundred and zero is fifty. We can edit the indicator by right-clicking on the chart area, select it from the Indicators List and choosing the Levels tab. Simply add the 50 value, select the color and style, and it will appear on the oscillator’s window.
The idea behind this strategy is simple: use the 50 level as a continuation pattern. It means we should buy when the level gets crossed from below and sell when the oscillator comes from above.
Such a simplistic approach fails more than succeeds. But this doesn’t make it unprofitable. Whit risk-reward ratios bigger than 1:2 or 1:2.5 the account grows nicely.
The targets for this Forex stochastic oscillator strategy differ with the time frame. On a five-minute chart, smaller targets come with bigger volume. The opposite is true on bigger time frames: volumes drops on behalf of a bigger target.
Not once, traders fall prey to false expectations. Everyone looks for the holy grail in trading: find a strategy that works all the time. Instead, people should focus on a strategy that works MOST of the times. That makes money!
Video Example of the Stochastic Oscillator
And now you have the wonderful opportunity to see the Stochastic Oscillator in action for free. Below you will find a video that shows one of my trades with the Stochastic. I managed to match an overbought Stochastic signal with a price bounce from a bearish trend line. Therefore, I shorted the GBP/USD on the assumption that the price is about to decrease. Meanwhile, a Double Top chart pattern was confirmed on the chart, which gave additional support for my short trading decision.
See the video for free by entering your details!
Conclusion
This article used the standard stochastic oscillator settings to show ways to trade with it. However, the best stochastic settings for day trading are the ones that consider risk management.
In trading, this is more important than any trade setup. If you don’t understand the risk, you don’t know the reward. Both of them matter in the end.
This is the idea of any oscillator, no matter its name. Even though overbought or oversold levels aren’t specified, it is easy to build them. Likewise, divergences show the right direction when used with any oscillator.
If that is the case, what is stochastic oscillator showing differently than other indicators? What makes it so special?
Firstly, it shows a cross. This cross acts as a signal. One cannot say the trade was missed if the cross is in place. Secondly, when the cross forms above the 80 level, you simply don’t want to be long. Or short, if a bullish cross is below the 20 level.
When this happens on the five-minute chart, missing it is not a problem. However, on the daily and above, this is a costly mistake. In Forex trading, mistakes translate in losing money. We all want to avoid that.
Last but not least, the Forex stochastic oscillator formula allows for multiple ways to trade it. Either selling a bearish divergence or buying a bullish one, a proper money management system and discipline result in the account growing in time.
A trader has the best results when trading follows the rules. Rules, on the other hand, make a trading system and this, in turn, may, or may not be profitable. The profitability degree depends on the indicators used, and the stochastic oscillator explained here is among the best of them.
START LEARNING FOREX TODAY!
share This:


Leave a Reply