Traders have always been fascinated by a market’s volume. Various volume trading strategies have appeared and evolved in time. While Forex volume is a tricky concept, Forex volumes indicators do exist. A volume indicator that mt4 traders use is similar to any volume indicator from other markets.
When traders focus on volume, they want to spot market secrets. Or, where the smart money buys or sells.
We all know that the Forex market is complex. Its liquidity is the biggest in the world.
Over five trillion dollars in daily Forex volume definitely represents something. Despite such volume, the market is also volatile. Or, maybe, because of it.
This article aims to cover the most important ways to use Forex volume. Therefore, it will deal with the following:
Table of Contents
Why Should you Use the Forex Volume Indicator in MetaTrader 4?
For the Forex trader, volume trading strategies are a bit more complicated than others. There’s a reason for that.
While other indicators/oscillators have a straightforward interpretation, the volume indicator’s one is relative. As such, the volume indicator the mt4 platform offers is subject to interpretation.
But, there are multiple Forex volumes indicator strategies. And, various indicators that use the market’s volume.
What you see in the spot Forex market is not the actual traded volume. It is just the volume traded at your broker.
What is Forex Volume and Why do Traders Care?
As mentioned above, the Forex volume you see is just the one traded at your broker. It shows the trading activity of investors with that broker.
Yet, volume trading strategies are popular among Forex traders. While the volume indicator mt4 platform offers doesn’t refer to the whole market, it acts as a proxy. Or, in plain English, it offers an educated guess about the total volume.
And about the market’s activity. Traders rely on the broker’s tick volume to give an estimation of the actual volume. Because of that, there are various ways to use volume analysis to spot profitable trades.
As a rule of thumb, a volume indicator is typically used together with price analysis. Therefore, traders use it to spot a trend’s strength.
The metatrader 4 volume indicator’s interpretation is straightforward. At least the classic one is.
As such, rising trading volumes signal bullish activity. And, of course, falling ones show weakness.
Today’s Forex market creates different patterns on a chart. Because of automated order types, the market makes different moves than before.
It means the classic volume indicator in technical analysis won’t reflect the true state of the market. Different types of oscillator have appeared as a result.
Traders care about volume, but few use volume oscillators. They offer far more valuable information than price oscillators.
Volume oscillators do not travel into overbought or oversold territory like classic ones. In fact, they’re built in a different way.
As such, their interpretation differs. Most popular ones look to identify the “big guys” positioning on the Forex market.
Yet, all approaches work. Used together, they give an idea about a trend’s exhaustion or strength.
How to Use Volume Indicator MT4
Traders care about the information provided by the Forex volumes indicator. It shows potential interest at moments in time.
The standard interpretation is to analyze a trend with the volume indicator. In reality, traders analyze the overall market activity. Not only a trend.
For example, one of the best volume trading strategies looks at falling volume while prices increase. That’s a sign of trend weakness. As such, traders look to fade that move. Or, to sell short.
How else to use the Forex volume? Another way is to look at bars that stand out of the crowd. Or, that differ strongly from other ones.
That’s a sign of something happening. The volume indicator mt4 trading platform offers can spot the start of a trend.
Check the image below for the perfect example. It happened recently on the EURUSD pair.
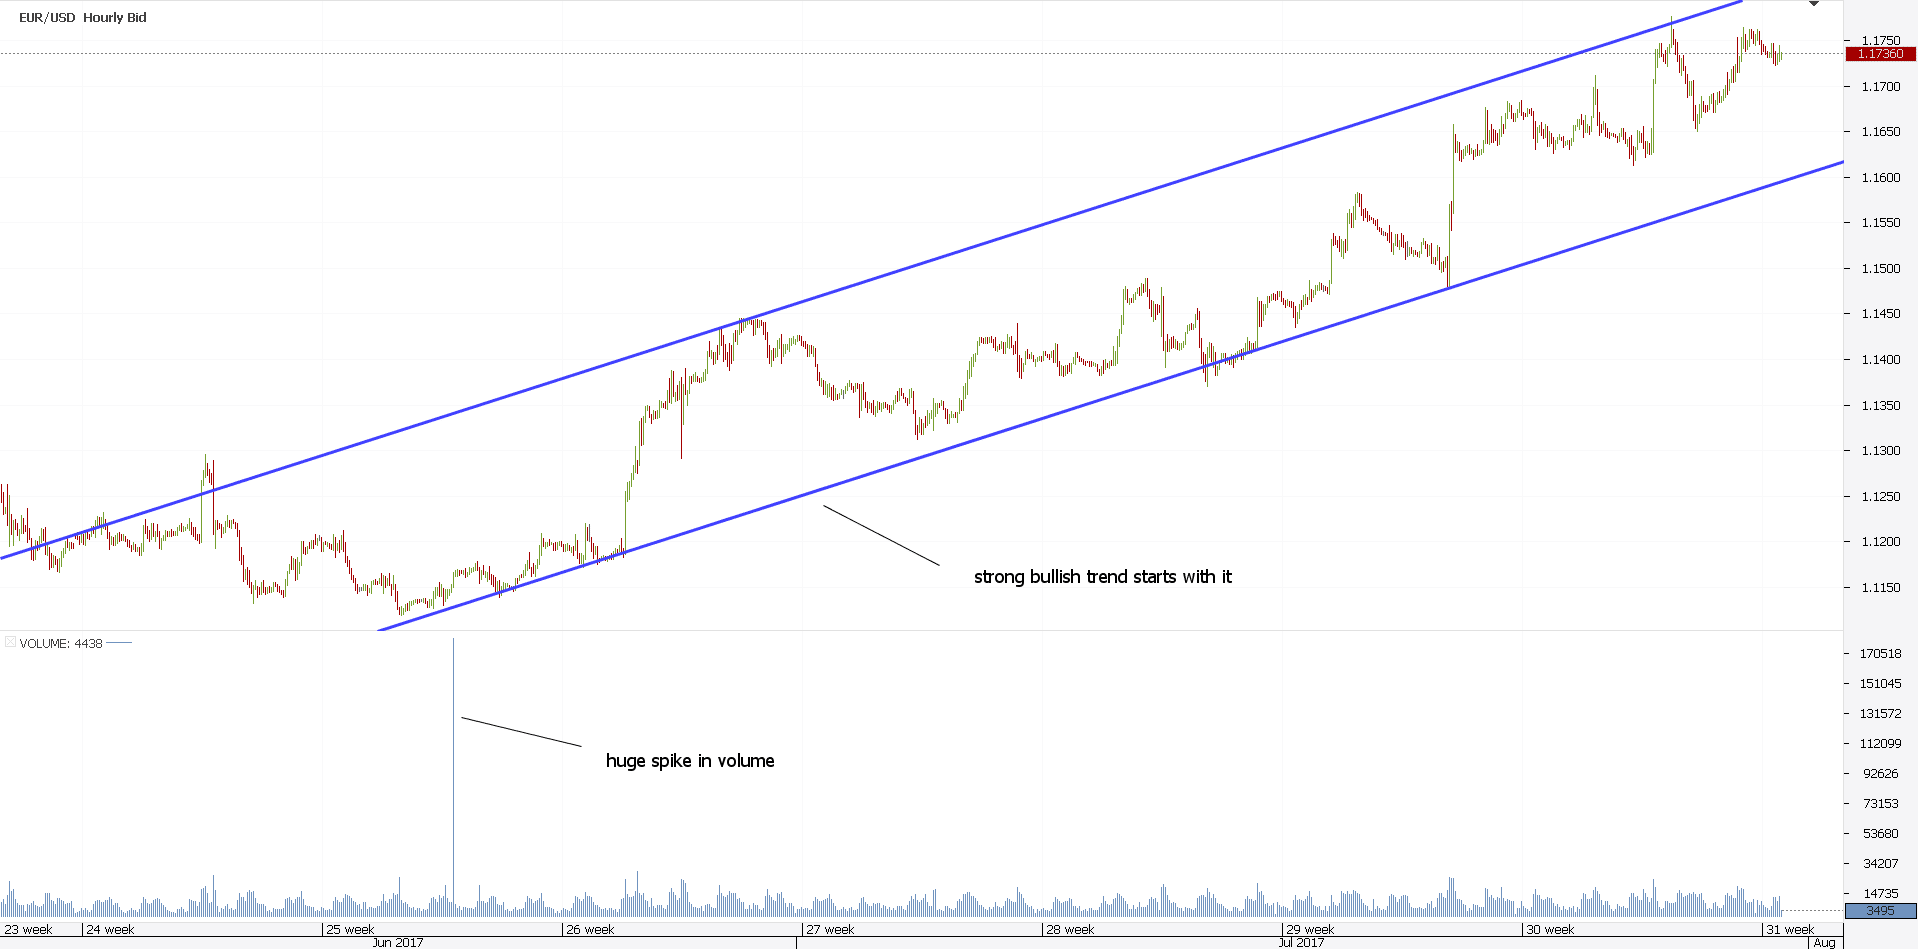
The Forex volumes indicator registers an “unusual activity” when compared with the other volume bars. This is a sign of strong demand.
As such, it is no wonder a strong trend started. Such simple volume trading strategies are sometimes enough to end up on the right side of the market.
Why complicate things?
But, is this valid one hundred percent of the times? Because volume is relative to the Forex market, the answer is no.
Yet, if traders understand the volume indicator’s calculation, they understand the market. The formula goes like this:
volume indicator = total value/number of transactions during a given period
Therefore, it is no wonder that traders look for spikes in volume. They usually come at turning points.
Trading with the Time Segmented Volume Indicator
One of the most popular price and time oscillators is George Lane’s Stochastic. It was developed in the 1950’s and reflects the state of the market during those years.
It was range bound for several years. As a result, such an oscillator works with overbought and oversold conditions.
However, a volume oscillator doesn’t have overbought or oversold levels. Instead, it has a simple line.
This line acts as an oscillation level for a respective security. It works well for a Forex pair too.
One of the best Forex volume oscillators is the Time Segmented Volume (TSV). Don Worden wanted to see where the market has a large-lot activity. And, where it doesn’t.
Consequently, the TSV differs from the volume indicator mt4 offers. It is more accurate in showing tops or bottoms.
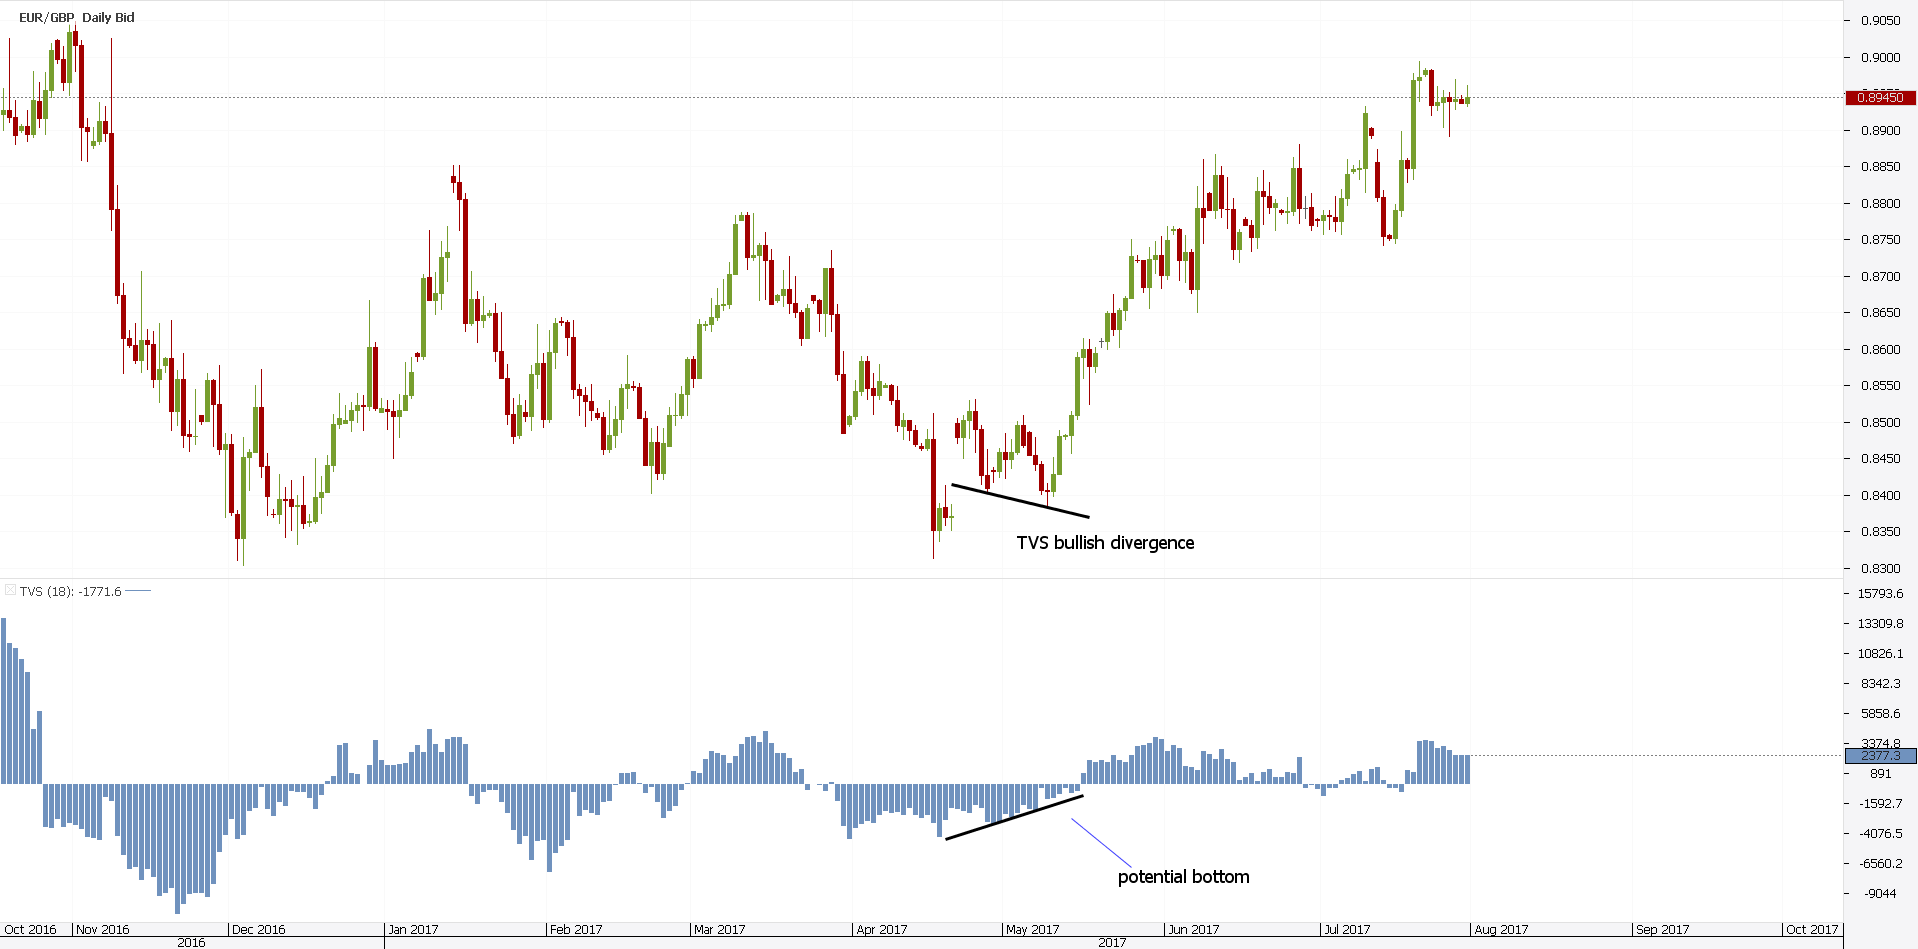
One of the best volume trading strategies with the TSV is to look for divergences. That is divergences between the price and the volume indicator.
Above is the EURGBP daily chart. It shows a divergence between TSV and price.
While the actual price made a second low, the TSV didn’t confirm it. This is the power of this Forex volume indicator: it shows a breakout before it happens.
Statistically, 80% of all market orders are fully automated now. This makes it difficult to read a chart pattern.
As a result, traditional technical analysis setups don’t work as well as they did before. Trading has changed.
Head and shoulders, double and triple tops, wedges…they are an important part of technical analysis. But, the Forex market changed since automated trading grew in popularity.
Hence, the way a market bottoms or tops has changed too. The classic volume indicator mt4 trading platform offers, is not enough anymore.
Volume Spread Analysis as a Forex Volumes Indicator
Volume Spread Analysis, or VSA as it is also known is a powerful trading theory, deals with interpreting candlesticks based on their volume.
Williams, Wyckoff, Livermore…they all played an important role in the VSA’s evolution. In fact, the term VSA was first used by Tom Williams to describe the trading methods he used.
But what is VSA? And, does it work on the Forex market?
The subject is so vast, it is difficult to find a starting point. There’s so much material on it that traders no longer know which is the right approach.
It all starts with the retail trader…
Retail traders lose money on the Forex market. Most of them. At least when it comes to their first deposit, retail traders lose.
Therefore, who makes money? The answer is that the other parties involved make money. Not the retail trader. Big players.
Professional traders play big. So, a fair statement would be that if retail traders did the same as professional traders, they would stand a chance in the Forex market.
This is what VSA is. A volume analysis theory aimed to understand what professional traders do.
It starts from the assumption that professional traders leave footprints in volume data. As such, what if one can find them and then trade accordingly?
Volume Trading Strategies – VSA Explained
VSA works in all markets. If there’s price and volume, one can interpret a market.
The problem is the same as any volume indicator: is the volume reliable? Even if not, like in the case of the Forex market, it still offers a glimpse into what professional traders do.
VSA as a Forex volume strategy is difficult to understand. It starts from two basic concepts: no demand and no selling pressure.
When the market rises but the volume and spreads decline (spread = range of a candle), there’s no demand. If there’s no demand, the market will eventually fall. Hence, this is bearish.
This is opposite to the classic volume indicator mt4, VSA looks more similar to Japanese candlestick techniques. After all, Japanese candlesticks techniques deal with a candle’s ranges (spreads/shadows) and mostly shows reversal conditions.
The VSA is an interesting theory. For example, if a market falls, it doesn’t mean it’s bearish.
If the falling comes with lower spread and volume, the market is actually bullish. Buyers quietly step in.
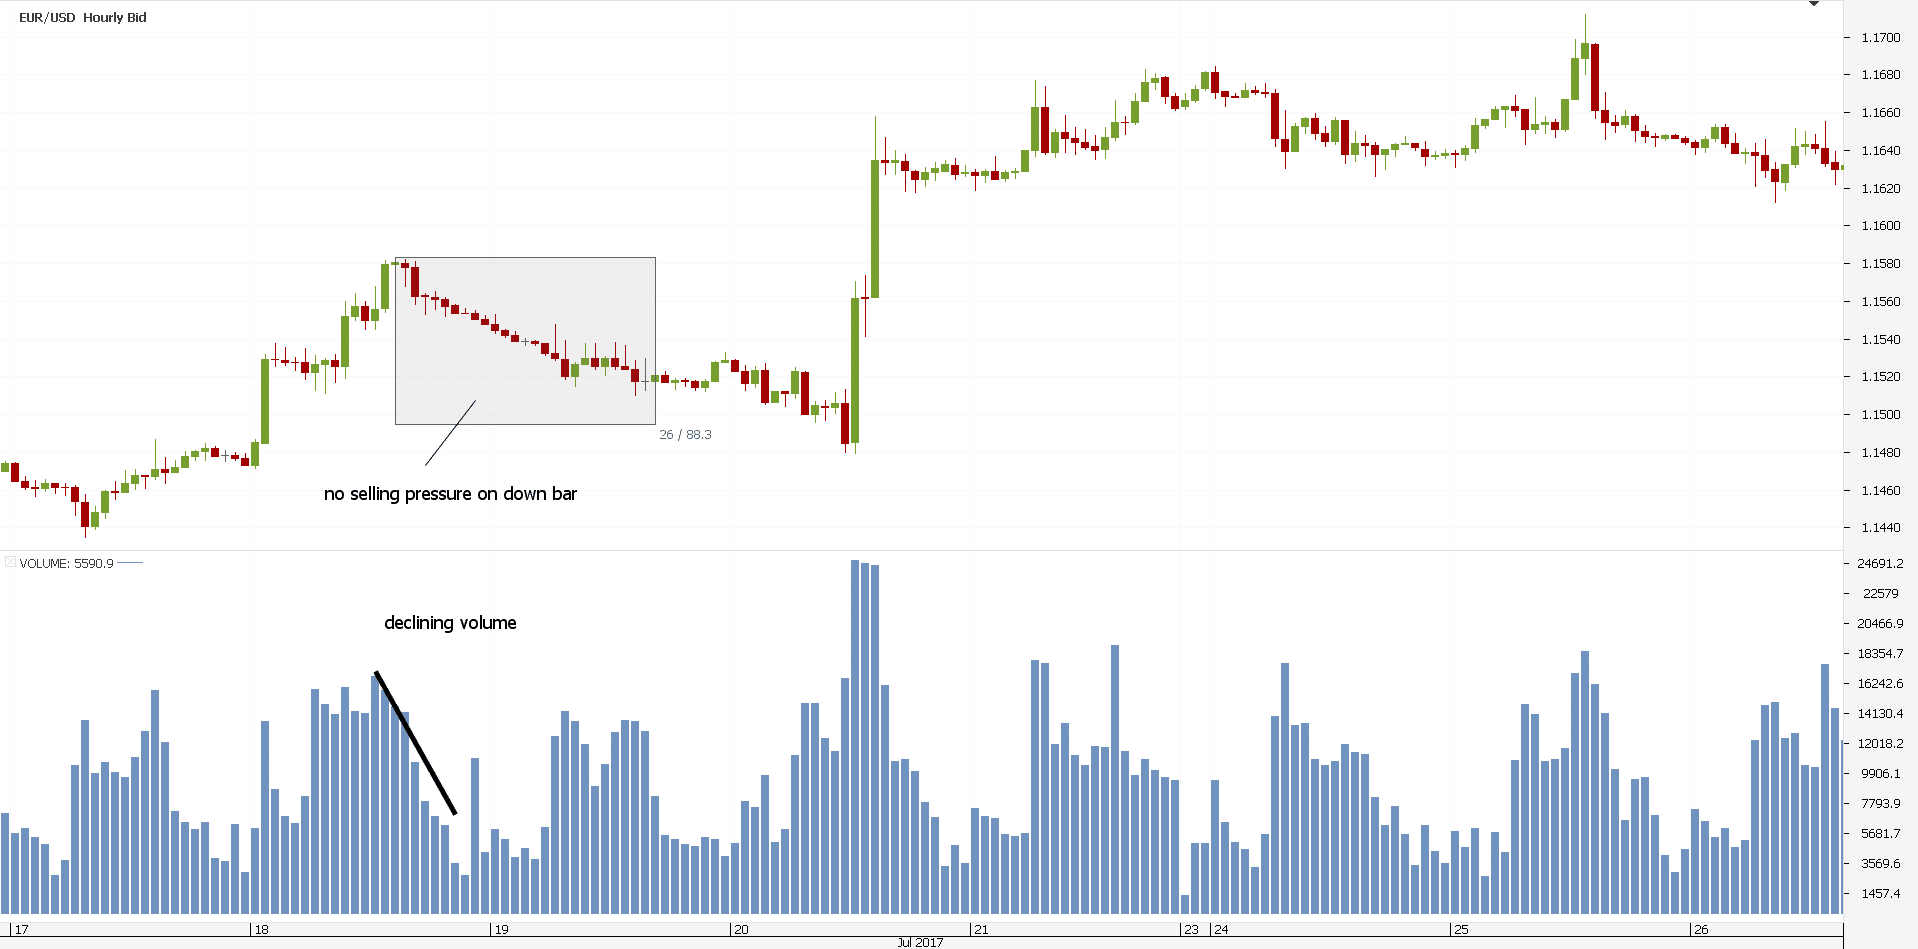
When this happens, it is said that there’s no selling pressure on the down bar. Hence, the market gets ready to jump.
Above is an EURUSD recent chart. It shows a no selling pressure on a down bar situation.
For this to happen, traders look for the following:
- Volume is lower than the past two candles.
- Spreads are narrowing.
- Price closes lower than the previous candle.
The declining volume together with the narrowing spreads offers a clue that the market is geting ready to jump. So, it did.
Powerful volume trading strategies like this one show ideal conditions to enter a market. Right before the breakout.
Obviously, for a no demand on up bar setup, the conditions are opposite.
How to Trade with the On-Balance Volume Indicator
The On-Balance Volume (OBV) is a cumulative volume-based tool. Simply put, it is a line.
However, this line is a special one for several reasons. First, it appears at the bottom of a chart. But, it is not an oscillator.
Second, it shows the relation between the number of transactions and the price movements. Hence, it shows volume.
Finally, traders use this line to confirm trends. Or, to spot reversals.
If the OBV indicator rises, the trend is bullish. When it falls, the price should fall too.
As such, traders look at the OBV to be accurate when predicting the movement of a security. In our case, the move of a currency pair.
The OBV’s period can be adjusted. In fact, its calculation method depends on the period considered.
To put the power of this volume profile indicator in perspective, consider its calculation. If the current closing price is above the previous one, the current volume gets added to the OBV.
If it is unchanged, the volume remains the same. And it is subtracted if the closing is below.
Because of these characteristics, it mirrors price action. Hence, when a divergence forms, it is a powerful reversal signal.
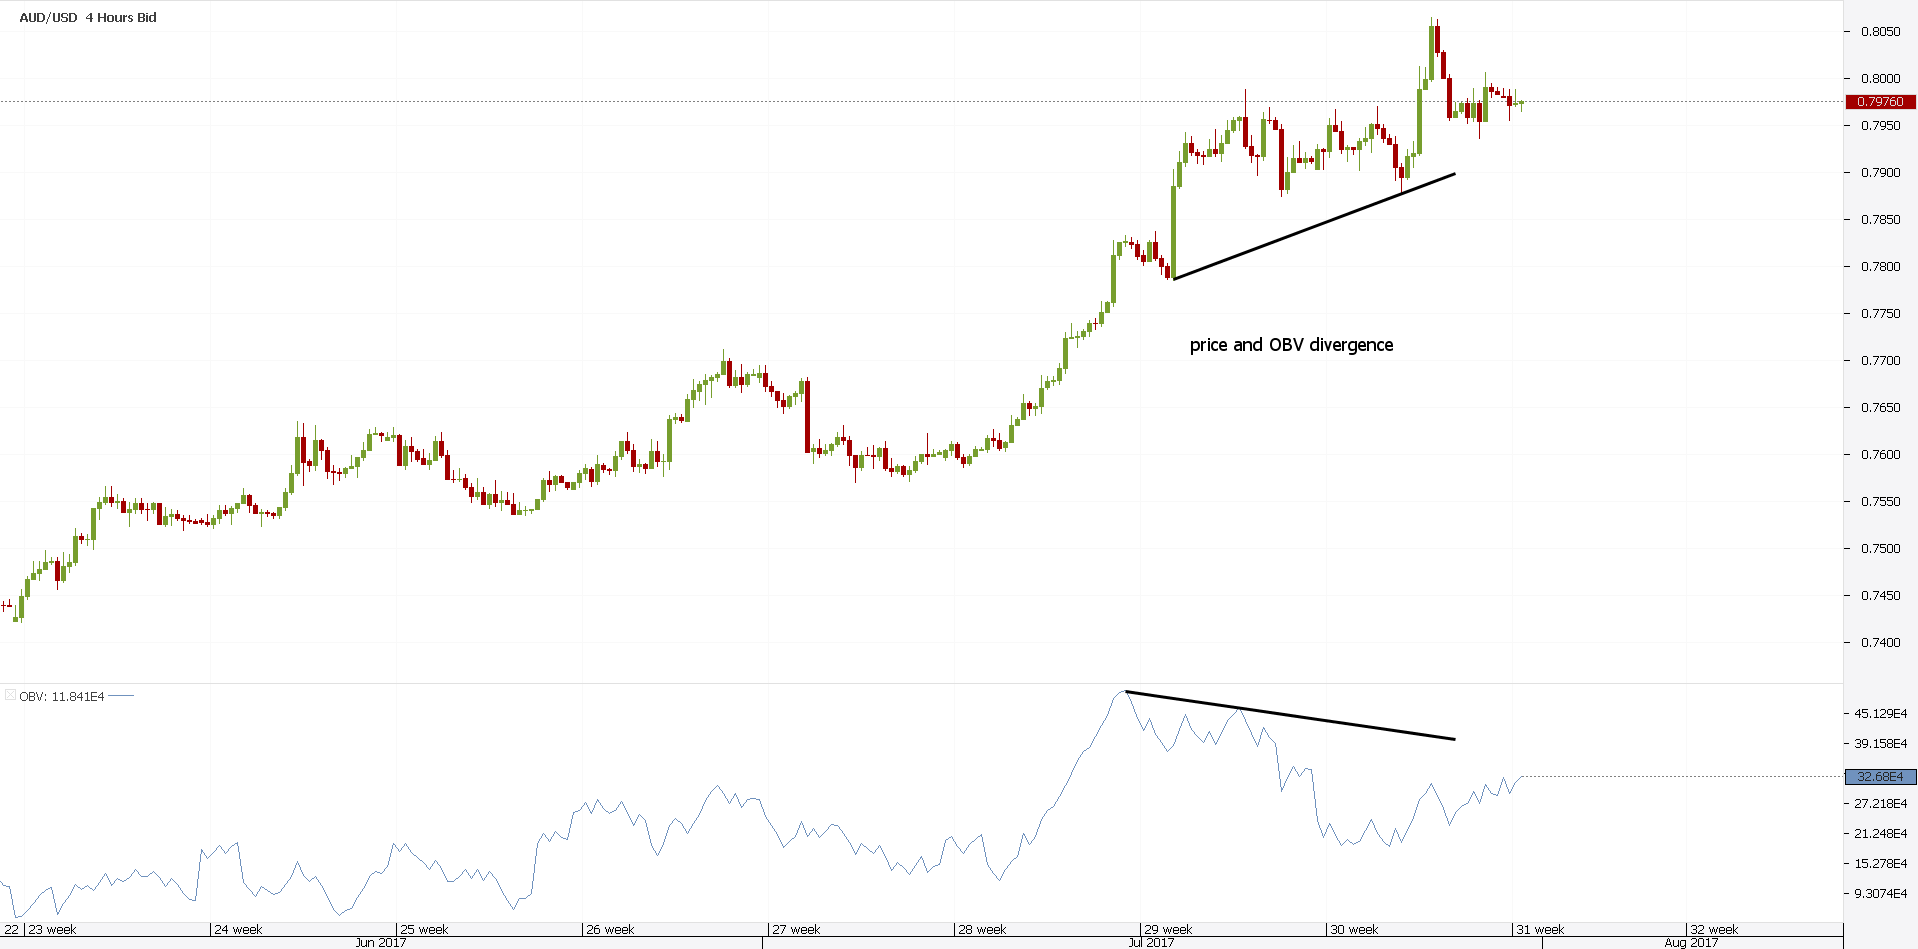
The AUDUSD chart above shows rising prices. But, the OBV Forex volume declines.
Now, that’s a dangerous territory for bulls. The market hesitates.
A close look on the left side of the chart shows the OBV mimicking price. Not anymore. Hence, bears will use this opportunity to short sell the pair.
Trading Forex with the Chaikin Volume Indicator
Perhaps the best volume indicator, the Chaikin indicator is Marc Chaikin’s creation. It is a combination between the MACD and the momentum oscillators.
More exactly, it measures the momentum of the accumulation/distribution line with the MACD. Traders use it to anticipate changes in trends.
When momentum changes, it is the first sign that the trend is faltering. As such, if traders know in advance when this will happen, they will position accordingly.
The Chaikin volume indicator that Forex traders use travels both in the positive and negative territory. The Forex volume indicator strategy is to buy or sell when it crosses from positive to negative or negative to positive territory.
Divergences work with Chaikin too. However, because we have already showed how a divergence with a Forex volume indicator works, we’ll focus on the crossing strategy.
When applied on a chart, this Forex volumes indicator looks like the one above. Totally different from a volume indicator that the mt4 trading platform offers.
As explained earlier, the idea is to buy or sell when the Chaikin crosses the zero level. But, it gives multiple signals. Many of them, fake ones.
How to Filter the Chaikin Volume Indicator’s Signals
The answer comes from adding levels to it. Like any Forex volume indicator mt4 offers, the Chaikin can be edited.
To filter fake signals, traders follow several steps. First, they define the area surrounding the zero level. Or, the area of interest.
Second, they look when the volume oscillator breaks out of it. That’s the market direction.
Finally, they only take the signals in the direction of the previous break. They simply ignore the rest.
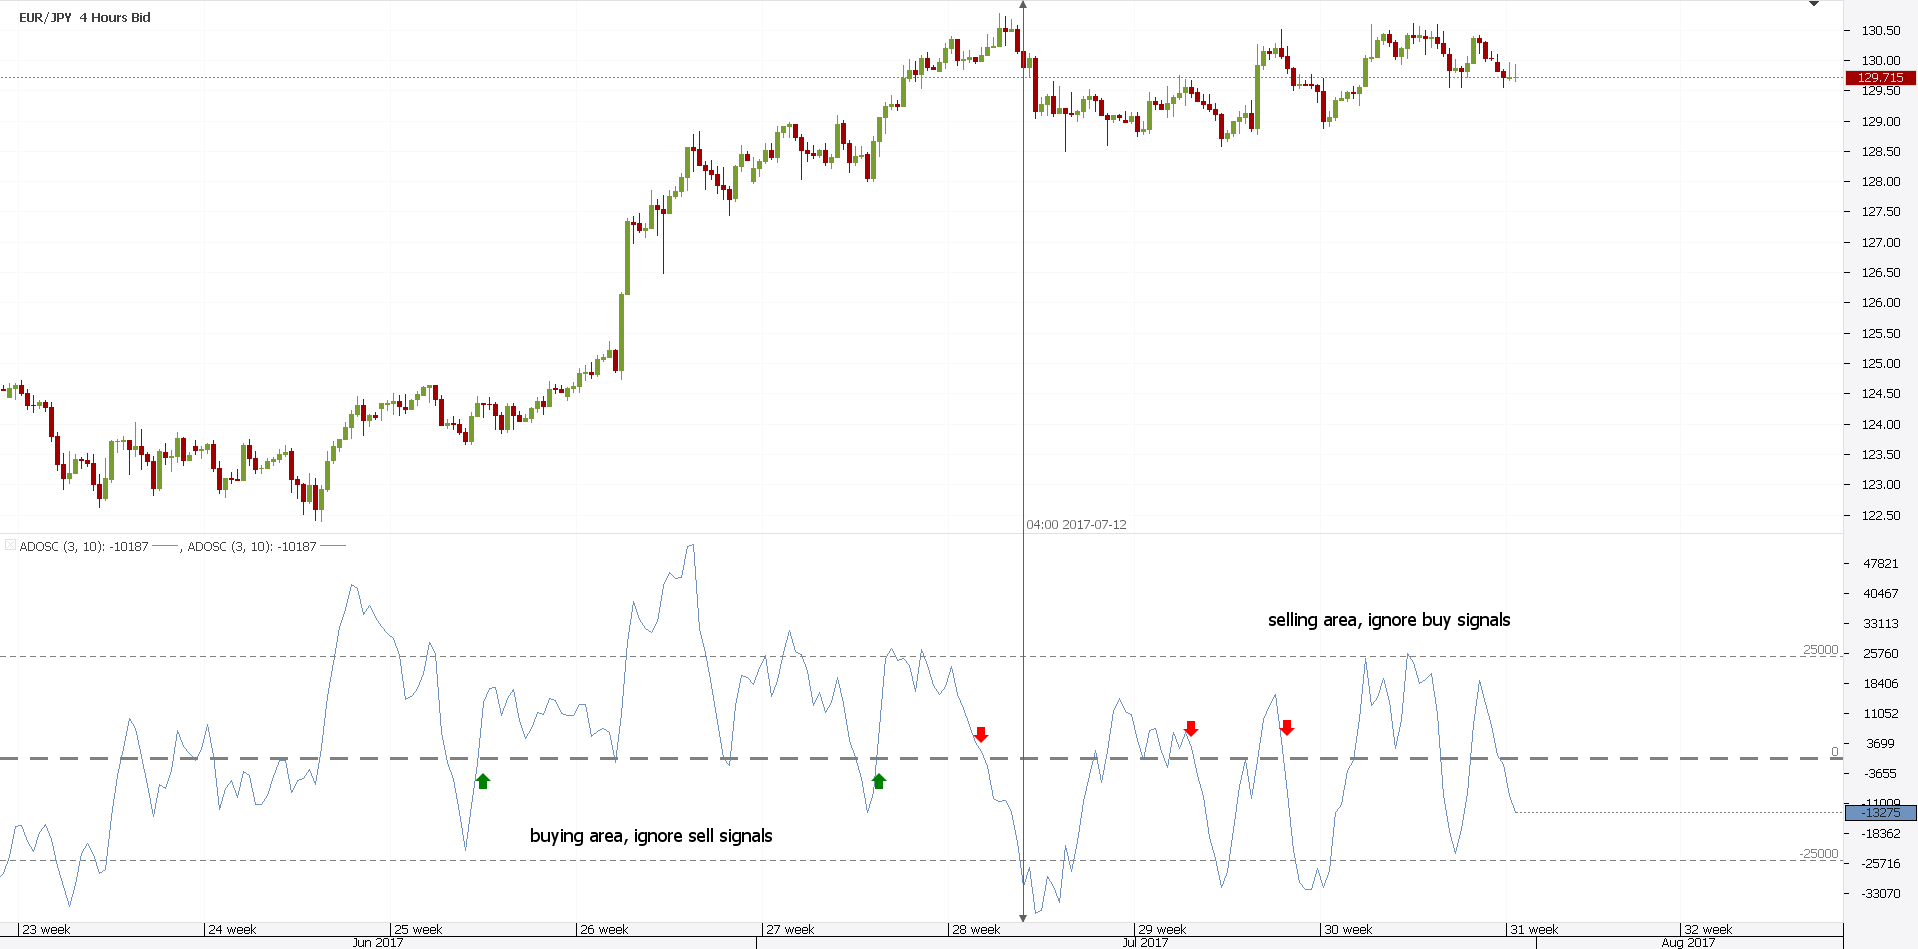
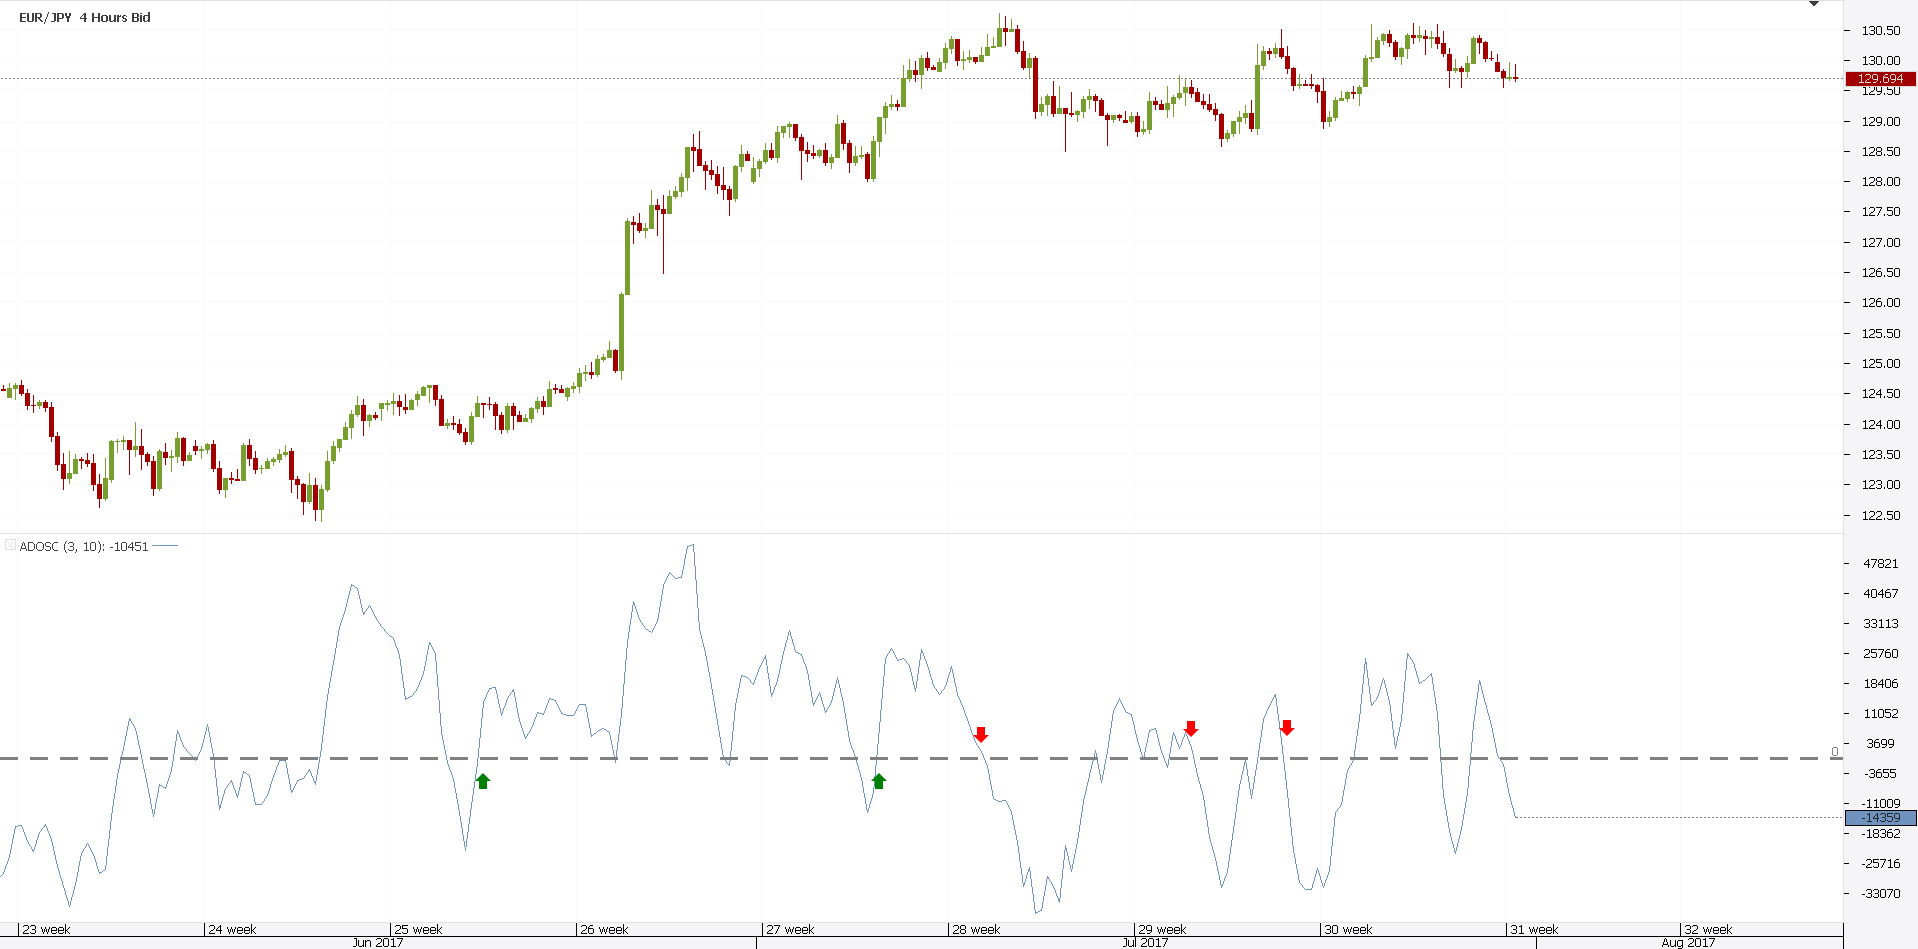
Let’s have a look at the chart above and interpret it. That’s the EURJPY four-hour time frame.
The defined area here is between -25k and +25k. A break above or below the two lines defines the market.
We should use that break to filter the signals. As such, on the left side, the Chaikin Forex volumes indicator spikes above 25k. That’s bullish.
Traders only buy the cross above the zero level. On the other hand, when the oscillator dips below -25k, a bearish environment starts.
The Chaikin did that and from that moment on, traders only sell. No one is interested in buying anymore.
Conclusion
Volume analysis and interpretation open the gates to various opportunities. Traders look to form an idea about what professionals do. That’s when the VSA kicks in.
The best volume indicator that the mt4 trading platform offers interprets time too, not only the price. That’s why traders use the TVS as explained in this article.
Yet, no matter the volume indicator, the strategy is the same. To find the best places to sell or buy a currency pair.
While no Forex volumes indicator shows the total volume, it offers an idea about it. Hence, traders use them with a great deal of success.
There’s no strategy better than other. Volumes are relative, especially in the Forex market.
But, if anything, they represent one of the few situations when traders can spot a move before happening. To be clear, price action tells much about a future move.
When bullish price action comes with volume, traders pay attention. When volume lacks, everyone looks to fade the move.
Many traders use no volume trading strategies at all. They simply add the volume indicator mt4 on a chart.
And, analyze the spikes. As such, they use the volume as a confirmation of their strategy.
In other words, some trades are simply scrapped if there’s no volume. Or, if the volume is on a falling path.
On the other hand, if the volume is on the rise, it simply reinforces a trade. Everyone wants to trade in the same direction as the big guys trade.
That’s why the Forex volume indicator is so popular among Forex traders. Especially among retail ones.
START LEARNING FOREX TODAY!
share This:


Leave a Reply