The overall GBP strength might send many GBP/XXX pairs up, including GBP/NZD, GBP/CAD, and potentially many others. Considering the summer holidays it could take weeks for the price to reached above-mentions key resistance, but at the same time, a fast uptrend could also be the case.
Disclaimer: The analysis presented in this article is for educational purposes only and should not be considered as financial advice.
This analysis was done on MetaTrader 4.
Click below to open a Free Demo Account with our trusted brokers:
Trade Idea Details:
GBP/NZD symbol on the MT4 platform
Type: Bullish
Key support levels: 1.9150, 1.9000
Key resistance levels: 1.9286, 1.9572
Price Action:
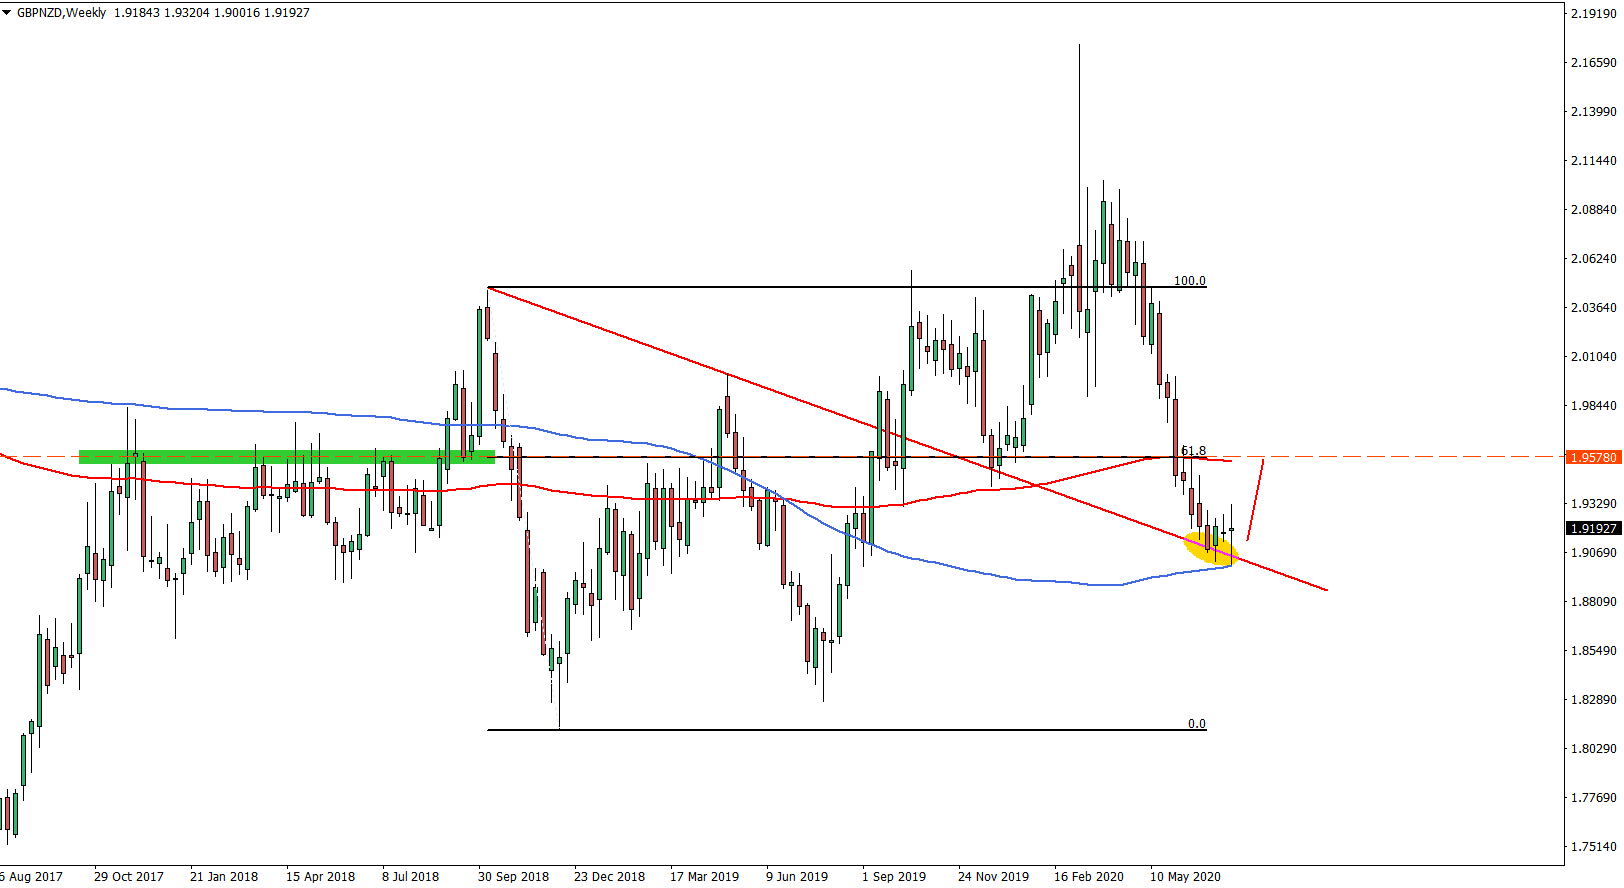
On the Weekly chart, we can observe a long term uptrend as the price continues to produce higher highs and higher lows. This week GBP/NZD has reached and rejected the uptrend trendline as well as 200 Exponential Moving Average, both of which acted as the support. This might result in either a correctional wave up or a long term uptrend continuation. The potential upside target is seen at 1.9580 area, which is 61.8% Fibonacci retracement level corresponding to the 200 Simple Moving Average.
On the 4-hour chart GBP/NZD has formed a double bottom near 1.9000 key psychological support. At the same time, the RSI oscillator formed a bullish divergence suggesting an incoming wave to the upside. On this chart, we have applied another Fibonacci indicator which shows that 88.6% Fibs corresponds to the previously mentioned resistance at 1.9572 area.

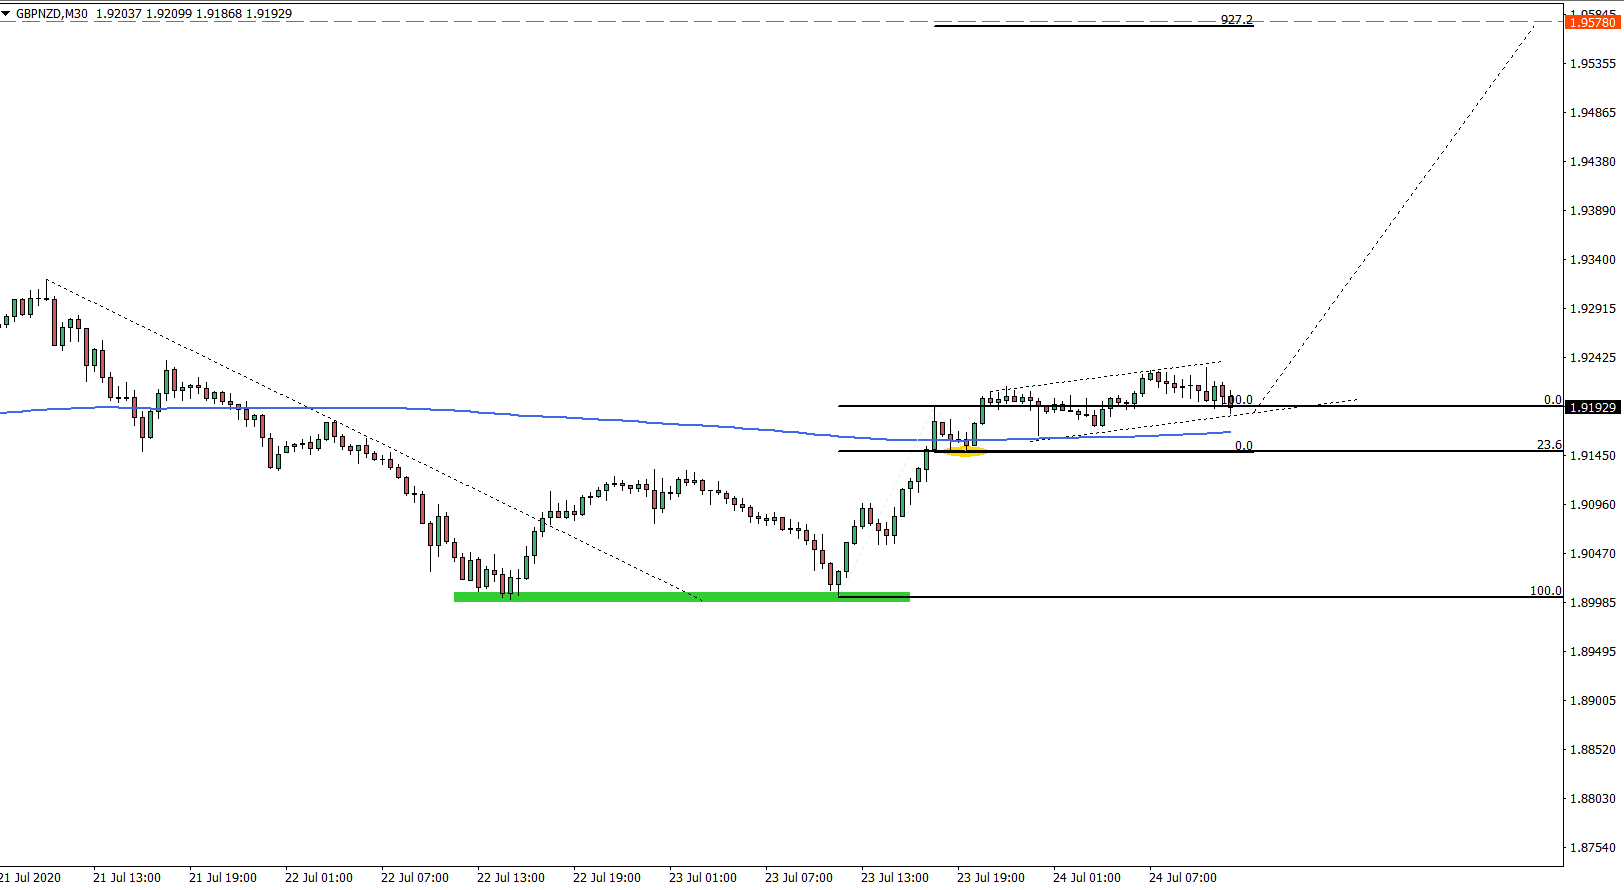
And finally, the 30-minute chart, which clearly shows the formation of the second double bottom, after which price broke above the 200 EMA. Fibs applied to the pullback after EMA breakout shows that GBP/NZD rejected 23.6% Fibs at 1.9150 and then produced a new higher high. We have applied Fibs to that small pullback where 927.2% Fibs also corresponds to the key resistance near 1.9580 area.
Potential Trade Idea:
The idea entry point might be near the previous level of support, near 1.9150. It would be best to wait for the spike below this level and make sure that 4-hour close will remain above it, before/if considering to go long. The upside target is located at 1.9572 and is confirmed by 3 Fibonacci retracement levels. In order to meet the 1:2 Risk/Reward ratio, the stop loss should be placed just below the 1.8900 psychological support.


Leave a Reply