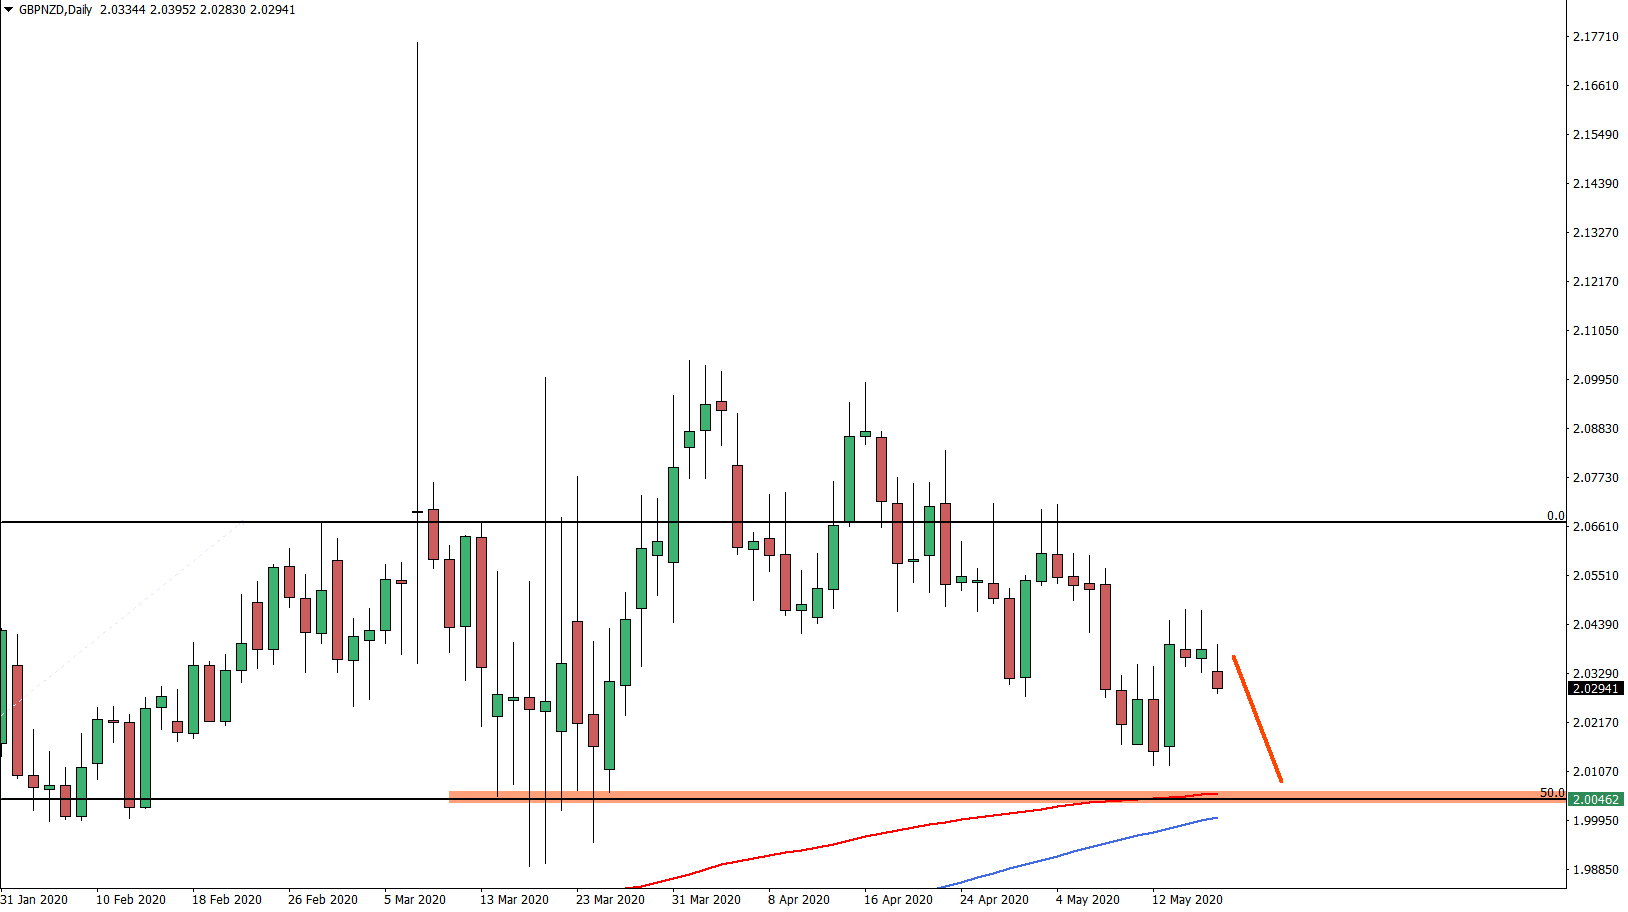
GBP/NZD has established a downtrend and it continues to bounce off 200 MAs on multiple timeframes. This is a clear bearish tendency and we might be witnessing the beginning of yet another wave down.
Disclaimer: The analysis presented in this article is for educational purposes only and should not be considered as financial advice.
This analysis was done on MetaTrader 4.
Click below to open a Free Demo Account with our trusted brokers:
Trade Idea Details:
GBP/NZD symbol
Type: Bearish
Key support levels: 2.0050
Key resistance levels: 2.0473
Price Action: The Daily chart clearly shows strong bearish momentum for GBP/NZD currency pair as the price continues to print lower lows and lower highs. This might result in the continuation of the downtrend. The potential decline could be extended towards the previous area of support near 2.0050, which also corresponds to both 200 period Moving Averages, Simple and Exponential.
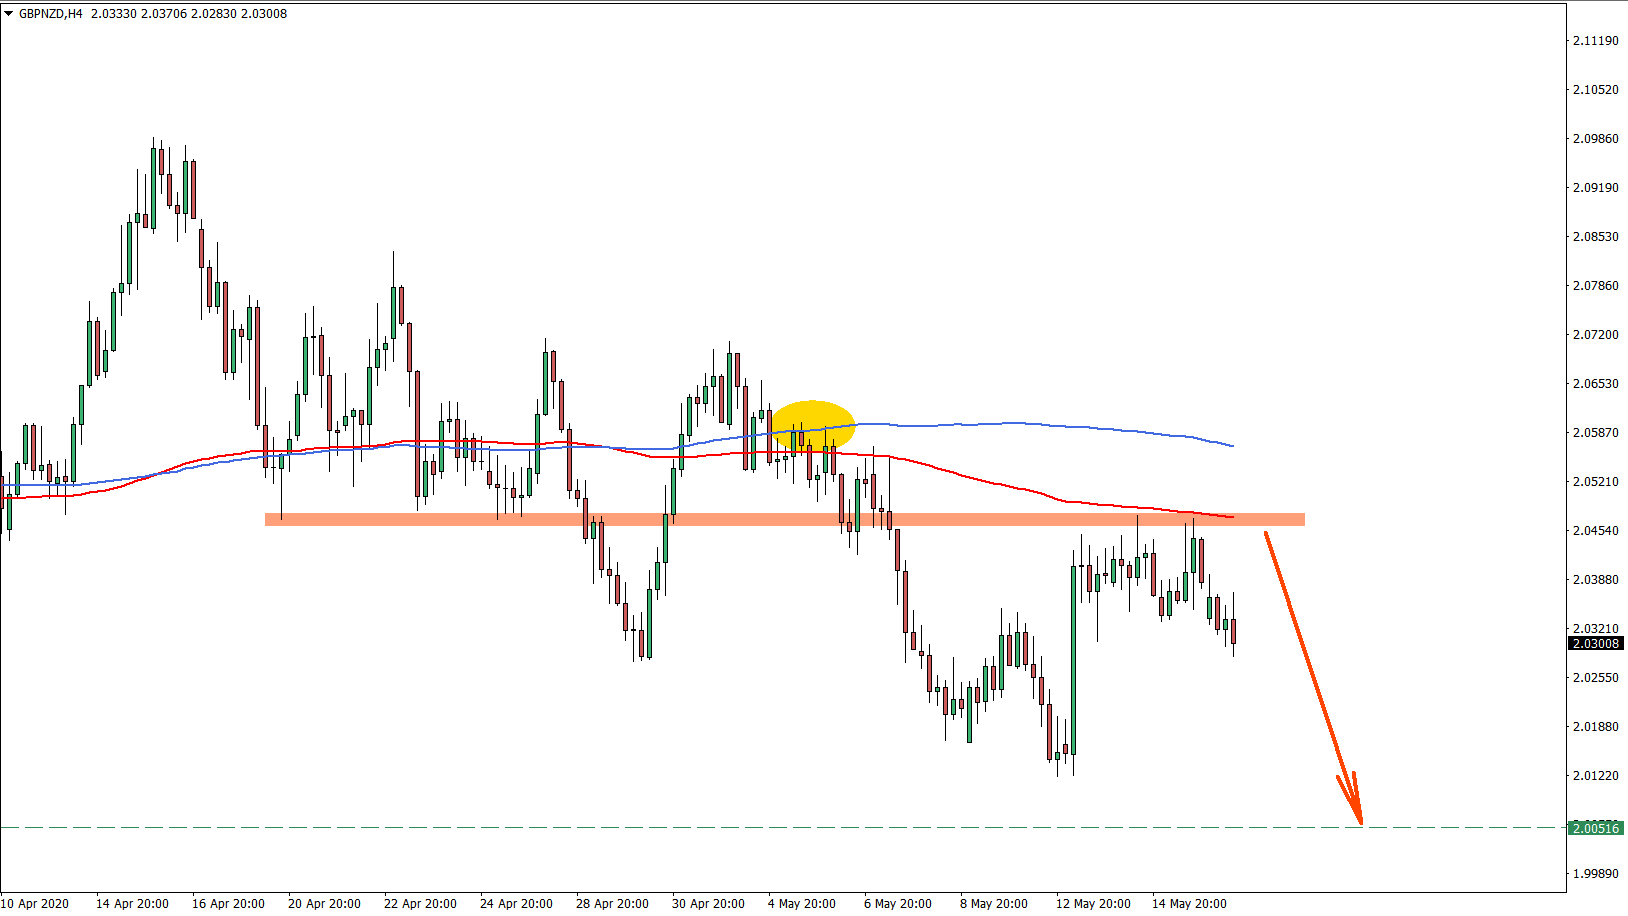
On the 4-hour chart, the price has reached the previous support level near 2.0470, which now is acting as the resistance. GBP/NZD really struggling to break above, and as long as price remains below both Moving Averages, price is highly likely to continue trending down.
Finally, on the 30-minute chart, GBP/NZD broke below both MAs, corrected up, and rejected the 200 EMA. At the same time, it has rejected 76.4% Fibonacci retracement level applied to the previous wave down. The rejection was very clean, followed by a small price drop. Perhaps this is the beginning of a downtrend continuation, as long as the 1.0370 is respected. The downside target from the Daily chart corresponds to the 561.8% Fibs applied to the most recent upside correction, making it the key support level if the price will continue to decline.
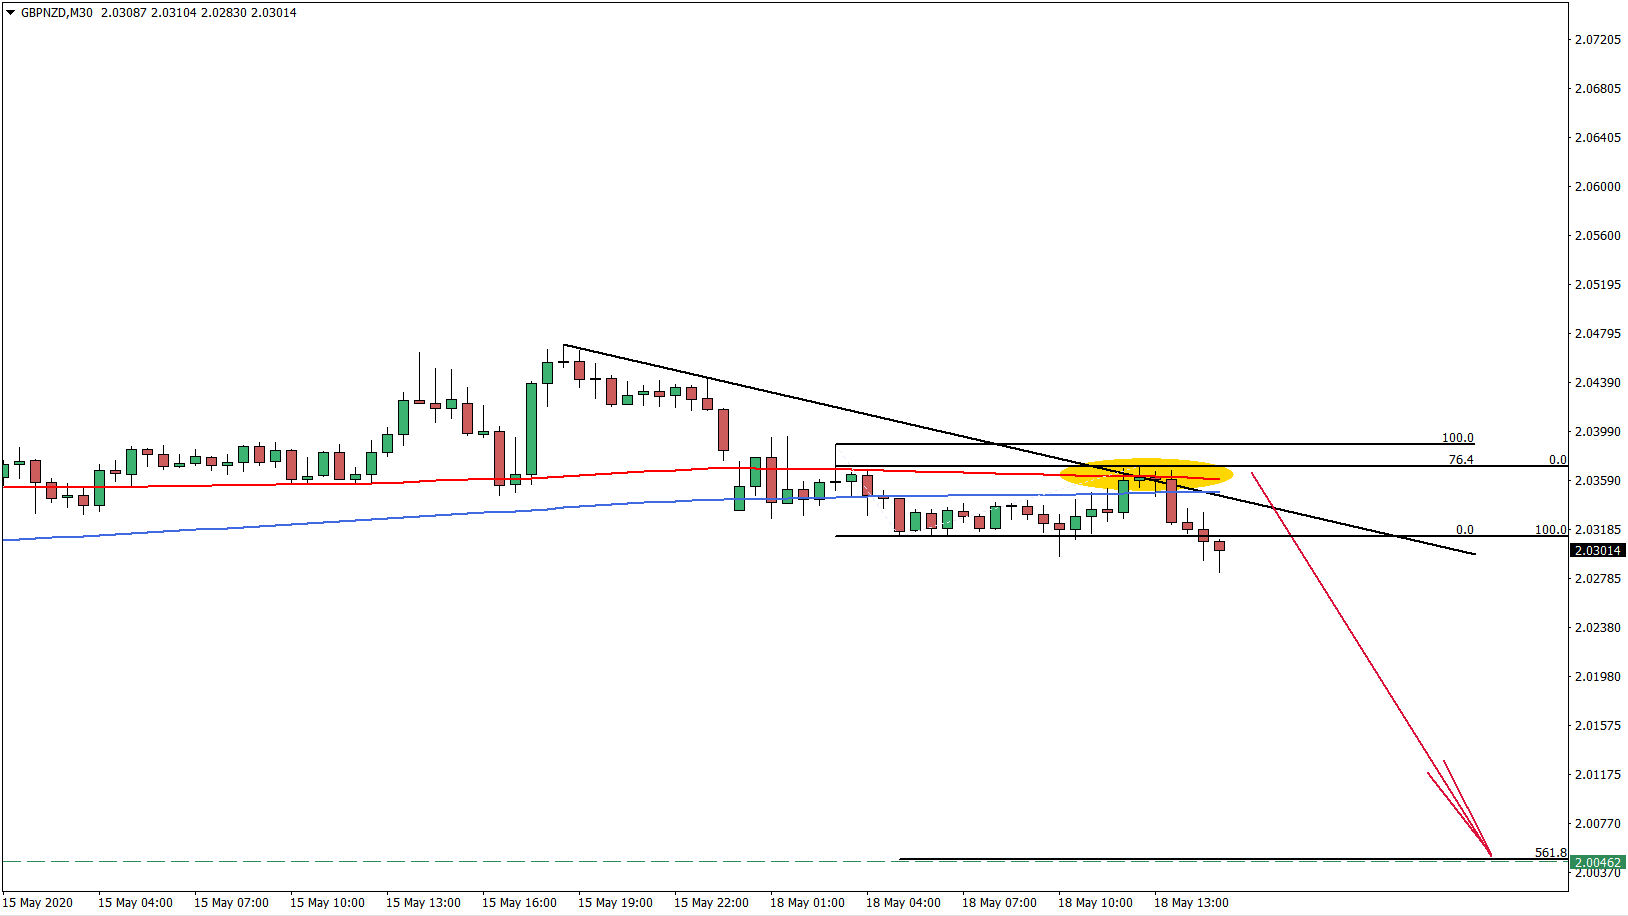
The selling opportunity is presented while GBP/NZD remains within the 2.0330 – 2.0370 zone. But at the same time, the ideal entry would at the previous level of the Fibonacci bounce, which is 2.0370. The exit signal or the first warning sign would be the daily break and close above the 2.0370, although complete invalidation of the bearish scenario would be upon a break above the 2.0600. The downside target is corresponding near the previously formed support, which is at 2.0050. But it is also possible that GBP/NZD will go lower to test the psychological level of 2.0000.


Leave a Reply