Part of the Japanese candlestick techniques, the hammer candlestick stands out of the crowd. While a single candle pattern, it sends a strong signal to technical traders.
Technical analysis as we know it today wasn’t always like this. In time, it suffered changes. A lot of changes.
It appeared first in the Western world. This is normal. In the U.S.A., traders built charts on paper and drew lines in pencil since ages.
As such, the United States is the birthplace of classical technical analysis. Patterns like the head and shoulders, bullish and bearish flags, double or triple bottoms…they form the classical technical analysis.
However, things changed. Technology advanced and personal computers appeared. Almost overnight, traders had access to computing power.
Charts that were impossible to read fast suddenly were interpreted easily. Plus, something else happened.
The Japanese approach to technical analysis considers candles. As transportation evolved, the Western world became aware of the Japanese ways to trade.
For Japanese technical traders, candlestick charts are a religion. They were quickly embraced in the Western world.
Nowadays, there’s no trading platform without the possibility to show candlestick charts. Hence, the Japanese candlestick patterns became popular.
Among them, the hammer candlestick pattern is special. It is so powerful than one candle is enough for a trade.
One candle tells much about the future price action to follow. Moreover, it represents the pillar of a sound money management system.
The funny thing is that a hammer candle shows a possible reversal. In fact, almost all Japanese candlestick patterns show that.
But, for a single candle to show a reversal, that’s something special. As such, traders must know what makes the hammer candle pattern unique. Moreover, how to trade it?
Defining the Hammer Candlestick Pattern
As a reversal pattern, the hammer candlestick is bullish. Therefore, it appears after a bearish trend.
It’s not possible to see a hammer candlestick in uptrend markets. The only way to have the same reversal pattern is when the market forms a hanging man candlestick. More about it a bit later.
But, before considering more details about it, there’s one thing to mention. Traders fail to recognise a proper hammer.
Any candle has two parts: the body and the shadow. The body is the difference between the opening and closing prices.
Therefore, a candle with a red body (bearish) has the closing price below the opening one. A green one shows exactly the opposite.
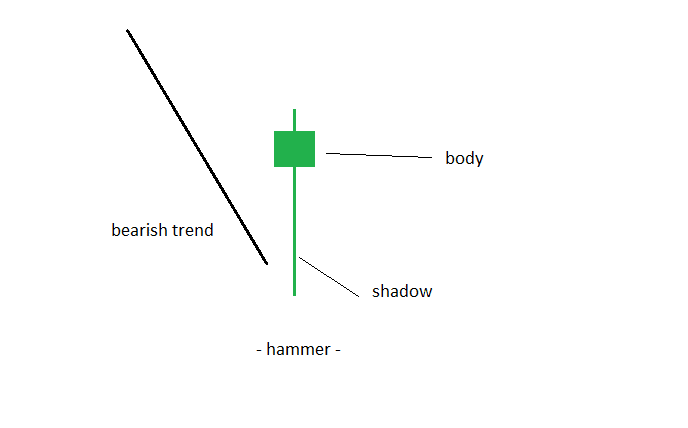
A hammer has a very long shadow. Impressively long.
It comes in sharp contrast with the long shadow. However, the body’s distance differs. But, there still needs to be a distance between the opening and the closing price.
As bullish candles, hammer candlestick patterns form only after bearish trends. Therefore, it shows a slight interest bulls take in a market.
But, bears won’t let it go that easily. So, a hammer candlestick shows a tough fight between bulls and bears.
If the hammer lows break, bears won. The bearish trend resumes.
However, if the lows hold, bears will run for the hills. So powerful the move will be that bears will capitulate shortly.
The image above shows a hammer candlestick that has a green body. But, the body could be red as well.
Traders must pay attention to its body. The distance between the opening and closing prices is key. A too small one and the candle is a Doji. That’s a different pattern.
How About an Inverted Hammer Candlestick?
While still bullish, this pattern deserves more attention. It shows bulls try to take control of a bearish market.
However, in doing that, the pattern differs from the classical hammer candlestick. Its body forms on the lower side of the candle.
As such, the long shadow forms above. Moreover, the inverted hammer candle comes after the market hints of a possible reverse.
Typically, it forms in contracting triangles. The way a contracting triangle forms allows for an inverted hammer to appear.
Most of the times, the candle appears as part of a group of candles. Sometimes, such a group forms a morning star.
Yet, even in a middle of a reversal pattern, the candle shows bullish conditions. But, it is more difficult to trade it as part of an integrated money management system.
Inverted Hammer Candlestick in Downtrend
A classic hammer candlestick pattern as the one showed above shows a powerful reversal. However, an inverted hammer candlestick may have the same effect.
Yet, the risk associated with trading the later one is bigger. Here’s an example.
Below there’s an inverted hammer candlestick on the monthly EURUSD chart. It forms somewhere in the middle of the chart.
The small green body and the upper green shadow makes this candle a powerful reversal one. However, traders treat it as part of a triangle. Therefore, all eyes are on the upper trend line.
The only way to trade this pattern is to wait for the upper trend line’s break. A proper stop loss must be at the lowest point in the inverted hammer candle.
And, no Forex trader will settle for a risk-reward ratio smaller than 1:2 or 1:2.5. Trading doesn’t make sense otherwise.
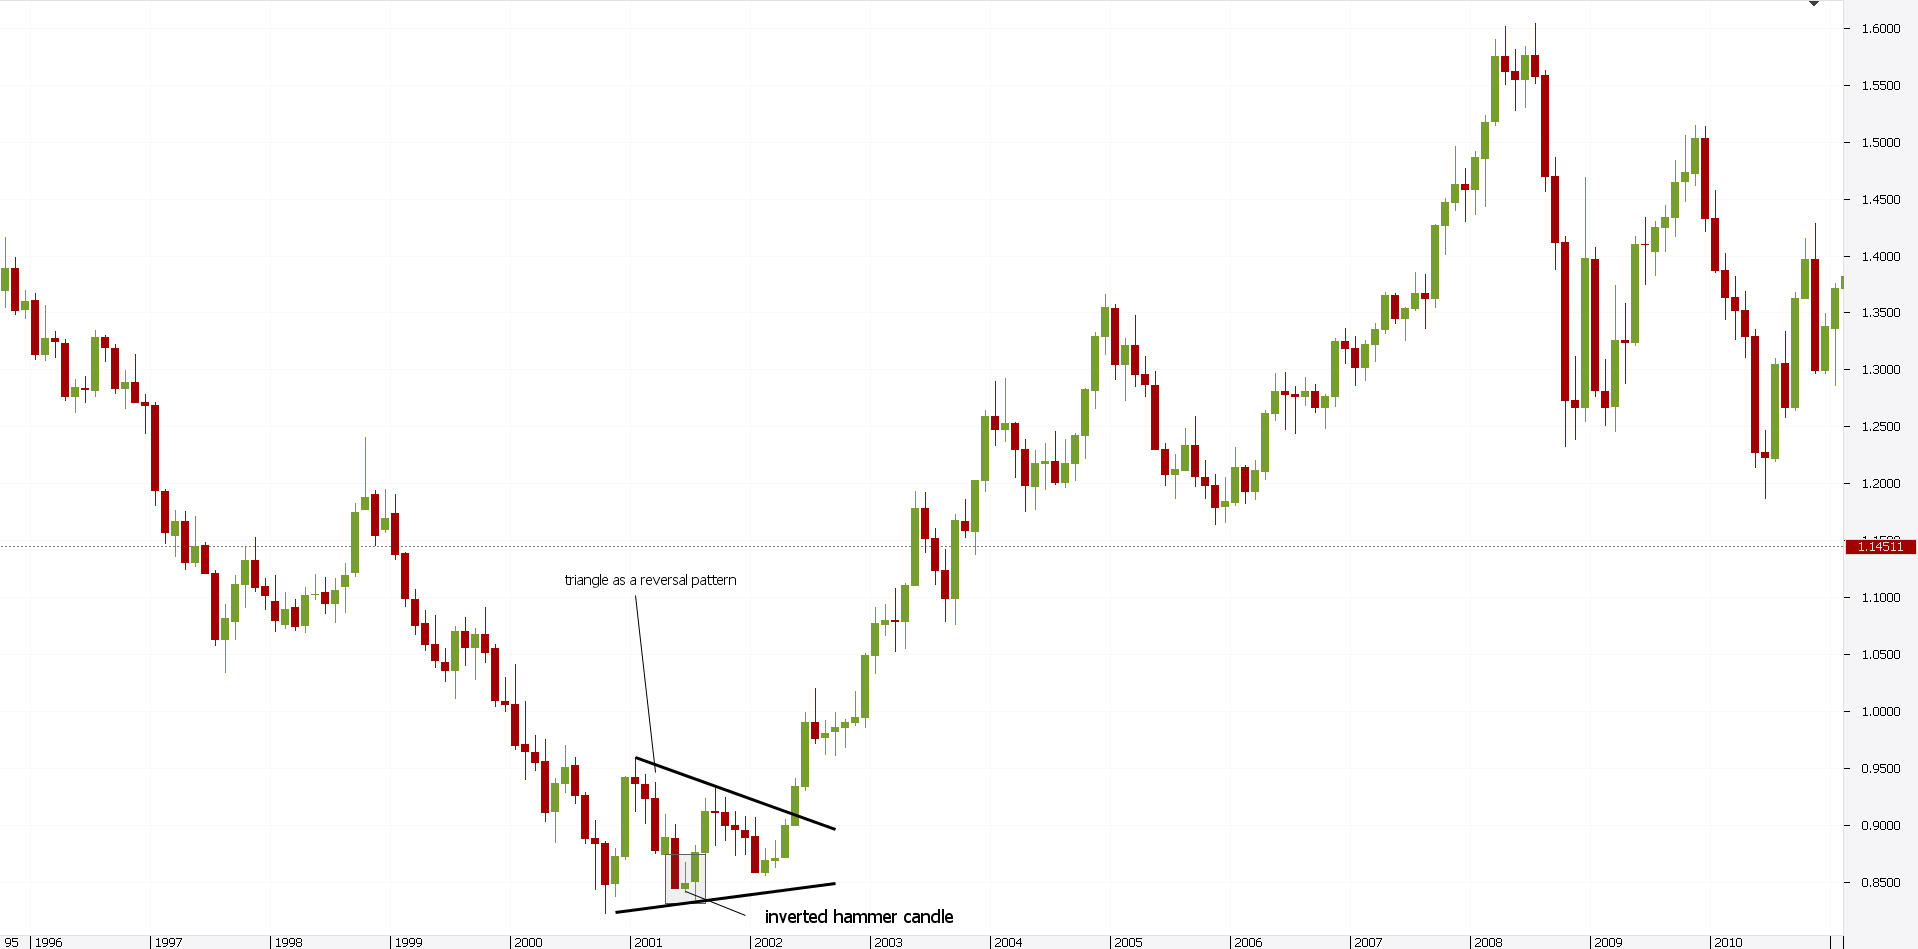
Trading the hammer candlestick chart above doesn’t give the perfect trade. While the trade ends in profit, the risk on the monthly chart raises question marks.
On lower time frames, this works like a charm. How about the bigger ones? Is there a strategy that allows for a better entry? With a smaller stop loss? And, more importantly, having the same results?
The answer is yes. When traded properly, hammer candles have such results.
How to Trade a Hammer Candlestick?
The beauty of a hammer candlestick chart pattern comes from the way to trade it. Because it shows a fight between bulls and bears, traders know where to set the boundaries.
Or, the rules of the game. Of the fight.
First, a bearish trend must exist. Second, the bullish hammer candlestick forms. Look for a strong and powerful shadow.
The candle’s color doesn’t matter. It can be red or green, the outcome is similar.
One of the biggest mistakes traders do is to consider a hammer candlestick unbreakable. This is not the world we, as traders, live in.
Price action most of the time shows consolidation area. Be it before an important economic release of the Non-Farm Payrolls, or ahead of an important speech…there’s always something the market will focus on.
Moreover, algorithmic trading buys and sells based on a pattern recognition approach too. As such, the lows in a hammer candlestick are targeted.
Anyways, the hammer shows a battle. And, because of it, look for a retracement before going long. Sometimes that may not come. But, it comes more often than many think.
The Golden Ratio in a Hammer Candlestick Chart Pattern
The Fibonacci golden ratio, the 61.8% appears almost everywhere in technical analysis. Traders use it to find proper entries/exits in a trade.
While the hammer candlestick meaning shows bullish conditions, the market doesn’t rise in a straight line. To be honest here, sometimes it does. But, that is not a trade I would like to take.
What serious traders (a.k.a. traders that use an r:r ratio bigger than 1:2.5) look for is a pullback. Namely, after the hammer candlestick, look for the market to pull back a bit.
After all, if this is such a tough fight, bears won’t give up easily. Right?
Such an approach bodes well with any money management system. Firstly, it allows traders to use pending orders. Secondly, it gives a stop loss. And, finally, a great risk-reward ratio.
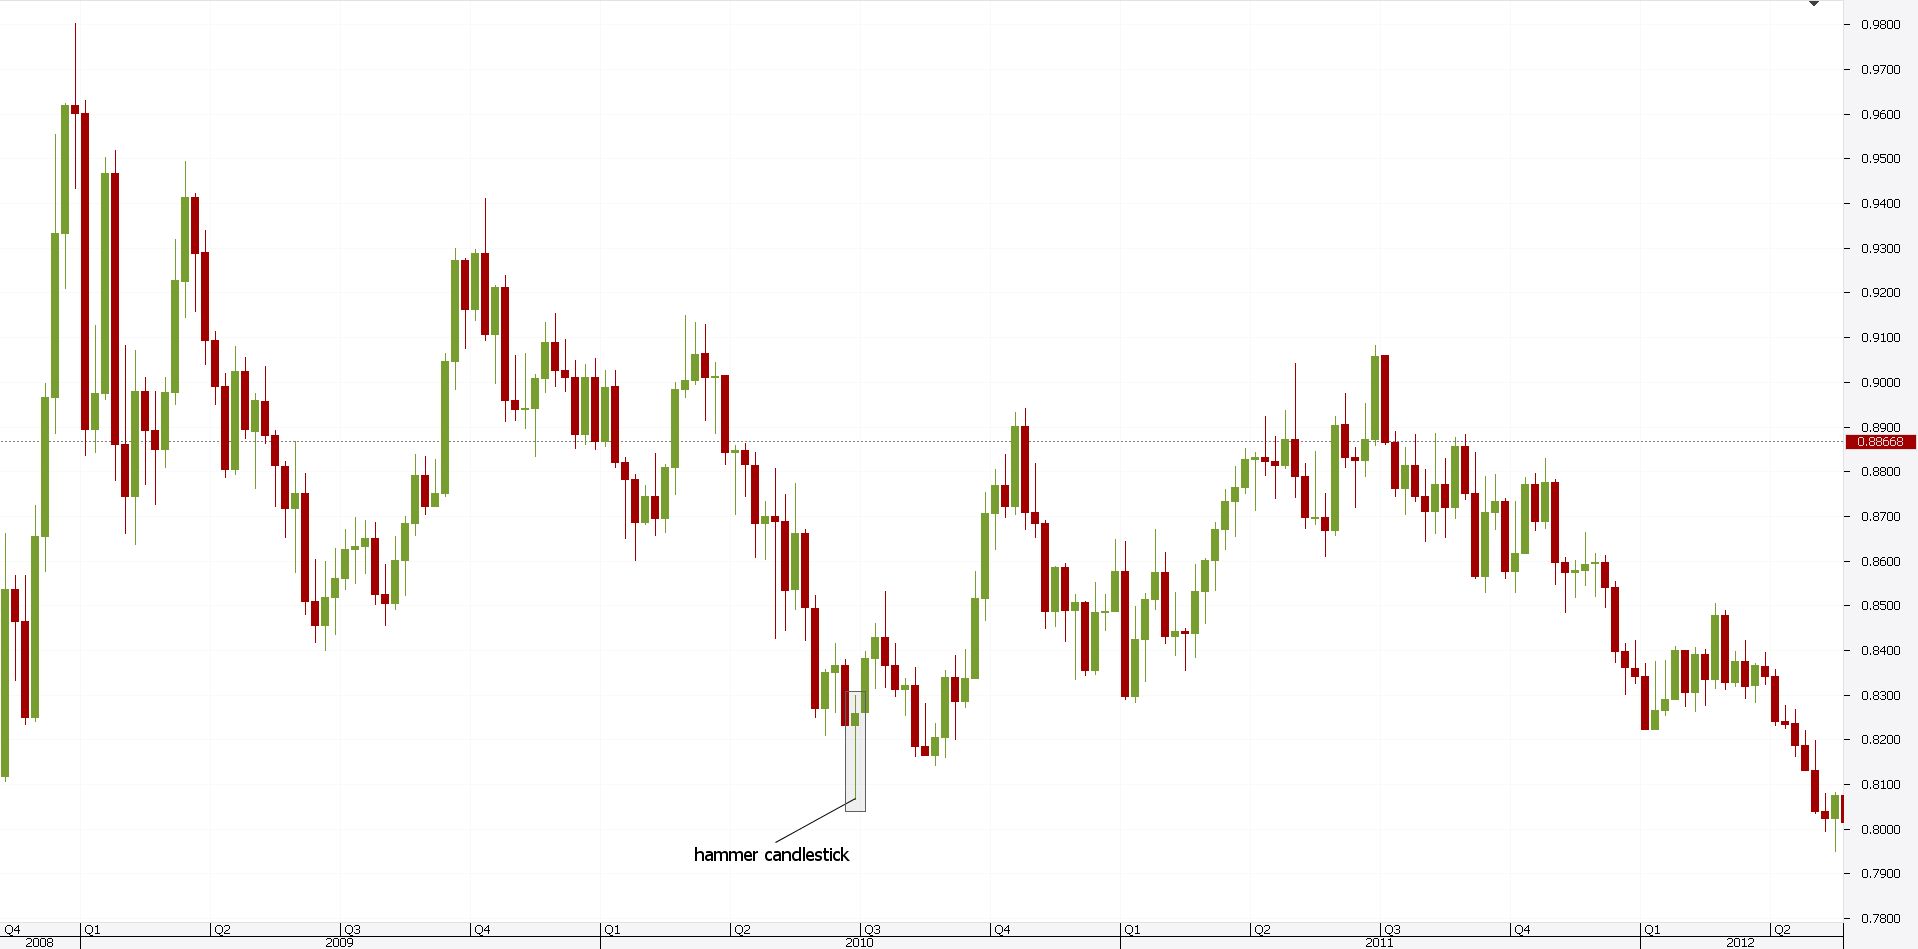
Take the EURGBP chart above. There’s a bearish trend that started on the top left side of it.
As such, traders look for a hammer candlestick. Before long, it appears. After two more candles (weekly candles, in this case), the market reverses.
The next thing to do is to use a Fibonacci Retracement tool. The idea is to find out the 50% and 61.8% retracement level.
That’s the entry point for a long trade. The stop loss must be set at the lowest point of the hammer candlestick.
If it gets hit, so be it. Embracing losses is part of a sound money management system
If the risk-reward ratio makes sense, traders end up on the right side of the market.
A 1:3 risk-reward ratio easily reaches the take profit. As such, for every winning trade, there are three losers and still, the trader breaks even.
Hammer Candlestick Pattern Real Video Trading Example
After I showed you the structure of the Hammer candle pattern, I believe it is a good idea that I show you a real trade in action. This way you will have the opportunity to see the exact way this candle pattern works and to learn how to take advantage of it.
Below you will find a video that shows a Hammer candle formed at the lower level of a bearish channel. This made me think that the price is very likely to reverse and to run to the upper level of the channel. This is why I tackled this situation with a long trade that brought profit for relatively good period of time.
What is a Shooting Star Candlestick?
Those are chances every trader want to take. But, the hammer candlestick is powerful. That is especially true when it forms on the bigger time frames.
Because of that, chances for such a trade to survive increase with the time frame. The bigger the time frame is, the more powerful the hammer candlestick is.
Shooting star candles look exactly like an inverted hammer candlestick. With one difference: they form at the end of a bullish trend.
Therefore, the way to trade a hammer works in this case too. But, a bearish trend is more powerful than a bullish one.
This is normal. When the price of a security moves, traders get caught in up or down markets.
A bearish market always has a panic feeling associated with it. Because of that, the falling angle is steeper than the one in a bullish market.
Having said that, the shooting star candlestick pattern is more difficult to trade. I mean, we should still wait for the price to retrace 61.8%.
However, because of the panic effect explained earlier, it may never come. Yet, rules are rules.
On the long run, it ends up being riskier to jump in a trade without the shooting star candlestick patterns to be retraced 50% or 61.8%.
Shooting Star Candlestick Chart Pattern Example
The chart below illustrates the difference between a hammer candlestick and a shooting star. Moreover, it shows why a bearish market is more aggressive.
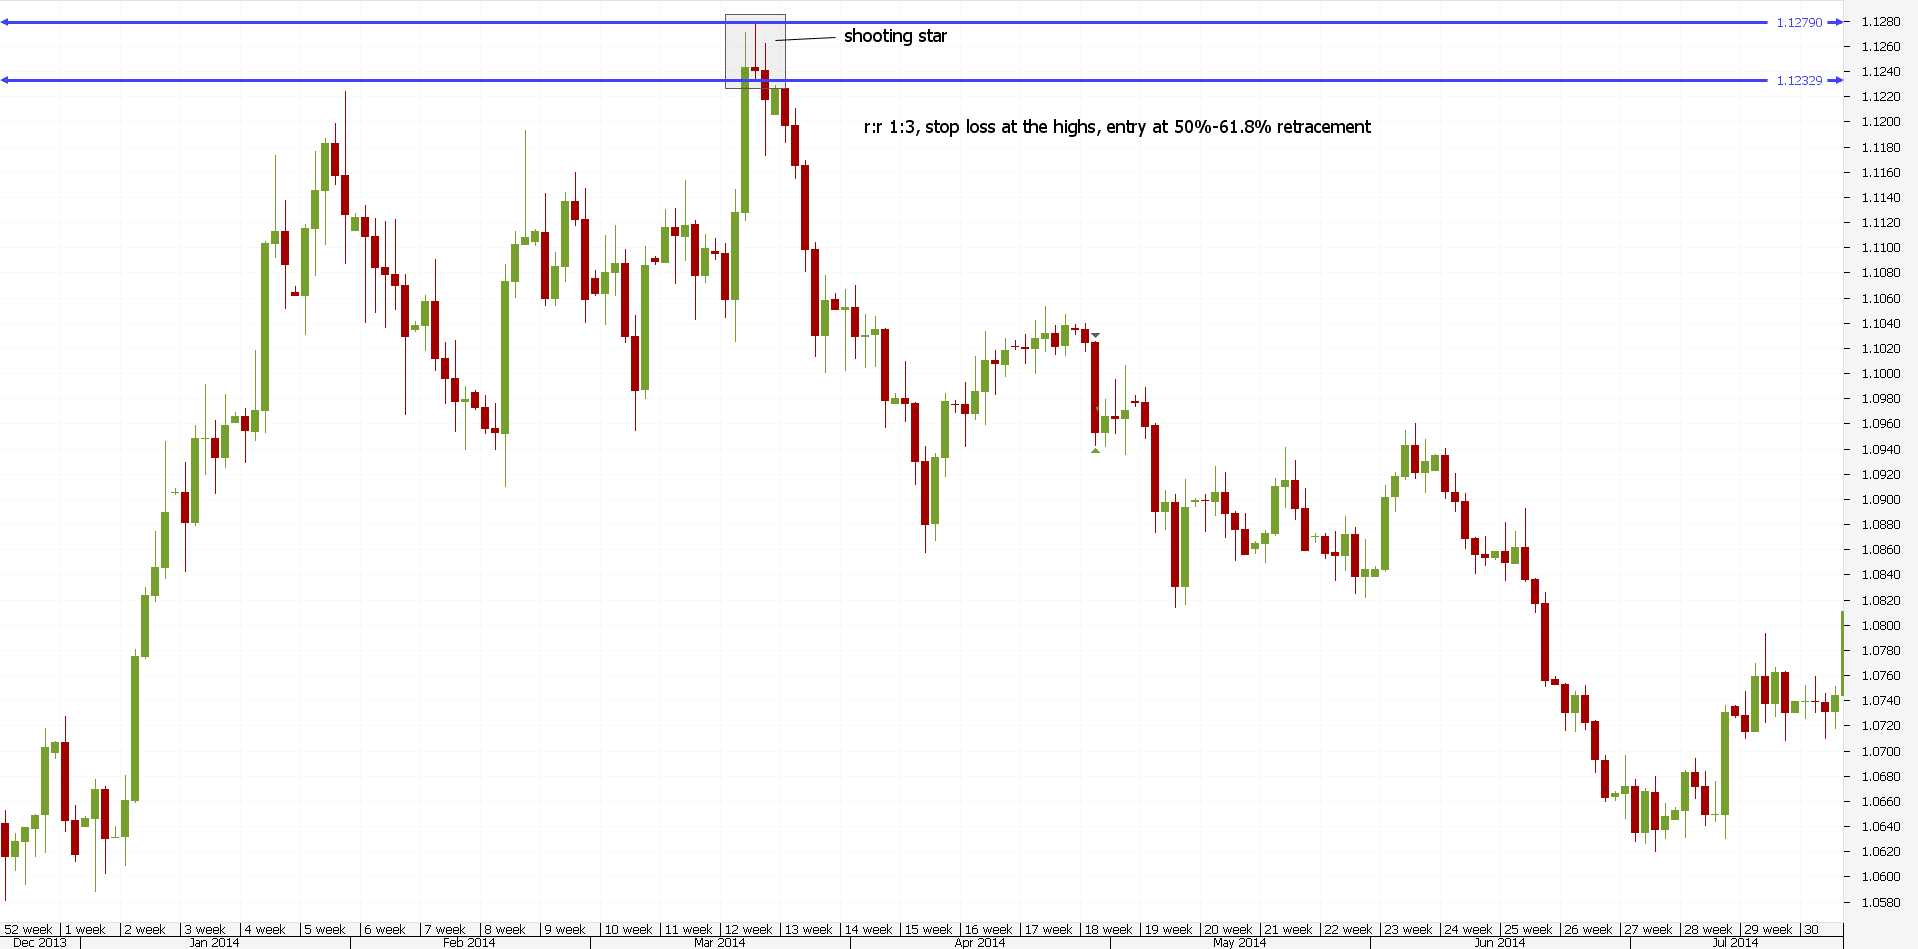
This is the daily USDCAD time frame. Quite a bigger time frame!
The idea behind trading shooting star candlestick patterns is to sell against the top. Because of the way the candle forms, the top is the high of it.
As such, that’s the stop loss in any trade. The price action that follows shooting star candlesticks will give a short trade at 50%-61.8% retracement.
The Fibonacci ratio applies to the length of the shooting star candle pattern. Of course, the risk-reward makes the difference here too.
In this case, a 1:3 rr ratio comes faster to the target. As explained, the panic effect in a bear market overcomes complacency in a bull one.
Because of high-frequency trading algorithms, stops get triggered on the lower time frames. But, the bigger ones show nice setups.
The beauty of trading a hammer candlestick or a shooting star comes from the setup. If one looks on the bigger time frames, like daily and beyond, trading just became easier. Much easier.
As such, chart analysis can take place over the weekend. Just look at the Forex dashboard and run a candlestick chart on daily, weekly and monthly.
When a setup appears, Monday’s opening is the perfect place to place pending orders. Of course, the risk should be adjusted with the time frame.
As a rule of thumb, the bigger the time frame, the smaller the volume traded. However, because of the risk-reward ratio, the results are as good as on the lower ones.
Explaining the Hanging Man Candle
The hanging man candlestick pattern is the opposite of an inverted hammer. As such, it appears at the end of a bullish trend.
It is still just one single candle. In fact, if you look for similarities, hanging man candlestick patterns appear like the candle below.
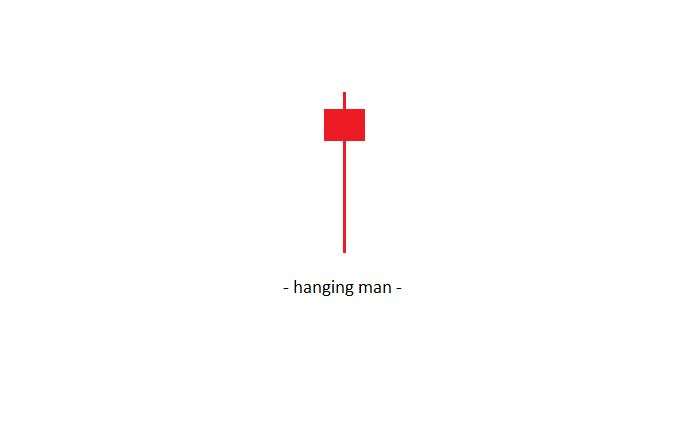
What’s different than the hammer candlestick? Nothing.
That is, there’s nothing wrong with the candle. But, the hanging man candle pattern, as shown above, appears after a bullish trend.
Again, a triangle as a reversal pattern acts like the perfect indicator. Right in the middle of it, the hanging man forms.
The name is hilarious. To say the list.
The candle is either green or red. Again, this doesn’t influence the outcome.
Like it was the case in the inverted hammer, the hanging man is difficult to trade with an aggressive setup. The bulls will try to take the highs.
Therefore, stay on the bigger time frames. Better safe than sorry, right?
One thing it should be mentioned here. That is one thing about the hanging man and the hammer candlestick.
Avoid Daily Timeframes with GMT Prices
This may sound strange. But, lately, Forex brokers try to get rid of the Sunday candle.
Like it or not, on Sundays, trading occurs. For a few hours, in New Zealand, early buyers and sellers open new positions and close old ones.
While the liquidity is not the ideal one, trading takes place. When you need to enter/exit a market, the price doesn’t matter. If the market is open, you’ll plunge.
Brokers that still show the Sunday candle use GMT prices as a reference. But, because trading takes place only for a few hours, the candle is a small one.
In other words, a hammer candlestick or a pattern derived from it appears. To avoid that, simply skip the daily chart. If not, trade with a smaller risk.
Conclusion
The central piece of this article should be the hammer candlestick. The rest of the patterns derive from it.
If traders understand its importance and how to trade it, great opportunities arise. Just keep things simple.
Like in life, this works in trading too. Simple things work best.
What better way to trade than with a hammer? Or a shooting star?
One single candle gives disciplined trades. You know this is more important than anything.
Managing risk is everything. If your trading system doesn’t have a big enough risk-reward ratio, trading is a waste of time.
But, the risk-reward ratio matters. Go for realistic ones. Everyone wants a 1:10 risk-reward ratio. Sometimes, the hammer candlestick pattern gives such trades.
Yet, they don’t form so often. The market spends most of the time in consolidation.
Even the Forex market. Despite its huge liquidity, trends appear only when macro economics change.
Or, when central banks change the language, from hawkish to dovish. Or, the other way around.
Look for a hammer candlestick confirmation to happen when the price reaches the target.
Such a disciplined approach works in an inverted hammer candlestick formation too. But, having a bigger risk.
Of all Japanese candlestick patterns, the hammer deserves a special place. It is, by far, the most popular one.
Yet, traders fail to trade it properly. This is because greed and fear take control of a trading setup.
Fearing a loss, traders don’t place the stop loss anymore. That’s deadly for the trading account.
By the time the hammer candlestick breaks bears won. They’ll push prices even lower.
The same goes for the shooting star pattern. By the time bulls trip the highs, the market will push for some more.
Only a disciplined approach works. As such, make sure you always use one.
START LEARNING FOREX TODAY!
- Hammer candlesick
- Hammer candlestick pattern
- Hammer Reversal Candle Trade
- inverted hammer candlestick
- reversal patterns
- shooting star candles
- shooting star candlestick
share This:


Leave a Reply