In Forex trading, sometimes simplicity and recognizing easy-to-spot patterns can pay off big. The hammer candlestick is one of them, being the most recognized formation by Forex traders.
The hammer candlestick is a reversal pattern of bullish nature that consists of a single candle with a small body and a long shadow. The open, high and close prices of the candlestick are roughly at the same level. In conjunction with other Forex technical analysis tools, the hammer can signal an opportunity to place a buy trade.
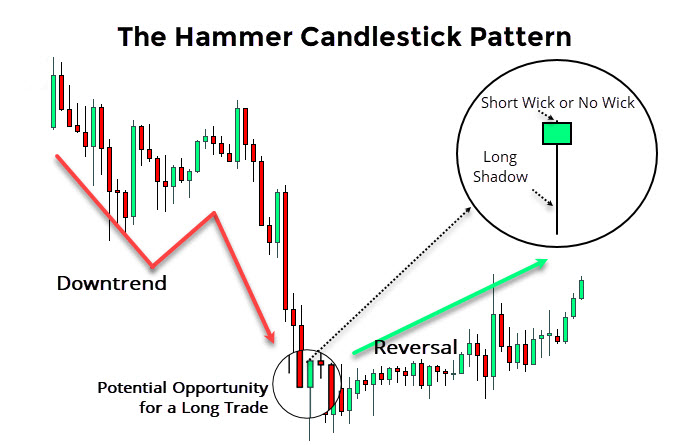
The hammer tells traders that the market may be reversing and the current downtrend may be over. In this article, we will review the characteristics of this price formation, how to spot it. More importantly, we will describe in detail how you can trade it.
Table of Contents
Characteristics of a Hammer Candlestick
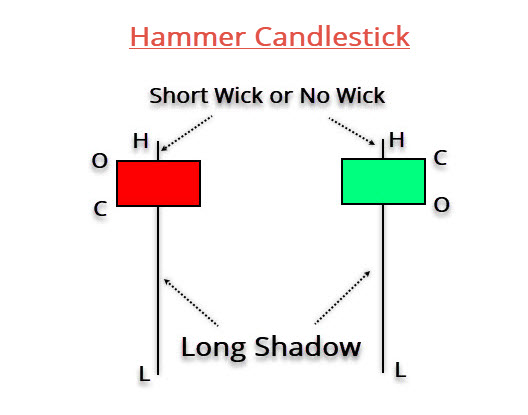
The proximity between the open (O), close(C) and high (H) prices gives shape to the small body of the hammer. Ideally, the shadow extending downwards should be twice the length of the body. The longer the shadow, the stronger the pattern usually is. Also, the low (L) price is also the lowest price level in a downtrend.
A green-colored hammer indicates a more substantial reversal, since the price closed above the opening price, contrary to the red-colored candle.
Why is it Bullish?
Traders consider hammers as bullish reversal patterns since they tend to trigger the trend direction change. There is a significant bullish development because the bulls forced a higher close, despite the efforts from the bears’ side to push the price further to the downside.
The hammer candlestick pattern signals a potential reversal as the bears printed a low and were successful in extending the trend lower. However, they were surprised by the bulls’ strength to push the price higher and force a higher close.
As a result, the market tells us that we may have a short-term bottom in place.
How to Spot it
When it comes to trading the hammer candlestick formation, the first step is to look if the pair’s trend is to the downside (see chart below). We should aim for a clear pattern of lower highs and lower lows in place.
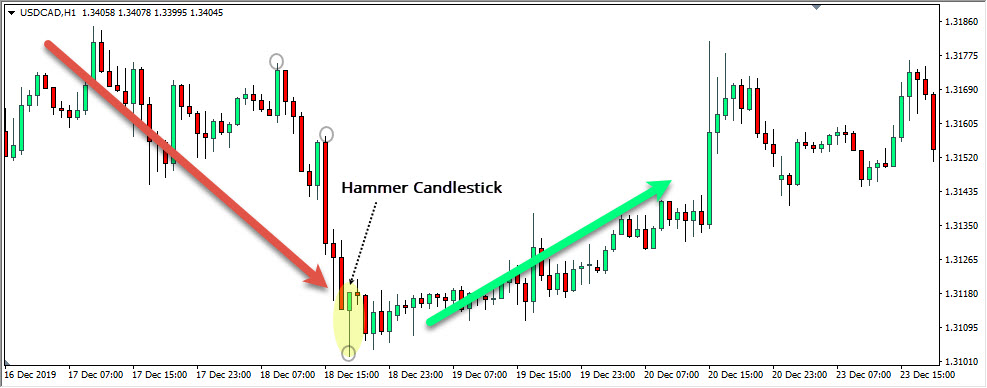 USD/CAD H1 chart – How to spot a hammer candlestick pattern
As we see above, the price creates a fresh low after printing a series of lower lows before it reverses higher. In this case, the high (H) and the close (C) prices are at the same level, making the candlestick pattern very powerful. You can also notice the long shadow, which is two or three times larger than the candle’s body.
How to trade a Hammer Candlestick
Let’s break down the potential trading opportunity into manageable steps.
Firstly, the price action breaks below the previous low by approximately 15 pips to create a new low at 1.3102. However, the bulls finally respond by pushing the price action higher to close near 1.3117.
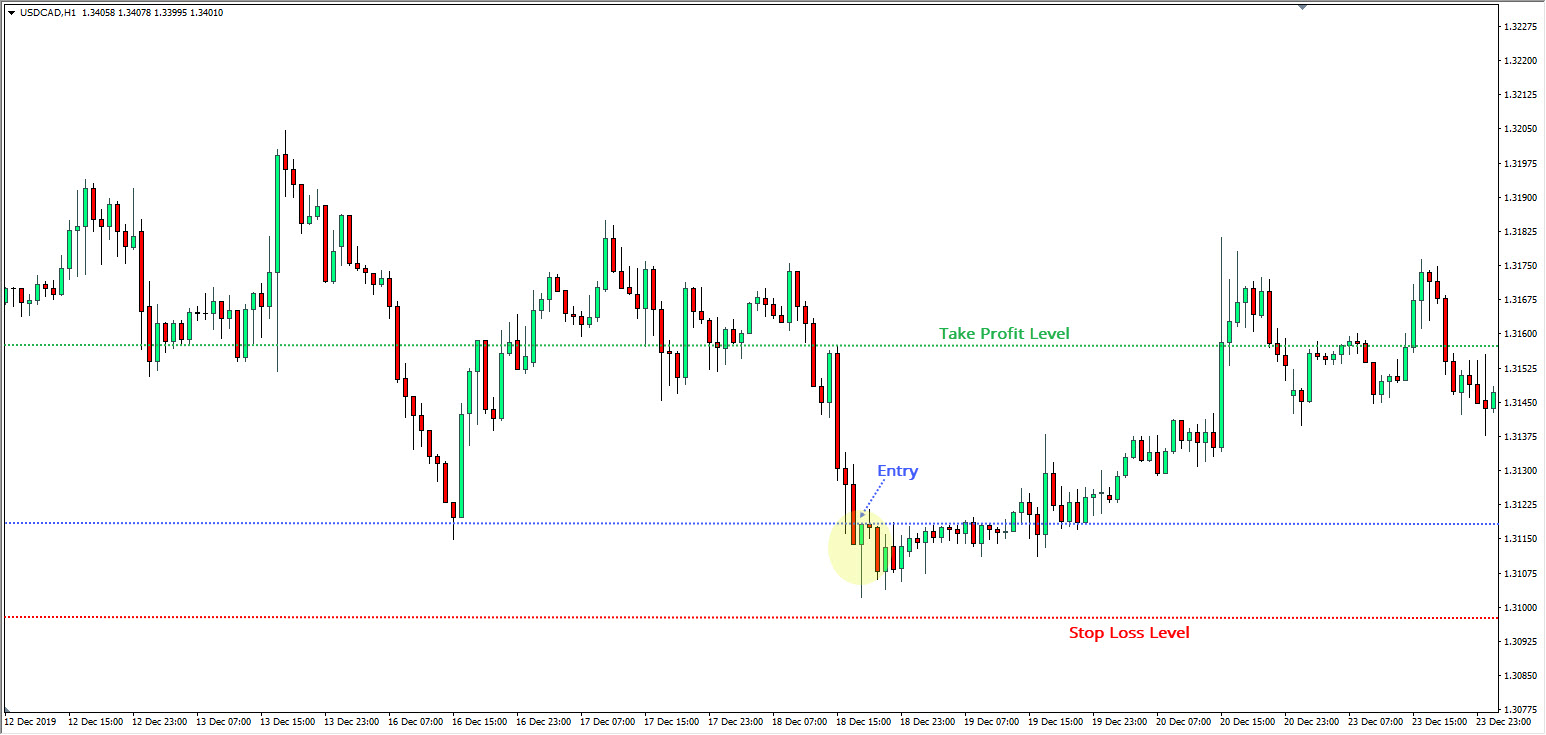 USD/CAD H1 chart – How to trade a hammer candlestick
Moreover, the close is higher than the previous swing low, which provides the bulls with fresh optimism and confidence to keep the upside momentum.
Similar to other single-candle patterns, you can wait for a confirmation represented by the next candle, which provides further validation of the pattern. However, with a hammer pattern the reversals tend to be so strong that if you wait for the second candle to close to enter a trade, it may be too late.
Then you will need to consider the following paths:
- Either wait, play it safe and make less profit.
- Or risk a bit more by entering a trade once the hammer pattern consolidates fully.
Another approach may be to consult other technical indicators to validate the idea of a short-term bottom, and then decide whether to open a trade or not. This could include assessing the potential upside by adding a volume indicator.
In case you decide to go forward, you should place the buy trade at the point where the next candle opens.
The StopLoss should be placed a few pips below the low price (L) to allow for another potential test of the previous low. A clean new low invalidates the pattern as the downtrend could resume.
The TakeProfit order should be placed on previous support and resistance levels.
In this case, the first profit-taking level is located around 35 pips above the entry, which coincides with previous horizontal support in the past. Hence, we are risking 18 pips to make 35, which makes the risk-reward ratio roughly 2:1.
Finally, the price action hits our profit target before it eventually moves lower again. For us, the bounce was enough to capitalize on the short-term trend direction change.
Strengths and Weaknesses
As outlined earlier, a hammer conveys an essential message that the downtrend is likely to end soon. The message should be used by the bearish traders to cover their short positions.
Also, those who are looking to capitalize on the trend direction change by can buy the currency pair.
A higher volume behind the hammer candle is also a secure sign of the reversal. There is a strong buying demand behind the pair because the short-term bottom is likely in place now.
The pattern is considered to be amongst the most reliable and effective candlestick formations. The low price level helps traders to see support and demand levels.
Differences between the Hammer and other candles
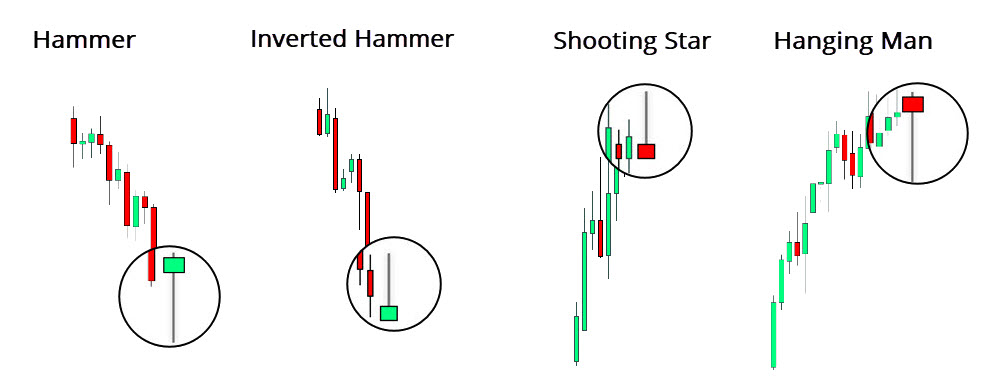
Given that it’s a one-candle pattern, the resemblance with other candlestick formations is high. The hammer candle looks quite similar to a hanging man and an inverted hammer.
Although a hammer has the same shape as the hanging man, it is a bullish reversal pattern that occurs at the bottom of a downtrend, while the hanging man is a bearish formation located at the end of the uptrend. Both send the same message; a reversal may soon take place.
On the other hand, a hammer turned upside down, with a wick extending to the upside, is known as a shooting star candlestick pattern. Unlike a hammer, the shooting star is a bearish reversal pattern that is a sign of an ending uptrend.
The image below shows that the wicks are extending upside as the bulls were unable to force a close near the candle’s high. In contrast, the bears push the candle’s closure at the bottom, opening the road for a change in the trend direction.
Summary
A hammer candlestick pattern is a bullish formation that occurs at the bottom of the current downtrend and signals that the price action may change its direction soon. It is characterized by the long shadow extending downside. Having the open, close, and high – all near the top of the candle.
The candle’s low is likely a short-term bottom for the pair as the bulls have managed to push the price action higher and force a close near the candle’s opening price. The pattern is important since it signals a change in the trend direction, as the bears are losing control over the price action, and the bulls are growing in the game.
Finally, it is essential to know the difference between the hammer, the hanging man and the shooting star. Although they have the same shape, the former is a bullish reversal pattern, while the latter signals a bearish development as it occurs at the top of the uptrend. Finally, we have the shooting star, which is a bearish reversal pattern (same as hanging man), and it looks like a hammer turned upside down.


Leave a Reply