Doji candlesticks are some of the most common candles in price movements. As open and close are the same, or nearly the same, doji candles are usually interpreted as neutral candles, although their appearance near tops or lows can signal impending reversals.
The dragonfly doji is one of the more powerful doji patterns. It’s characterized by a long wick that extends to the downside, while the open, high, and close are almost identical in price. The appearance of the dragonfly doji signals a potential reversal in the price action. This pattern is especially powerful if it appears near the lows or highs, while it should be ignored if it occurs in the ranging and sideways markets.
In this guide, we will:
- Explain the structure of the dragonfly doji candlestick pattern
- Look at pros and cons of this formation
- Share tips on how to easily spot the dragonfly doji
- Go step-by-step in sharing a dragonfly doji trading strategy
Table of Contents
Dragonfly Doji Structure
The dragonfly doji is a reversal pattern that usually takes place near the highs or lows in trending markets. As a doji formation, it signals indecision, as the fight between buyers and sellers doesn’t yield a clear outcome.
This formation is produced when the high, open, and close are nearly identical in price. The key characteristic of the dragonfly doji is the long long wick that extends to the downside.
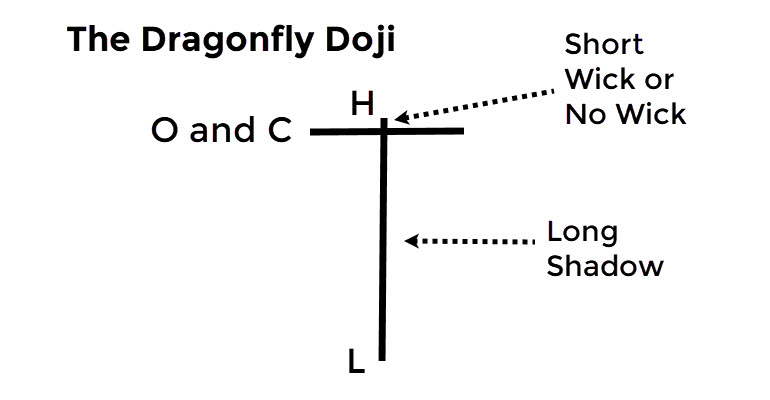
Dragonfly Doji Structure
As such, the dragonfly doji is the opposite of gravestone doji, given that the open, high, and close are near the top of the candle. As you can see in the illustration above, the dragonfly doji has a “T” shape.
It is important to note that this formation can take place in the uptrend and a downtrend. When it occurs in a downtrend, the long wick lower signals the sellers failed to close near the lows and the trend may reverse. For this reason, this is considered to be the most powerful dragonfly doji.
On the other hand, the appearance of the dragonfly doji in the uptrend shows that the bulls’ momentum is fading. This is because the sellers were briefly in control of the price action as the price traded lower to create a long wick.
Advantages and limitations
The key advantage of the dragonfly doji pattern is that it signals a potential reversal in the price action. Its occurrence at the top of an uptrend, or near the lows of a downtrend, shows that the dominant market force is running out of gas.
For the same reason, the appearance of this formation in ranging markets and sideways price action doesn’t have the same effect. In these circumstances, the market is telling us that the sideways action may continue as there is still no clear outcome in the bulls – bears struggle.
The main weakness of the dragonfly doji is that it doesn’t occur often. It’s very rare to find a candle where the open, high, and close are identical, or very close to being the same. Once identified, and confirmed by other technical indicators, a dragonfly doji can generate powerful reversal signals.
Of course, the dragonfly doji could end up generating a false signal. For this reason, it is always important to cross-check signals from the dragonfly doji candlestick pattern with other technical indicators, namely Fibonacci retracements and extensions, moving average, pivot points etc. This way, you are looking for a confluence in signals that will verify that the reversal will most likely follow the creation of a dragonfly doji candle.
Resemblance to other patterns
A dragonfly doji looks almost identical to a hanging man or a hammer candlestick pattern. When it takes place in a downtrend, a trader should note the difference between the dragonfly doji and a hammer candlestick.
The former has almost no body, as the open, high, and close are identical. The latter usually has a close that is at the top, signaling that the buyers have forced a higher close. Both the hammer and the dragonfly doji have wicks that extend lower. Moreover, both patterns send the same message – the sellers may have lost the momentum and a reversal should happen soon.
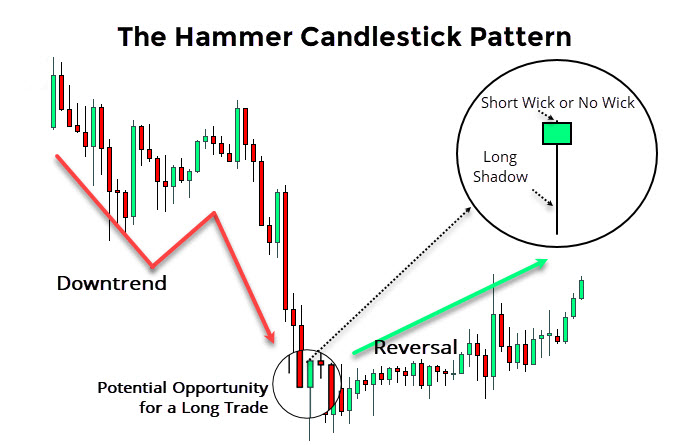
The Hammer pattern
On the other hand, the dragonfly doji differs from the hanging man despite both taking place at the top of an uptrend. Similarly, the hanging man has a body while the wick shoots lower. Hence, you should simply focus on seeing how the body of a candle looks to make a difference between these three candlestick formations.

The Hanging man pattern
It is important to know the difference as both the hanging man and the hammer point are more powerful patterns. As noted earlier, all doji patterns are primarily neutral candlestick patterns, although their appearance at the top or near the lows signals a likely reversal.
How to Identify and Trade The Dragonfly Doji Pattern
As we noted above, the dragonfly doji has a long shadow that extends lower, while the high, open, and close are ideally identical. Of course, it’s difficult to expect to find candles where these three elements are at the same price. For this reason, analysts allow for a minor deviation in the price of these elements.
Spotting the dragonfly doji candle
In a daily chart below, we see USD/CHF trading sideways on the left side of the chart. Still, the sellers are in control as they force the price action to trade lower on three different occasions. The blue arrow points to a dragonfly doji candle. As you can see, the candle is very easy to spot.
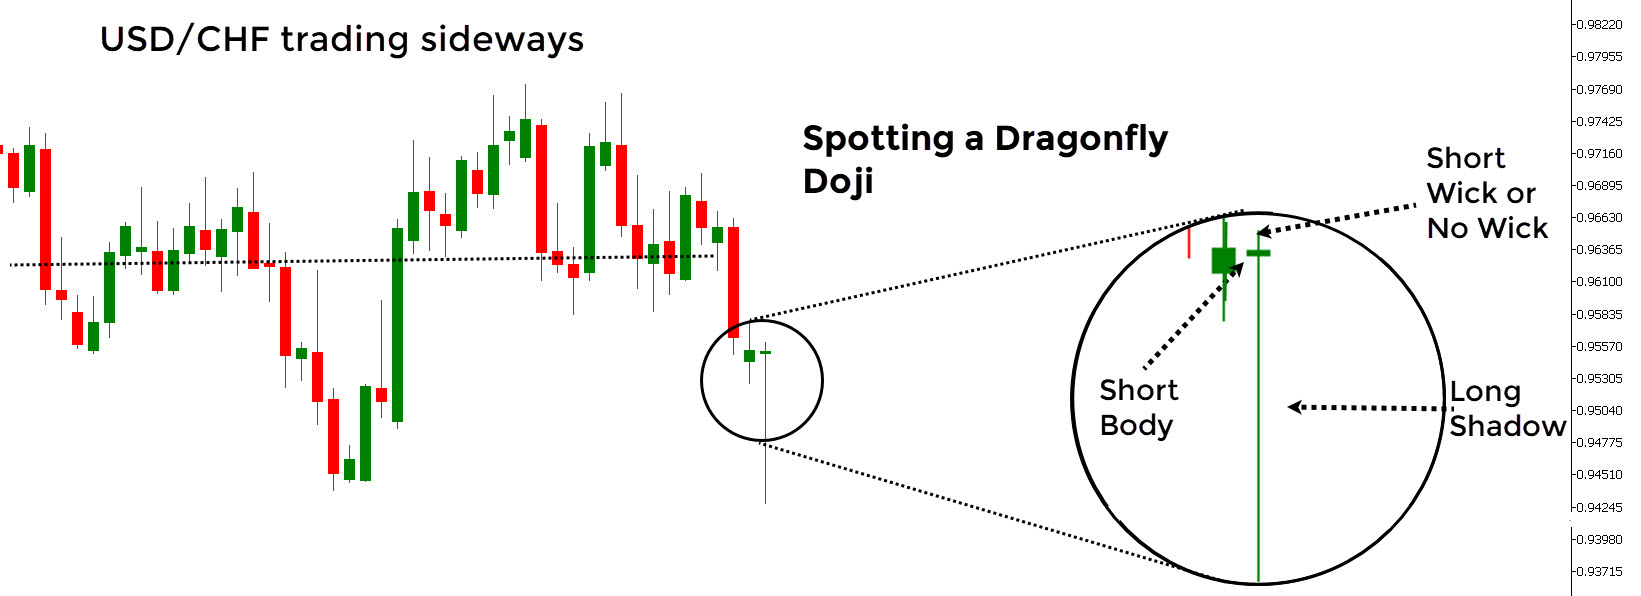
Spotting the dragonfly doji candle – USD/CHF daily chart (Source: MetaTrader 4)
What makes it easy to spot is the long shadow to the downside. First, you should focus on identifying candles with a long wick to the downside. The second step is to check the body of a candle. As said earlier, this is the key difference between a hammer candle and the dragonfly doji.
Some traders also believe that you should wait for the next candle to confirm the reversal, before entering a long position. If the next candle is a bullish and powerful candle, then the reversal has most likely started.
Trading the dragonfly doji candle
Once spotted, we move to define our trading setup. As it is the case with any other candlestick pattern, it is always advised to check other technical indicators (Fibonaccis, MAs, trend lines etc.) to verify signals. If you look at the left side of the chart, you see that the price action printed a low at similar levels to where the shadow of the dragonfly doji ends.
Thus, this level is an important point on the chart that makes the price action to stop or accelerate its current move. Hence, the likelihood of a reversal at this level is higher than at some other levels. This fact should increase our confidence in eventually taking a long position in USD/CHF.
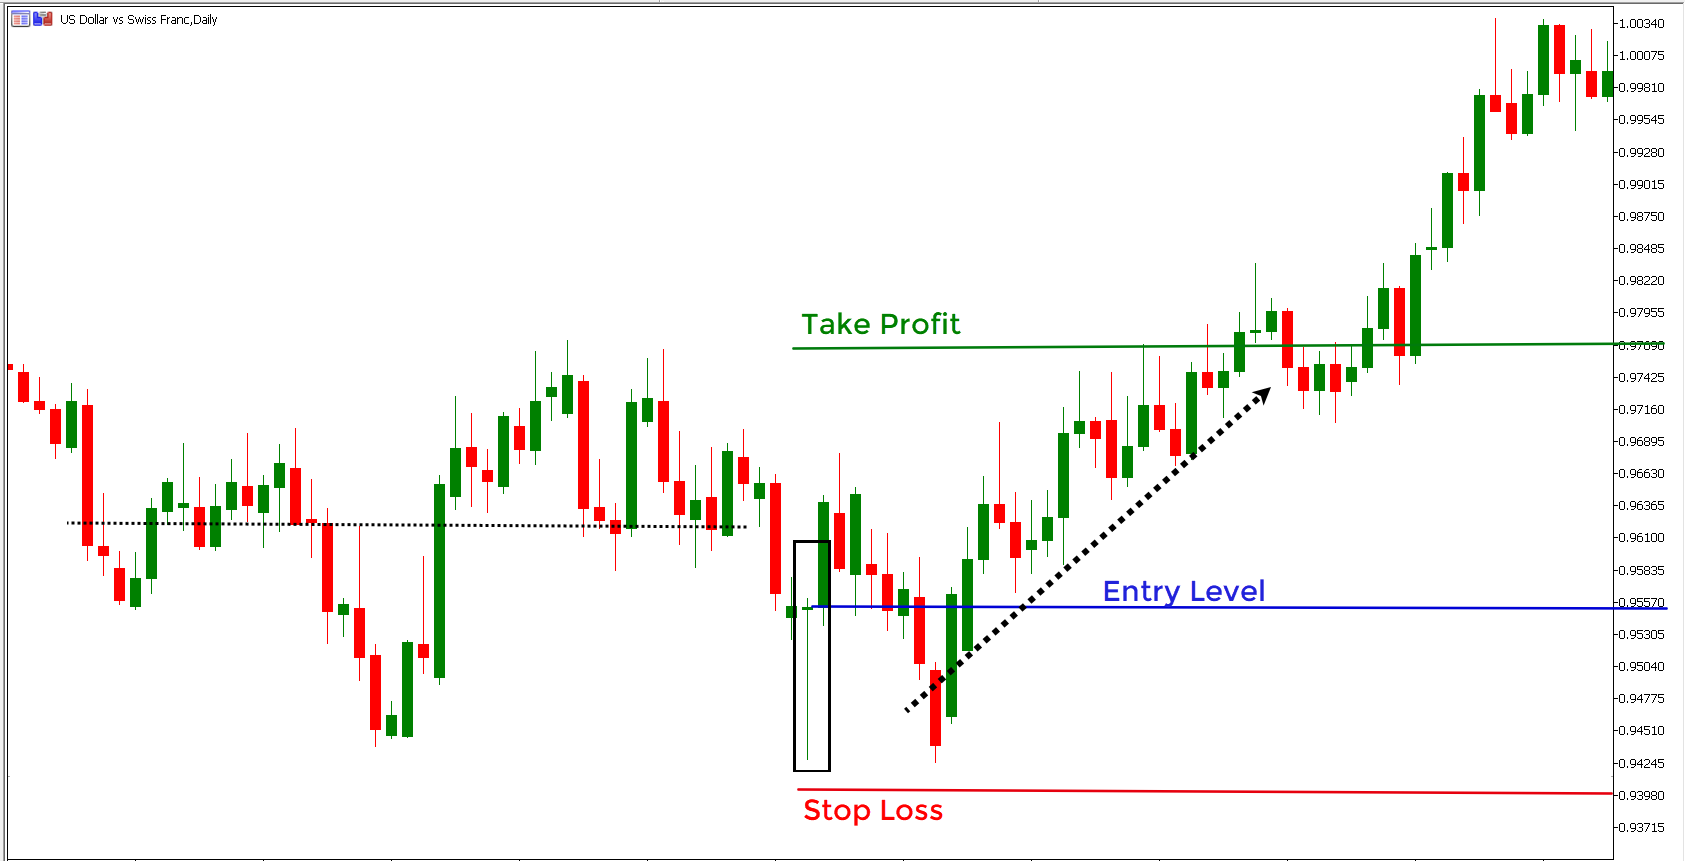
Trading the dragonfly doji candle – USD/CHF daily chart (Source: MetaTrader 4)
In general, there are two options for you to enter the market. The first one is more aggressive as it advises you to enter the market as soon as the dragonfly doji candle is formed. This group of traders believes that the market is about to change its direction, as the sellers failed to force a close lower despite pushing the market to trade at lower prices.
The second option is based on the idea that you should wait for the next candle. If it’s a long and bullish candle, it means the reversal has started. Otherwise, the next candle may also prove to be a bearish candle that practically invalidates a reversal signal from the dragonfly doji candle.
Assuming that you went for the first option, you decide to buy the pair looking for higher levels. The blue line shows your entry around the $0.9550 mark. A stop-loss (the red line) is placed below the most recent lows, with a cushion of around 20 pips to protection against uncontrolled whips.
It is exactly this cushion that saves us from getting pushed out of the market as the price action comes back to the same horizontal support before eventually racing higher. Again, we use support and resistance levels to identify our profit-taking level (the green line).
Eventually, the price action hits our profit-taking order. We booked 220 pips while risking around 150 pips, which makes the risk-reward ratio at around 1.5:1.
Summary
The dragonfly doji is a candlestick formation that signals a likely reversal in the price action. It can come as both a bearish and a bullish version, given that it stems from the family of doji candles.
This candle is formed when the open, high, and close are at an almost identical price near the top of the candle. The long shadow extends lower, signaling the failure from the side of sellers to close near the lows. A dragonfly doji candle could prove to be a powerful reversal formation if it takes place near the highs or lows.


Leave a Reply