Harmonic chart patterns have grown in popularity in the past few years. Although they are considered more advanced chart patterns, new traders have also shown a strong appetite for learning about how to draw and trade harmonics.
The Gartley pattern is defined as a harmonic chart formation that helps traders to generate, buy, and sell signals. As a harmonic pattern, it is a geometric structure based on Fibonacci retracement and extension lines.
In this guide, you’ll learn:
- What the Gartley pattern is
- How to recognize the Gartley
- Learn how to correctly draw a Gartley pattern
- Tips on the Gartley pattern trading strategy
Table of Contents
The Gartley Pattern
There are many harmonic chart patterns that are used by traders on a daily basis. Despite a high number of popular harmonic patterns, the Gartley chart formation is still the most recognized harmonic pattern.
The Gartley harmonic pattern is named after H.M. Gartley, who discussed harmonic chart patterns in his book titled “Profits in the Stock Market”, published in 1932.
It is also one of the most common harmonic chart patterns, alongside the AB=CD formation. This is a result of Gartley’s structure, which makes this chart pattern more straightforward than other harmonics.
Each Gartley pattern is initiated with the XA move. This is a “trending” move, the one that sets the tone for the short-term price action. In a bearish Gartley pattern, like in the photo below, the XA is a downward move that ultimately produces the sell signal at point D.
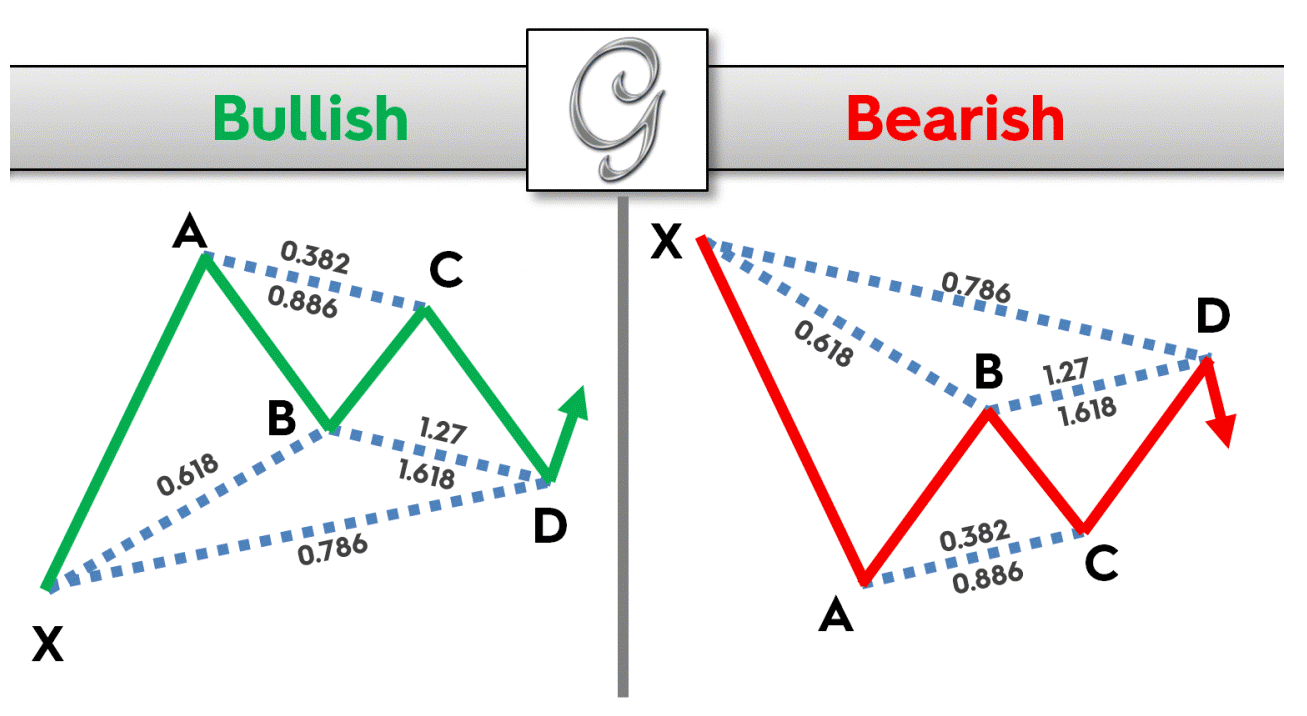
Anatomy of the Gartley Pattern
After the initial XA move, the point B represents a correction of the XA leg. It is located at 61.8% Fibonacci, the key retracement line. Once the point B is formed, the price action continues to move in the overall trend direction.
The point C is printed when the price retreats either 38.2%, or 88.6%, of the prior AB leg. In the first case, the point D should come as 127.2% Fibonacci extension line. The second scenario will push the point D towards the 161.8% extension of the BC.
Finally, the point D should come around the 78.6% Fibonacci retracement of the initial XA leg. The final point D generates a sell signal that should see the price action extend lower after a brief consolidation in the illustrated structure. Also, traders use the point D to verify the pattern as the point D in Gartley needs to be a 78.6% Fibonacci retracement line.
Remember to always allow for minor deviation from the guidelines. It’s nearly impossible to identify a Gartley pattern, and harmonic chart formations in general, that strictly follow the steps mentioned above.
The bullish Gartley pattern has the same structure, but works in the opposite way. The initial XA move is an upward leg that sets the one. Ultimately, the point D is a buy signal.
Strengths and Weaknesses
All harmonic chart patterns share the same group of advantages and limitations. As outlined above, harmonics are based on clear guidelines and a specific structure. As such, traders are required to simply follow this set of guidelines and wait for the point D to be generated. Hence, trading harmonic chart formations requires a lot of patience.
What comes out of these guidelines is practically the entire trading setup – entry and both exit points. Of course, it is always desired to use other technical tools, such as moving average, pivot points or trend lines, to verify these signals, but harmonics are considered to be very reliable patterns.
The structure also helps traders with risk management. Harmonics, and Gartley especially, yield very profitable and attractive trading setups that are based on a high risk-reward ratio.
As mentioned here, the rigidness and structure are what make harmonics scarce. In most cases, you will see the price action to fail at meeting the criteria for points B or C.
Therefore, much patience and time are needed to identify and draw the Gartley pattern. This is what makes harmonic patterns more advanced chart formations that are mostly traded by more experienced traders.
How to Spot and Trade The Gartley Pattern
Before we move to sharing tips on spotting and trading the Gartley pattern, here’s a recap of guidelines that are needed to verify the Gartley pattern:
- XA – This is where the pattern starts;
- AB – The point B should end at the 61.8% Fibonacci retracement of XA;
- BC – The BC move should end at either the 38.2% Fibonacci level, or 88.6% Fibonacci of the prior leg;
- CD – If BC ends at 38.2%, the CD should extend to 127.2%. Otherwise, the point D comes at the 161.8% extension of BC. All in all, any extension from 127.2% to 161.8% is welcomed;
- XD – Moreover, the point D should be 78.6% retracement of the initial XA leg.
Spotting and drawing the Gartley pattern on TradingView
Unlike other chart patterns, harmonics comprise multiple elements that are needed to be in place. A first tip that may be useful in this regard is to look for the XA move. As we said, this is where the pattern starts. Hence, this is always a trending move – up or down.
Next, any move which then facilitates a retracement to 61.8% Fibonacci can potentially end up being a Gartley. This is the easier part of the pattern as this retracement line is known to be arguably the most important and popular among traders.
The difficult part starts with the point C. This is where the majority of Gartleys, that are in the making, fail. Let us apply these guidelines on a real Forex chart now. We will now demonstrate how to spot and draw Gartley patterns on the TradingView platform.
The platform offers an easy and simple way of selecting the tool to draw the Gartley pattern. You simply have to click on the harmonic patterns picture in the sidebar menu. This way, a drop-down menu will appear where you can select among a few harmonic options.
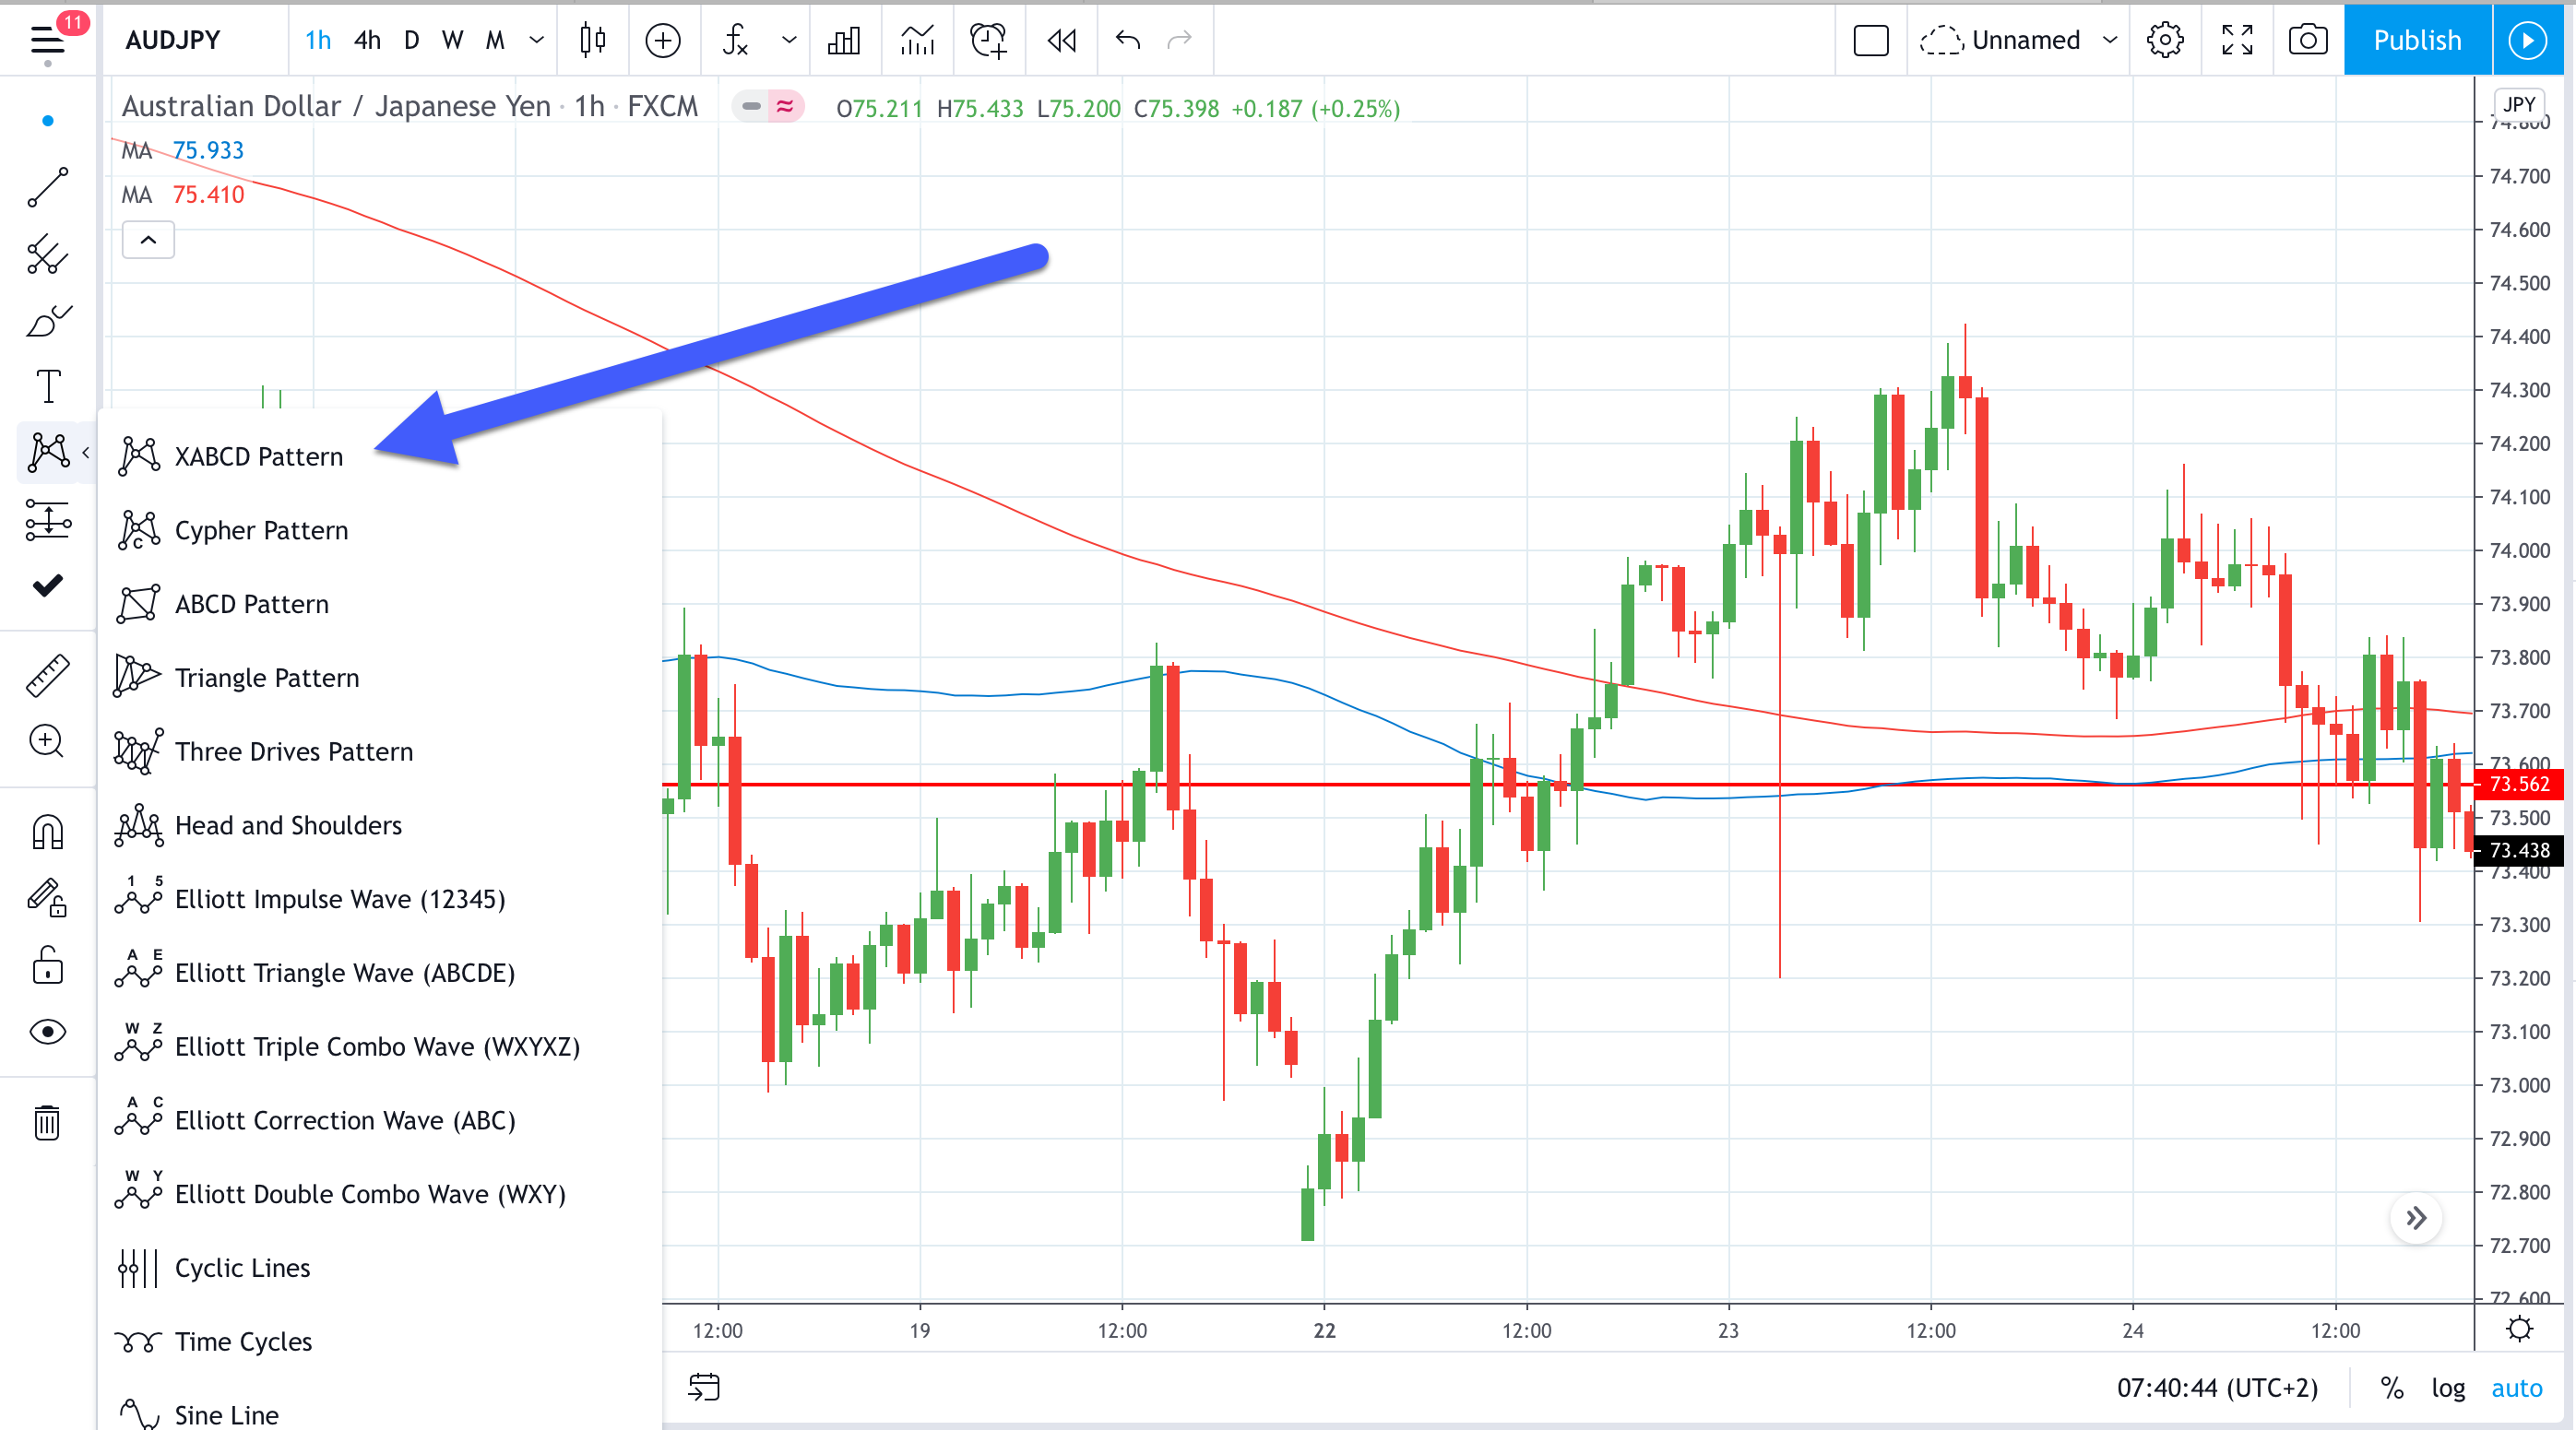
How to draw a Gartley on the TradingView platform
By clicking on the first option – XABCD – you select the tool that requires you to connect 5 points on a chart. Here, we have AUD/JPY trading on the hourly chart. As noted earlier, the XA leg is the trending move that sets the entire pattern in motion.
Fibonacci retracements and extensions will automatically be calculated as you move the cursor. This way, you can see exactly whether the specific pattern on a chart can follow the guidelines.
Of course, always keep in mind that live market moves can’t be perfect, hence allow for a minor deviation. When you are done with connecting the dots and applying the guidelines outlined above, a sell signal will be generated at the point D. Hence, in this case we have a bearish Gartley chart pattern.
After a brief consolidation period, the price action flushes lower to create a trending move (the XA leg). We are alerted to a potential Gartley chart pattern once the price action corrects to a zone around 61.8% of the initial XA leg.
A key Fibonacci retracement line reacts and forces the price movements to rotate lower and re-test the support that capped the initial move lower. The price action slightly overshoots the desired 88.6% Fibonacci. In case the price went below the prior low (the point A), the Gartley would have been invalidated.
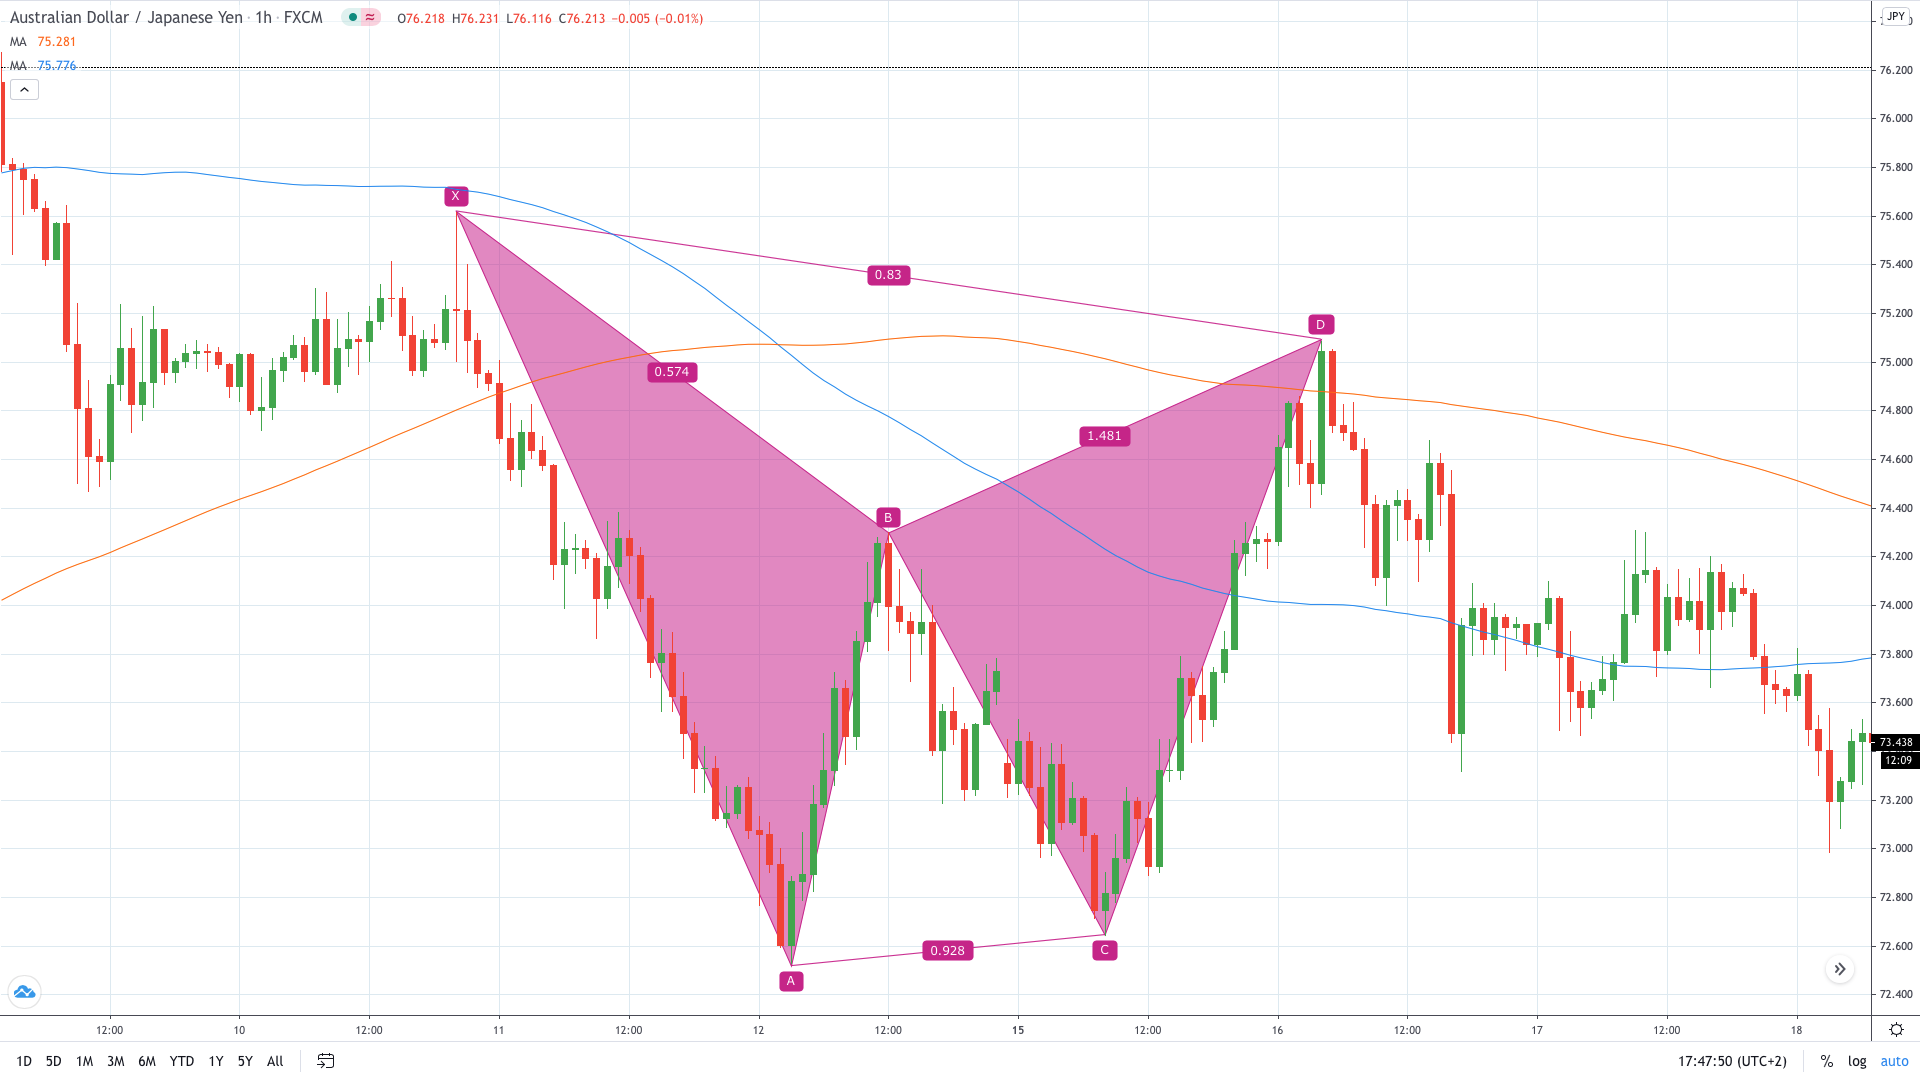
Spotting a bearish Gartley pattern on AUD/JPY H1 chart (TradingView)
After the last line of defence held at 88.6%, the price action bursts higher to extend well-above the point C. As mentioned above, the desired extension in this case should come between 127.2% and 161.8%, or ideally, 78.6% retracement of the starting XA leg.
The moment that the price starts hesitating as to whether to extend the latest bullish move is a sign that a reversal may have started to take place, which ultimately yields the point D. The reversal in the area where the point D should be located opens the door to implement the Gartley trading strategy.
Trading the Gartley Pattern
One of the most challenging aspects of trading the Gartley is determining the exact entry point. We are simply not aware whether the price action will reverse at 127.2% or, for instance, 143%. The best option is offered when the price extends to a 161.8% Fibonacci extension line of the BC leg.
Otherwise, we advise you to open the sell position at 78.6% retracement of the XA leg, like in this case. This translates into shorting AUD/JPY at 74.95. The stop-loss should be placed above the 161.8% Fibonacci extension line, in this case at 75.45.
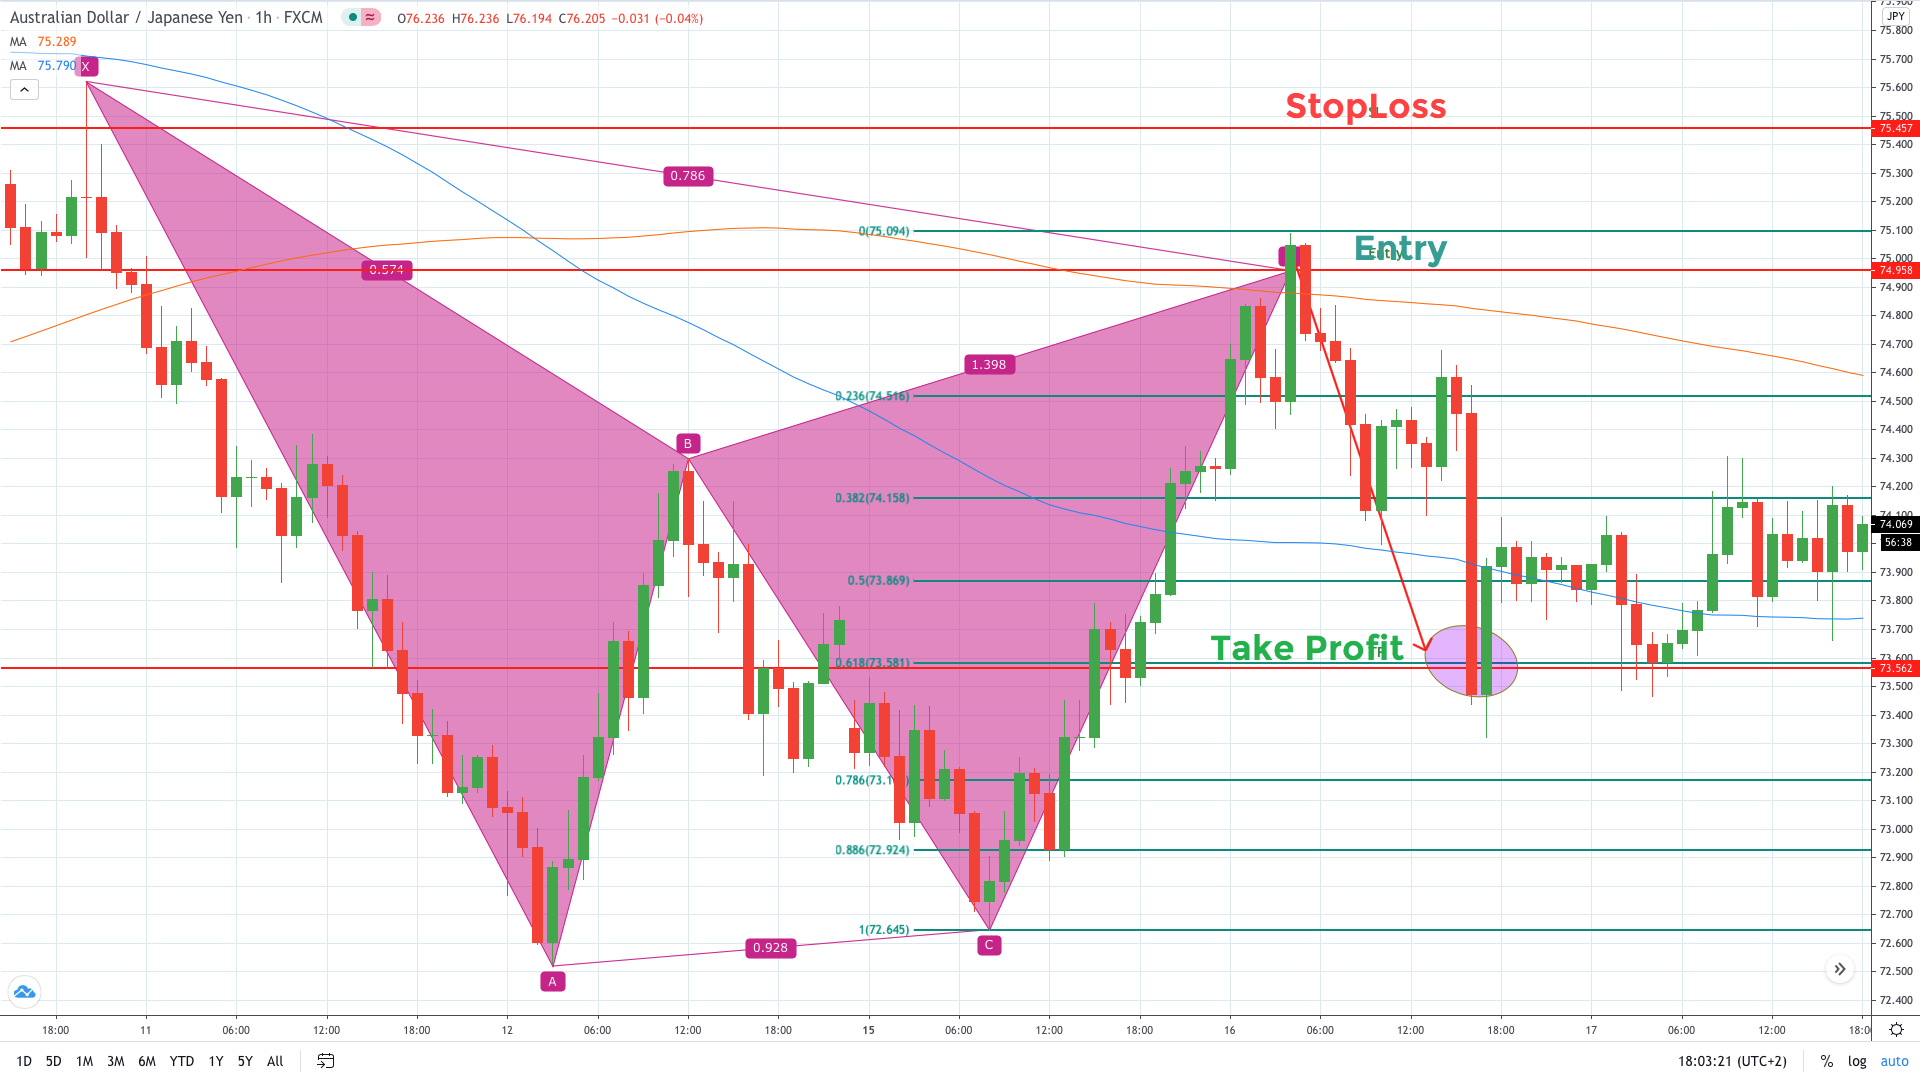
Trading a bearish Gartley pattern on AUD/JPY H1 chart (TradingView)
More aggressive traders with a higher risk tolerance advise to place the stop loss above the point X. In this case, that would translate to a stop loss of 80 pips. Setting a profit-taking order also depends on your overall risk management and trading style.
A bit of general advice is to look to close a trade at 61.8% Fibonacci retracement of the CD leg. In this example, a take profit order would be hit at 73.55, bringing us 140 pips. Again, depending on where your stop loss is and general risk tolerance, you can choose from 38.2% to 78.6% Fibonacci retracement of the CD leg.
All in all, we risked 50 pips to make 140 pips, making our risk-reward 1:2.8, which is a very profitable trading setup.
Summary
- Gartley is a harmonic chart pattern designed on Fibonacci retracement and extension lines;
- Gartley is usually a continuation pattern that helps the overall trend to extend;
- The final point D should generate a sell signal in bearish Gartley and a buy signal in the bullish version of a Gartley pattern;
- A defined structure is what makes Gartley attractive for trading from the risk management perspective;
- The risk-reward ratio generated with a Gartley pattern tends to be very attractive.
Frequently Asked Questions:
Which are the other Harmonic Patterns?
Besides the Gartley pattern, other popular harmonic patterns are ABCD, Bat pattern, Butterfly pattern, Cypher pattern, Crab pattern and the Shark pattern. The ABCD (or AB=CD) is also a very popular harmonic chart pattern that is of a similar design to the Gartley.
Other patterns are less popular as they are more difficult to find. For instance, the Shark and Bat patterns are based on longer extensions and have a structure that is more difficult to find.
Which Harmonic Pattern is the best?
There’s no unified answer to which harmonic pattern works best. In general, the Gartley and ABCD are the most popular harmonic patterns due to their simplicity. Some traders prefer to specialize in trading a specific harmonic pattern, for instance, the Butterfly pattern. Hence, they would see this chart pattern as the best harmonic.
In general, everything depends on your trading style and risk management, as well as the level of knowledge that a trader possesses. Traders who only started learning about harmonics are most likely to focus on Gartley and ABCD. More advanced traders may also see the Butterfly, or Cypher, as patterns that are more effective.
Are harmonic patterns profitable?
Yes. Harmonic Patterns are extremely effective and profitable formations. The generation of the point D (buy or sell) usually offers a very attractive trading setup. This way, a trader risks less to make more. Actually, their effectiveness and reliability are seen as the greatest strengths of harmonic patterns.
They are profitable due to a structure designed on clear guidelines for traders to follow. This way, the buy/sell points C or D usually offer a profitable trading setup, which makes harmonic patterns attractive for many traders.


Leave a Reply