Trend reversals represent one of the most anticipated scenarios in Forex markets. Traders analyze the currency markets, looking for reversal as they usually offer great risk-reward.
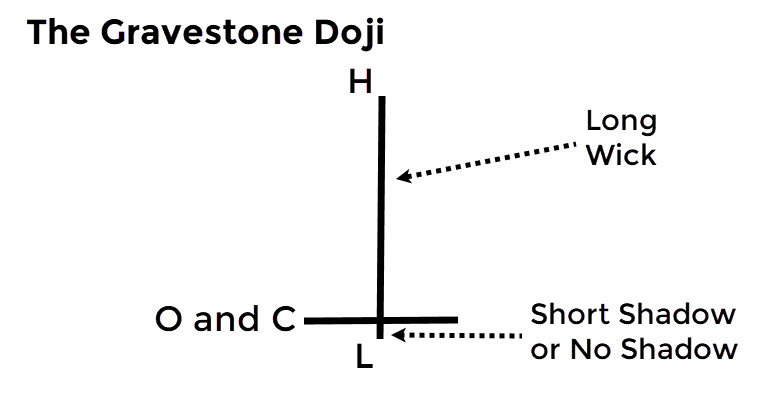
The gravestone doji is a candlestick formation that points to a likely reversal in the trend direction. The gravestone doji also looks like the letter “T”, but turned upside down. In this case, the open, low, and close are ideally at the bottom of the candle, while the long shadow shoots higher. Due to its design, the appearance of the gravestone doji at the top of an uptrend signals a likely reversal in the price action.
In this guide, we will:
- Explain the structure of the gravestone doji candlestick formation
- Look at the advantages and limitations of this pattern
- Share tips on how to easily spot the gravestone doji
- Go step-by-step in sharing a gravestone doji trading strategy
Table of Contents
Gravestone Doji Structure
The gravestone doji is a reversal candlestick formation that usually occurs near the highs in an uptrend. It belongs to the family of doji formations. As such, it is mainly a neutral pattern that signals indecision. However, it is mostly seen as a bearish pattern as its shape signals weakness on the side of the buyers.
The illustration below shows the gravestone doji candle. Open, low, and close are nearly identical in price, sitting at the bottom of the candle. The wick extends higher, signaling that the buyers pushed the price action higher at one point, but failed to force a higher close.
Gravestone Doji Structure
As a candlestick formation, the gravestone doji can take place anywhere on the chart. However, its powerful potential is best realized when it occurs at the top of the chart, as the wick signals the buyers’ inability to extend the bullish run.
Hence, gravestone doji trading strategies are usually based on this scenario. We advise you to ignore the gravestone doji’s appearance in the sideways or ranging markets as it only confirms the market’s indecisiveness.
Advantages and limitations
Dragonfly doji’s occurrence at the top of an uptrend signals a potential reversal in the price action. The long upper shadow really hurts the buyers, as investors start to lose confidence that the bull run can extend further higher.
Hence, it is a powerful tool that sends us a message that the market is likely to reverse. In order to confirm this message, traders tend to wait for the next candle to close. The long, red, bearish candle confirms the bearish reversal.
This candlestick formation is especially powerful when it is combined with other bearish reversal patterns, such as the shooting star, hanging man or the head and shoulders formation. A confluence of bearish technical indicators, such as moving averages, trend lines, pivot points etc., improves chances for a reversal in the trend direction.
On the other hand, the gravestone doji shears the same weaknesses of the dragonfly doji. First, it is a rare candlestick pattern. It’s very difficult to find a candle where the open, low, and close are identical. For this reason, traders tend to struggle to make the distinction between the gravestone doji and the shooting star. We will revisit this topic in a bit.
Second, the gravestone doji could still generate false signals. The reversal may not happen at all despite the appearance of the candle. The market may fake the reversal just for the buyers to push the price action towards a fresh high.
As always, we strongly recommend pairing the gravestone doji with other technical tools to cross-check generated signals. For instance, the appearance of a gravestone doji at a key Fibonacci resistance line increases the chances of a reversal.
Resemblance to other patterns
While the dragonfly doji looks almost identical to a hanging man or a hammer candlestick pattern, its opposite version, the gravestone doji, has its doppelgangers as well. While the dragonfly doji looks similar to a hammer, the gravestone doji has a similar shape to that of the inverted hammer candlestick.
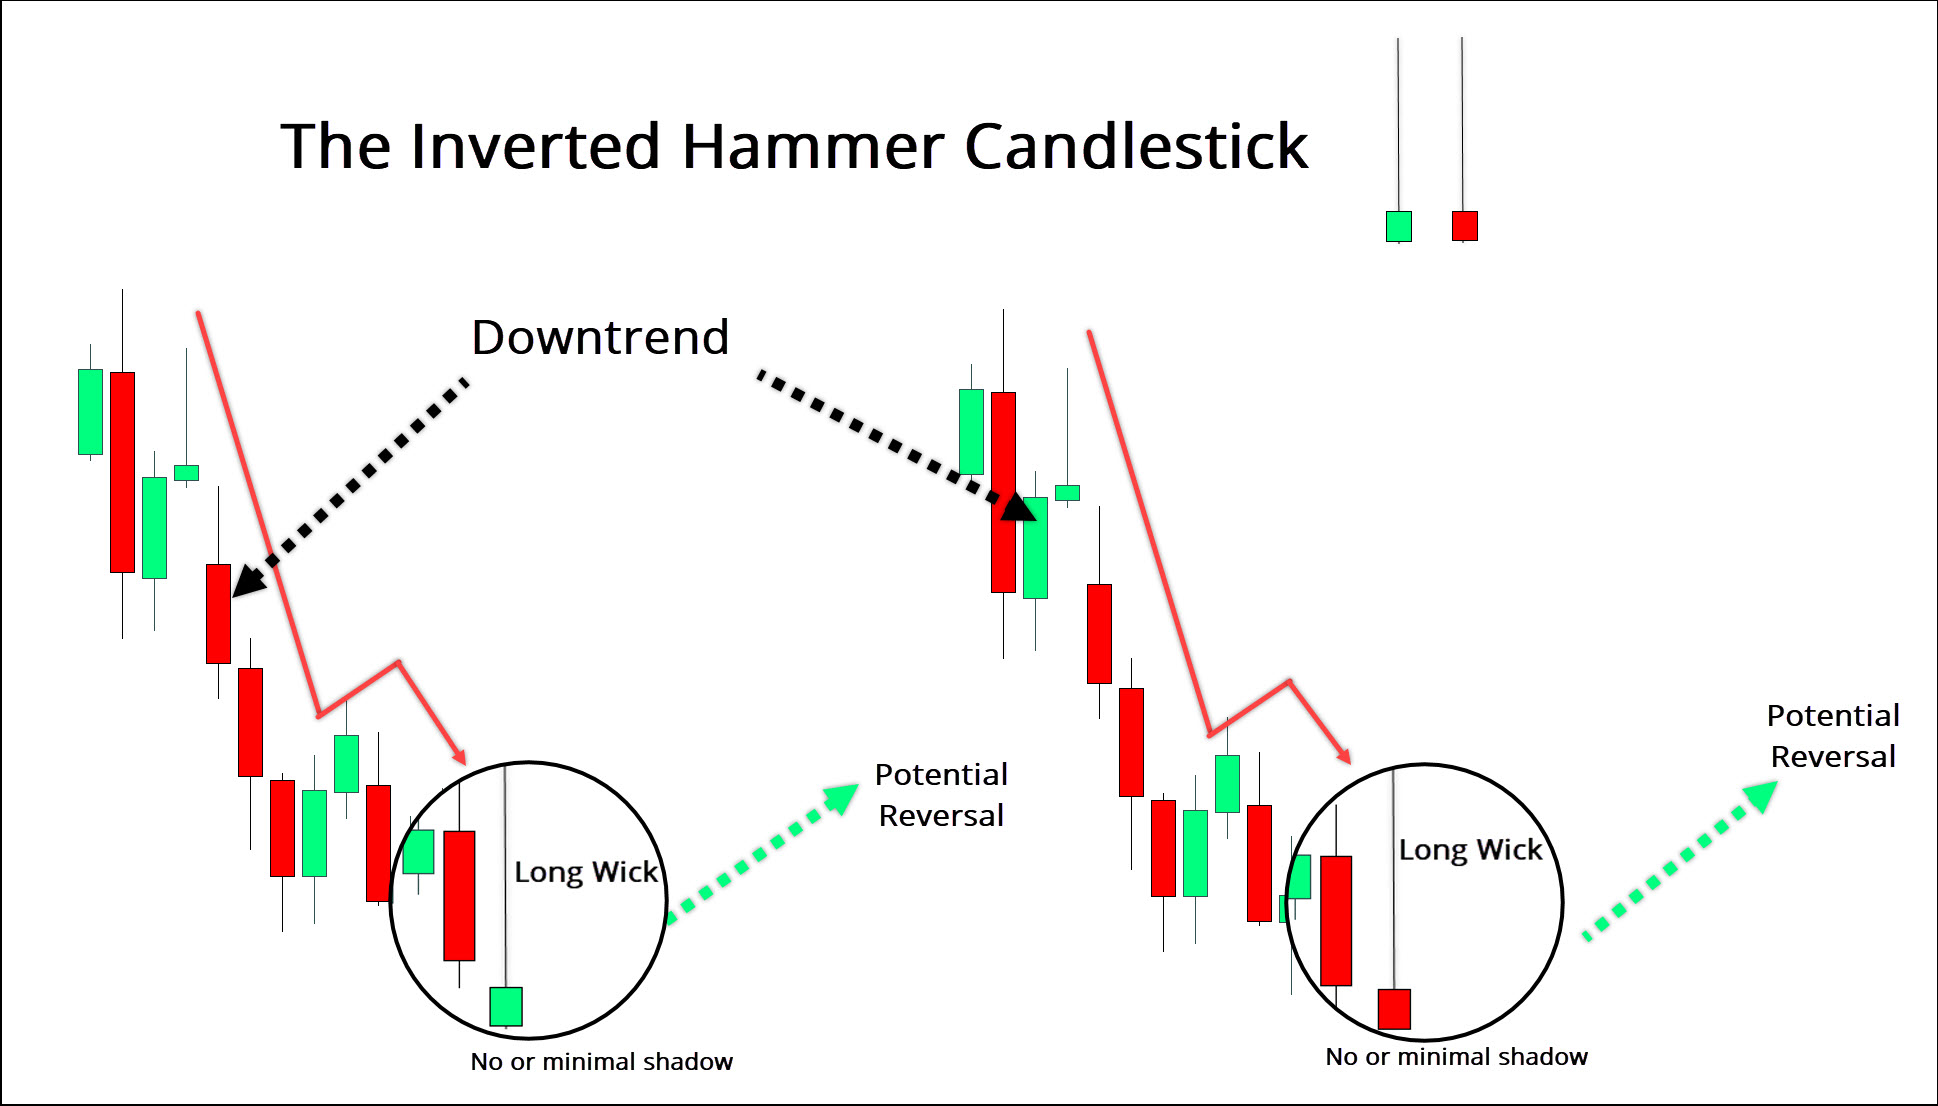
The inverted hammer candle
There are two key differences between these two candles. The inverted hammer has a real body, unlike the gravestone doji. All doji patterns are characterized by an overwhelming presence of wicks with (almost) no body present.
Secondly, the gravestone doji is primarily a bearish reversal pattern taking place at the top of an uptrend. Conversely, the inverted hammer usually takes place at the bottom of an uptrend and it signals that the trend may change as the buyers are growing in the game.
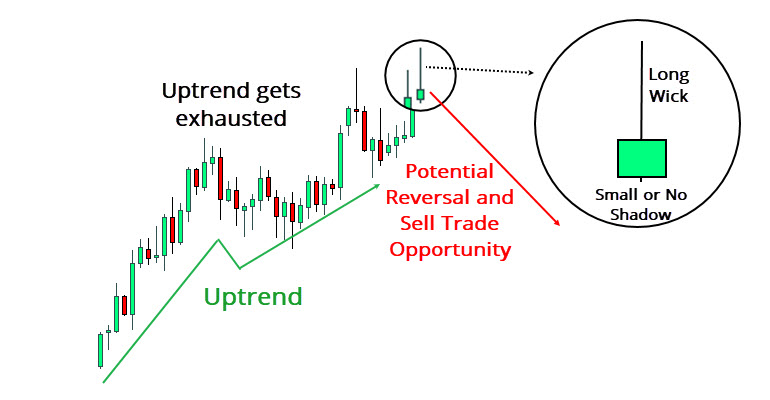
The shooting star candle
Actually, the gravestone doji shares more characteristics with a shooting star candlestick pattern. Both tend to occur at the top of an uptrend to send the same message that the reversal is likely to start as the buyers’ momentum is fading.
Moreover, the shape is similar as well. The shadow extends higher while the open, low, and close are located in the lower half of the candle. Still, the difference remains the same. A shooting star has a body that can be green (the open higher than close), or red (the close lower than open). Conversely, the gravestone doji has no body as all three elements are at a nearly identical price.
How to Spot and Trade The Gravestone Doji Pattern
Now that we are familiar with the structure of the gravestone doji candlestick pattern, we will share some tips on how to spot and trade the formation. In this regard, trading the gravestone doji pattern follows the same methodology as with the other doji candles.
Spotting the gravestone doji candle
Similar to the dragonfly doji candle, the long wick makes the gravestone doji candle easy to spot. The longer the wick extends higher, the stronger the failure on the side of the bulls is. In the example below, we see USD/CHF peaking on the left side of the chart before the decline in price comes.
First, a shooting star candle initiates a downturn in price action. The buyers then attempt to reverse the downtrend by pushing the price action higher. This particular attempt fails after the appearance of two consecutive gravestone doji candles.
The first candle is a classic gravestone doji as the open, low, and close are at the bottom of a candle. The second candle has these elements slightly higher as both have practically no body.
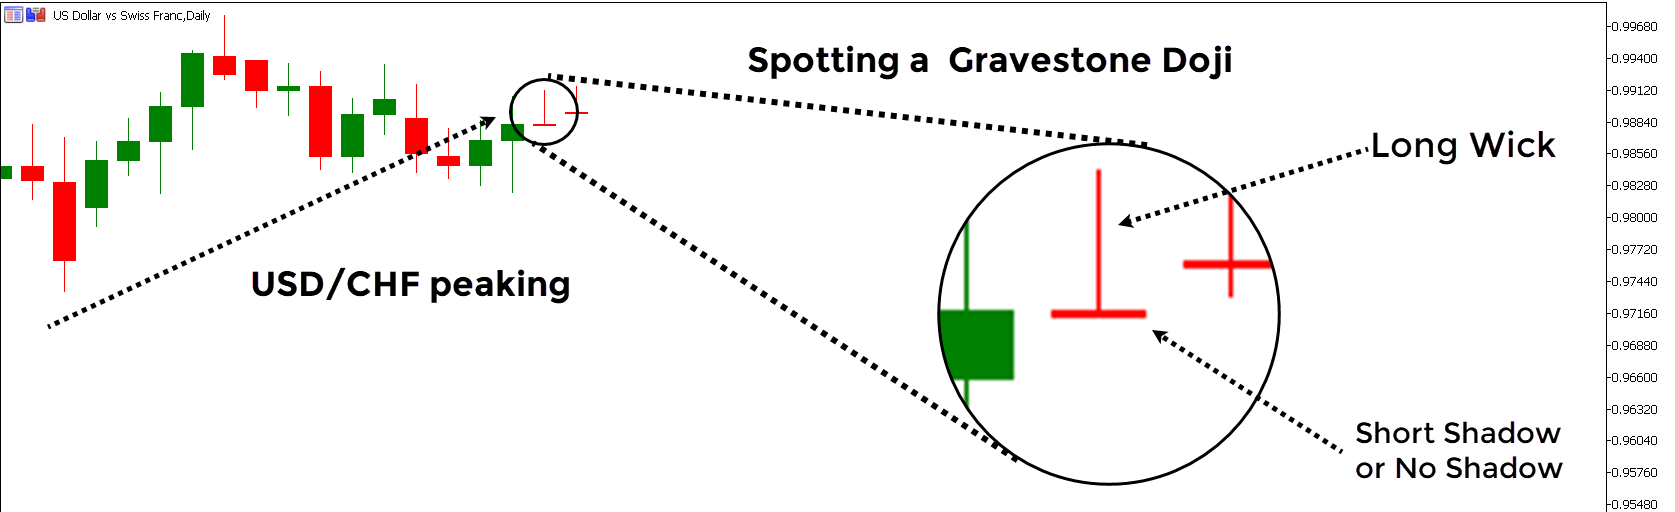
Spotting the gravestone doji candle – USD/CHF daily chart (Source: MetaTrader 4)
The new selling pressure, seen in two consecutive upper wicks, is too much to handle for the bulls. Sellers are then able to push the price action lower in an aggressive manner. In this case, we see a combination of a shooting star and two consecutive gravestone doji candles.
Both chart patterns are bearish reversal formations as buyers are left with no choice but to retreat. We will now use a combination of basic technical analysis tools to identify the key trading elements.
As with almost all candlestick chart patterns, there are two options available for the entry. The first option advises you to open a short position as soon as the gravestone doji candle is formed. This is a more aggressive and riskier option as we are still not sure that the market is about to completely change its course.
For this reason, the second group of traders tends to play a safer game. Before opening a sell trade, you should wait for the next candle to close lower. This candle is a confirmation candle that confirms the trend reversal.
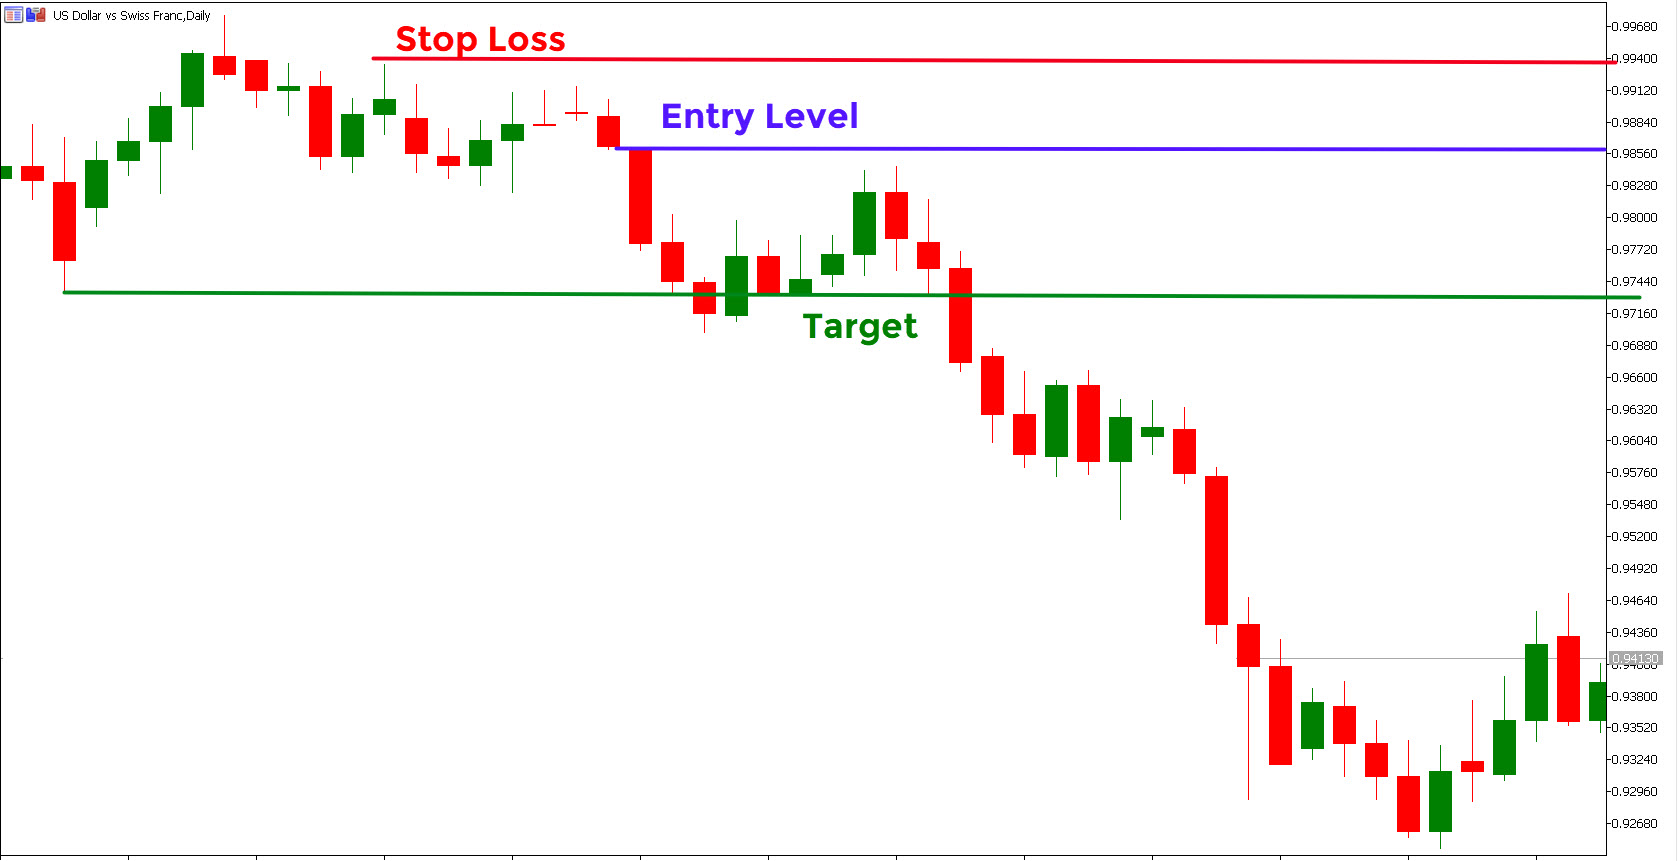
Trading the gravestone doji candle – USD/CHF daily chart (Source: MetaTrader 4)
Assuming you opted for the latter as you tend to play it safe, the entry price is placed at $0.9860. This is where the confirmation candle closed. A stop-loss is placed at $0.9940, which is around 20 pips above the gravestone doji’s high.
A profit-taking order generally depends on your trading style and how aggressive you are. Here, we used the prior horizontal support to determine where to collect our profits. Take profit order is set at $0.9730.
All in all, we are risking around 80 pips to make 130 pips, making our risk-reward ratio at around 1.6:1. Of course, you could use other technical tools e.g. Fibonacci retracement, moving average, pivot points etc., to set more aggressive profit-taking orders. For instance, you can calculate daily pivot points and look to take profits at one of these levels (R1, R2, R3…). Again, depending on your risk sentiment and trading style you can decide how much you want to stay in a trade.
Summary
The gravestone doji is a bearish reversal formation that signals an impending reversal in the price action. It is characterized by the open, low, and close prices at an almost identical level near to the top of the candle. As a doji candle, the gravestone doji has no body. It is exactly this feature that helps us distinguish it from a shooting star, which is also a bearish reversal pattern.
Gravestone doji’s upper shadow tells us that the buyers have grown tired and the bullish momentum is fading. As a result, there is a failure to extend the trend higher, which opens the space for the sellers to reverse the trend direction.
We advise you to ignore the appearance of the gravestone doji in sideways and ranging markets. Remember, its role is mainly to help the sellers end the bullish run and push the price action lower.


Leave a Reply