Technical analysis changes continuously. In the past, traders looked at the market’s basic concepts. Today, the personal computer allows using complicated functions. A linear regression channel is such one. A regression channel and channel trading strategies derived from it are statistical functions traders use to forecast prices.
Furthermore, technical analysis splits in two. One part deals with trading theories. The Elliott Waves Theory is an example.
Another part deals with technical indicators. But, if you ask retail traders what their favorite indicator is, the answers look the same.
Most traders focus on trend indicators and oscillators. As such, you’ll hear about RSI (Relative Strength Index) and Bollinger Bands. They’re the most popular ones.
But technical indicators today go in various other areas. Much more complicated than a simple RSI calculation.
Today, one can use cycle indicators, math operators, math transform indicator…and so on. However, the aim is similar: to forecast future prices. The right future prices.
Statistic functions indicators grew in popularity lately. Especially the most visible ones. A linear regression channel is such an indicator.
Channel trading strategies help trade in the trend directions. All traders want to ride the trend. After all, the trend is your friend. Right?
But, there are various types of channels. Horizontal channels, dynamic ones…only to name a couple.
In this article, we’ll cover:
- What is linear regression?
- How to apply the linear regression channel on a Forex chart
- How to use the regression channel
- Channel trading strategies for the Forex market
- Other statistic function indicators
The aim is to show the power of trading setups derived from statistic function indicators. And, for you to learn their secrets.
It all starts with the linear regression line…
Introducing the Linear Regression Channel
Traders love a regression channel at least for the following reason:
- It is easier to trade when a channel is present.
- They form an idea about future support and resistance levels.
- It gives great trades both in ranges and trending markets
But what is linear regression? Any introduction to linear regression analysis starts with the linear regression line.
This is a line that best fits prices. What does this mean?
We need several steps to explain the concept.
First, simply open a chart. Any currency pair. Any time frame.
Second, pick a market move. Below is the hourly EURUSD drop from 1.20 to current levels.
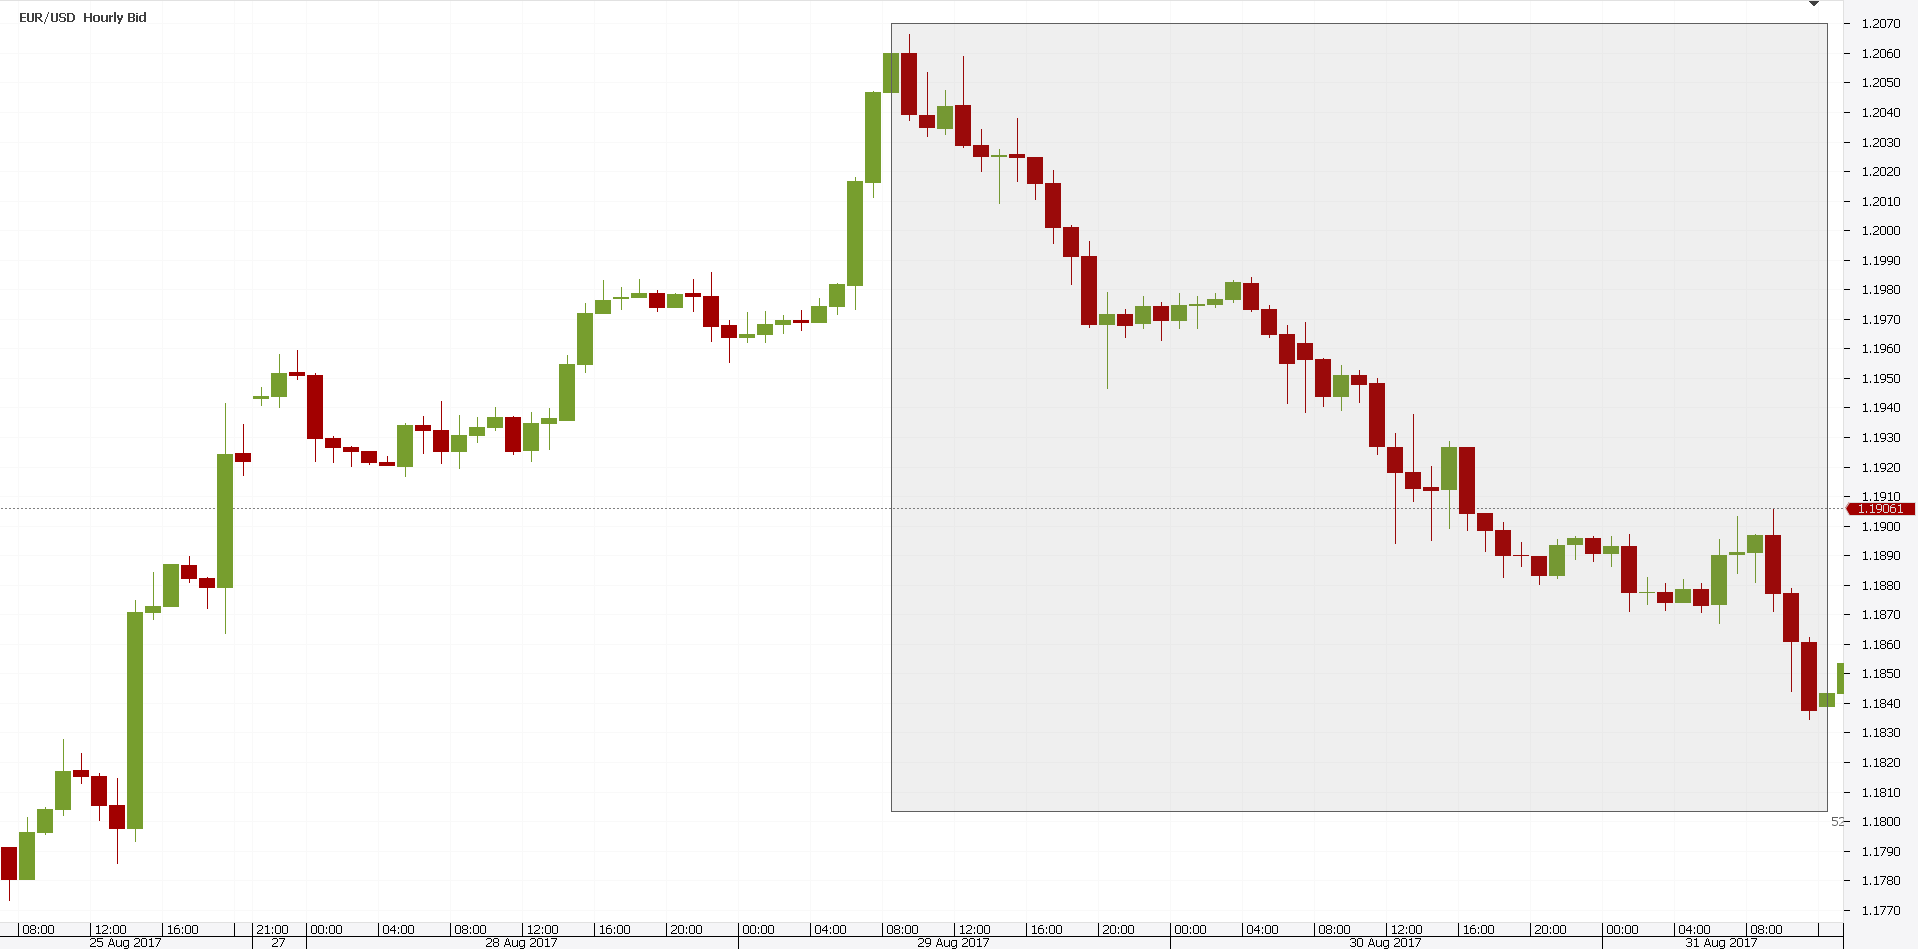
Finally, try to find a trend line that connects the highest and the lowest points. But, not any trend line.
The best fit. Or, the one that leaves the least space between price and the actual line. That’s the linear regression line. Pure and simple.
Following the three steps above, the best fit for the EURUSD chart looks like the chart below.
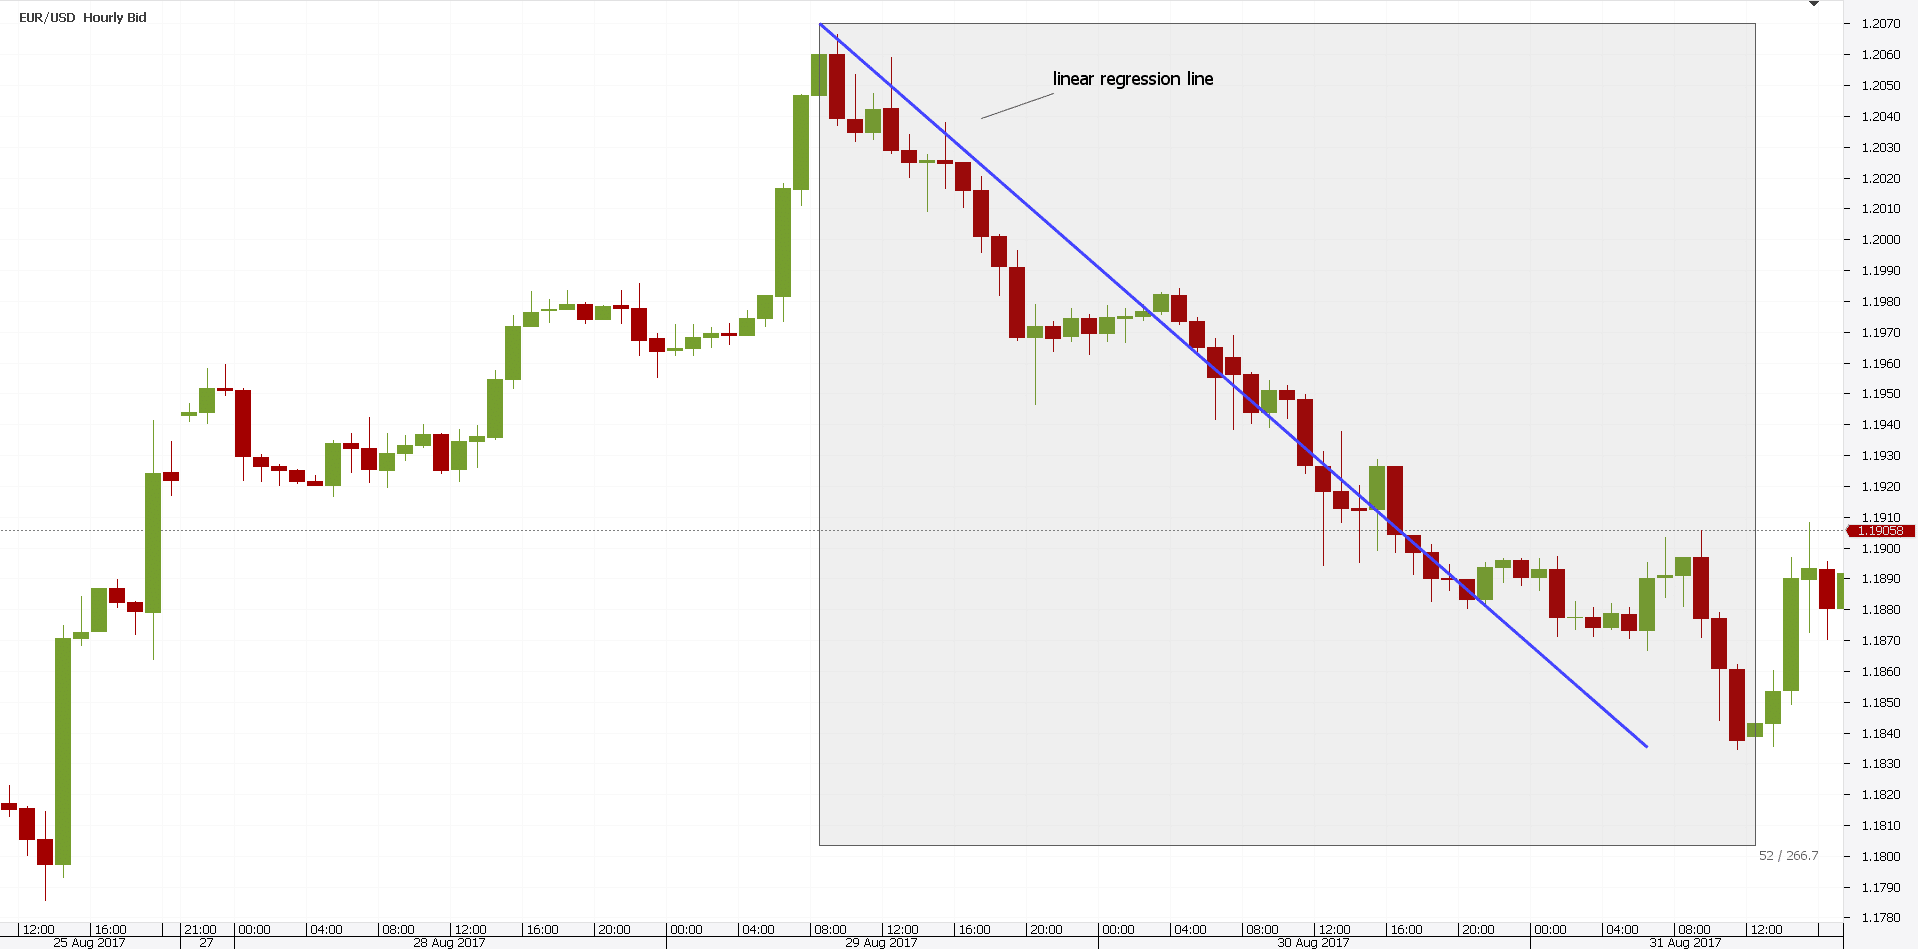
Of course, this is an approximation. Nowadays, any trading platform plots it automatically.
It finds the “perfect fit” with a currency pair in a blink of an eye. But, for the sake of understanding the starting point of a linear regression channel, it was a good example.
Traders use the linear regression line to detect a trend. Deviations from it are great trading signals.
Traders expect prices to be attracted to the line. As such, they buy or sell accordingly.
Such a line is the most simplistic statistic function indicator. However, it is the pillar or a regression channel.
The derived channel trading strategies from a regression channel are one of the most powerful in technical analysis. But, more on this later.
How to Build a Regression Channel
Above, we explained what is a linear regression. But, we used plain English.
Not complicated terms. As such, even the rookie trader to understand.
In reality, a standard linear regression line is the result of a statistical method. Its definition is far more complicated.
It measures two variables. Or, the relationship between two variables.
In any case, a regression channel derives from the linear regression line explained earlier. It has a central axis. And, two parallel lines.
It looks like this.
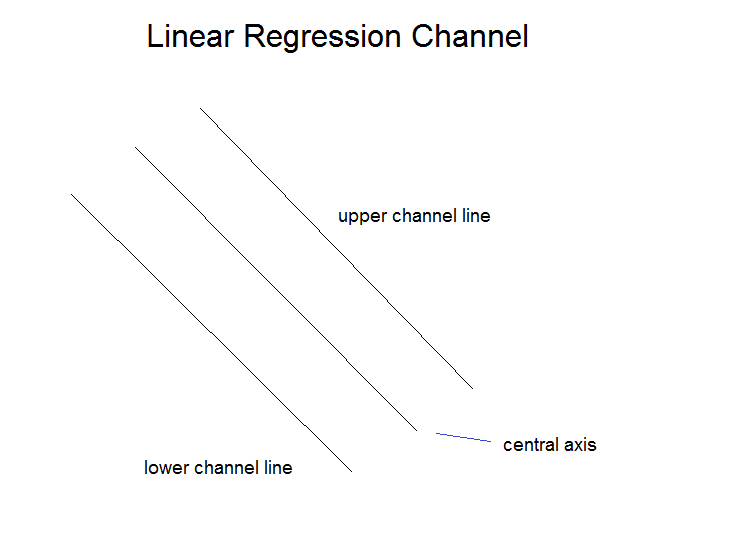
Note that the regression channel above is bearish. And, the central axis is nothing but the linear regression line.
The other two elements are two parallel lines. That is, parallel to the original regression line.
A proper distance is typically one or two standard deviations above or below the regression line. However, there’s no rule of thumb for it.
Why is this important? Because understanding a linear regression channel leads to powerful channel trading strategies.
Or, understanding how the linear regression channel forms. If the upper and lower channel lines use only one standard deviation, the channel contains 68% of all prices.
In short, it is thinner. On the other hand, if the two lines use two standard deviations, the channel gets thicker.
It’ll have 95% of prices in it. Or, candles.
As such, when the price breaks the linear regression channel, traders use it as a signal. If price spends 95% of the time inside the channel, they trade accordingly.
Remember the holy grail in trading? Price and time.
These are the two variables a standard linear regression uses.
How to Attach a Linear Regression Channel to a Chart
Today, no one calculates the standard deviations manually. Computers do that.
All traders need to do is to find the proper indicator. The one that plots the data automatically.
Unfortunately, the linear regression channel indicator mt4 traders use, doesn’t come with the default settings. Here’s how to solve this issue.
First, search the Internet. Simply Google for the regression channel indicator mt4.
You’ll find it in the first results.
Second, save it on your desktop. This is important!
Third, copy and paste it in the MetaTrader MQL folder, in the Indicators sub folder.
If the MetaTrader was open during this process, close it. By opening it again, the changes will appear.
But, the linear regression channel is a custom, not a default indicator. Therefore, we need to look at Custom indicators to find it.
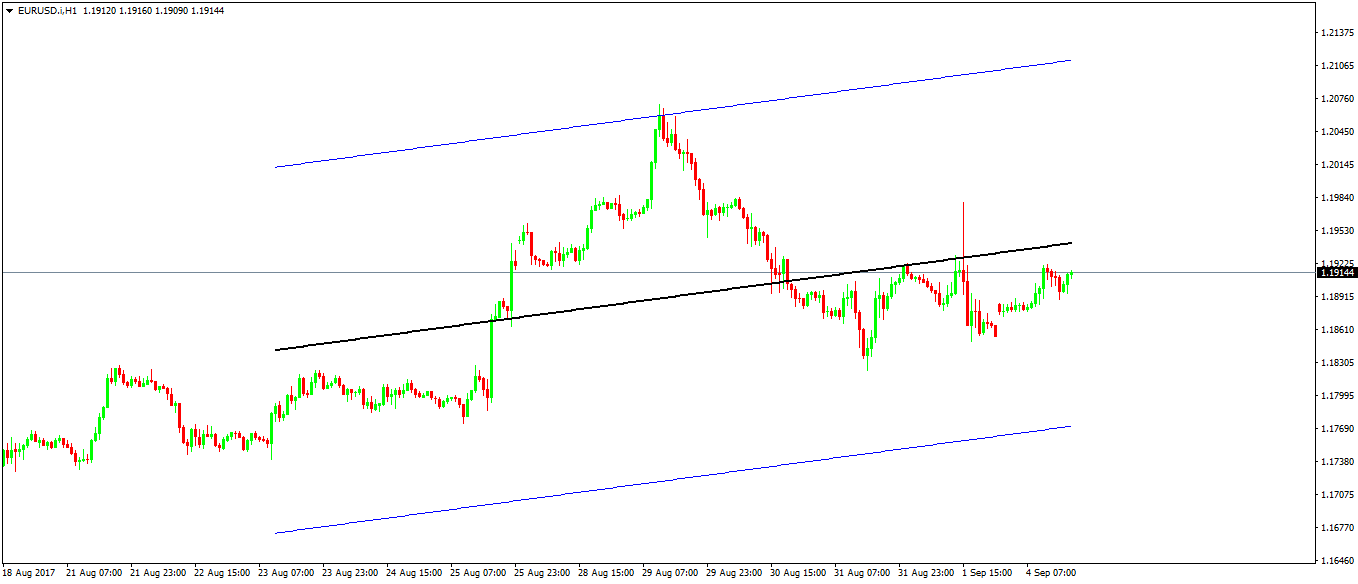
Finally, simply click and drag it to a chart. The result looks like below.
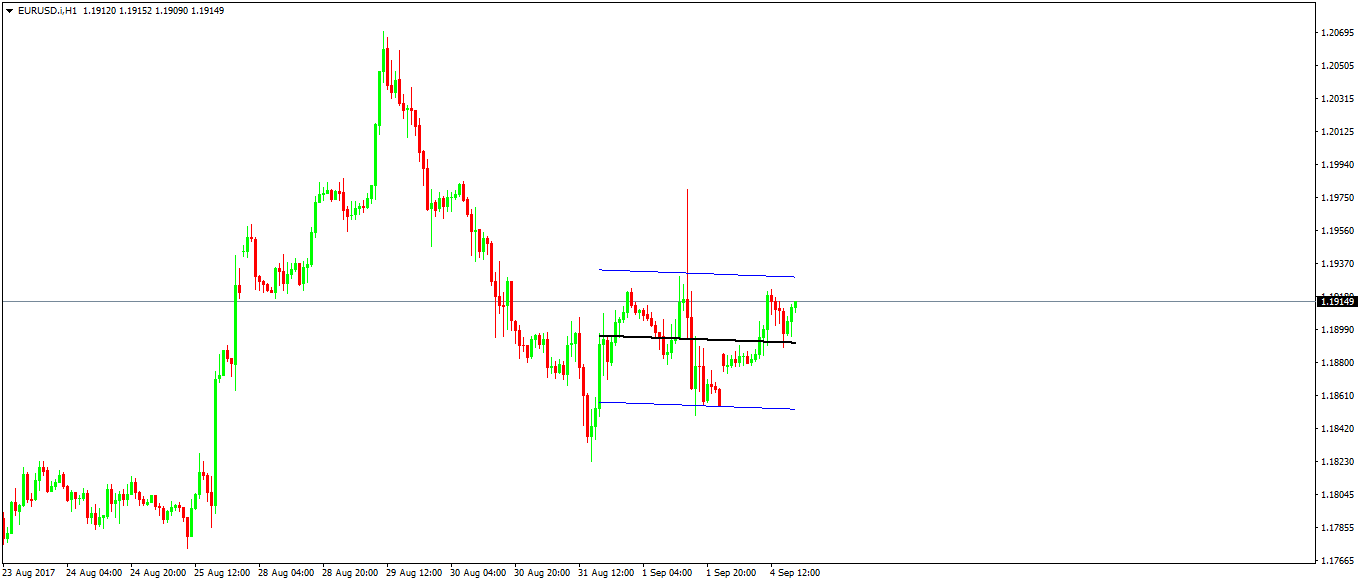
It shows the regression channel on the EURUSD hourly chart. The black line is the actual linear regression line. You know how to plot it yourself.
And, the two blue lines show the upper and lower linear regression channel lines. But, there’s a trick.
This linear regression channel mt4 indicator considers only fifty candles. As such, it will plot the data for the last fifty hours.
That’s easy to fix. If you need more, simply edit the indicator.
Above is the same EURUSD chart. But, this time we changed the input.
Under bars to count, we switched the variable. From fifty to two-hundred.
The principle is like that of any indicator. Simply change the period to adapt it to your trading needs.
Channel Trading Strategies with the Regression Channel
Now we know how to attach the regression channel indicator to a chart. Obviously, the next step is to learn some channel trading strategies.
Before starting, keep in mind what trading is. It’s a probabilities game.
As such, statistics help. It improves probabilities of finding a good trade.
Why not use statistical indicator, then? A regression channel is perfect for profitable channel trading strategies.
Channel Trading Strategies in Trending Markets
This is the classic way to use a regression channel. Most importantly, it works not only in trending markets.
But, in ranging ones too. What’s different?
The channel’s angle. Ranging markets will end up having an almost horizontal linear regression channel.
However, trending markets will have a rising one (in bullish trends). Or, a falling one (in bearish trends).
If the range or trend holds, the regression line will do its trick. It’ll attract price.
As such, one of the best channel trading strategies is to wait for the price to break. That is, to break above/below the range/trend lines.
That’s the first step. Second, wait for the price to come back into the channel.
Third, go long/short, targeting the regression line. But, always have a stop loss.
Typically, a stop loss must be part of a good risk-reward ratio. In Forex trading, that’s 1:2 or 1:2.5 pips.
Anything below is unacceptable. Anything above is fantastic!
A trade derived from such channel regression strategies has bigger r:r ratios. That is, most of the times.
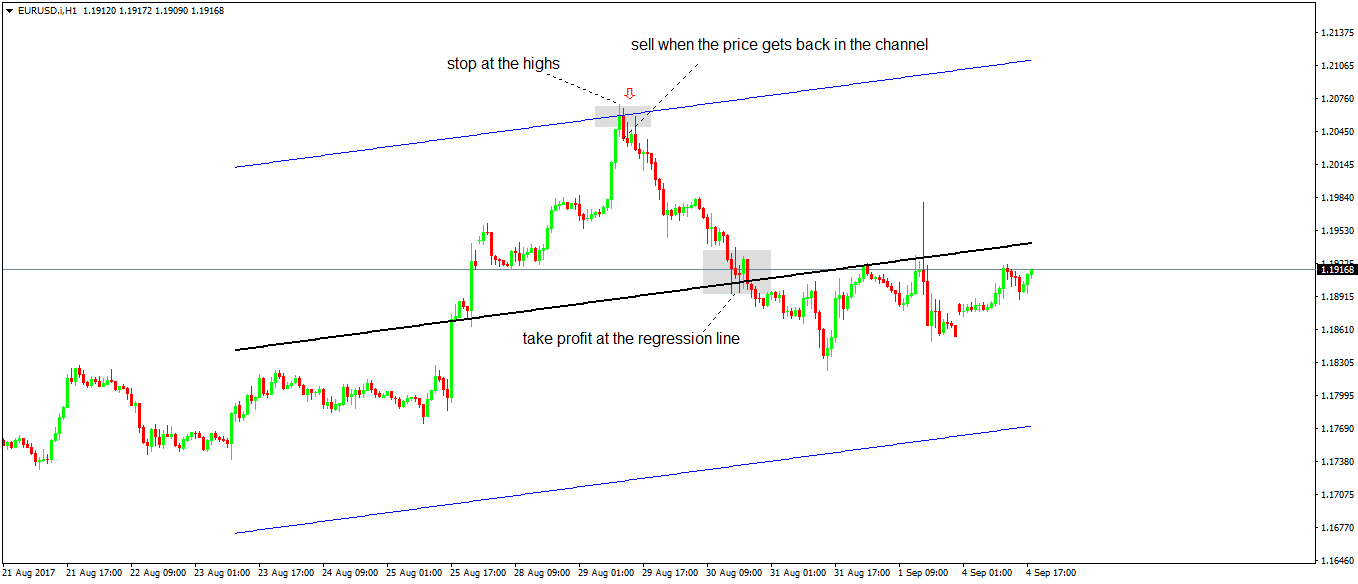
Let’s use the same EURUSD chart. Moreover, the same two hundred periods linear regression channel.
The price broke above the channel. That’s the first step.
Next, it moves back in. At the close of that candle, traders sell.
The stop loss is set at the previous candle’s highs. That’s the swing high.
And, the take profit, where the linear regression line comes. The outcome blows minds!
The trade had a staggering risk-reward ratio. Keep in mind managing risk is everything in Forex trading.
Channel Trading Strategies That Adapt
The standard interpretation of a linear regression channel should be clear by now. But, how do we know if a trend reverses?
Or, if the price breaks a range for good? Well, if that happens, it won’t be a problem.
After all, there’s a stop loss in place. And, if we keep the money management rules, losing a trade from time to time won’t hurt the trading account.
But what if I tell you that there are ways to know before it happens. We’ll illustrate here one.
The basic one is simple to understand. Traders look at the price action.
Remember how a linear regression channel is built? The prices stay over 95% of the time inside it.
Here’s the key. Reversal channel trading strategies consider the price action.
Or, the ability of price to stay outside the channel. When this happens, the trend reverses. The range will break.
However, variations of a regression channel exist. Visual aids help.
Some channel trading strategies use such visual aids. For example, when the linear regression line changes the trend.
The line is either rising or falling. It won’t say horizontally for long.
Therefore, when it falls, traders sell the breaks higher. When it rises, traders buy.
Regression Channel Indicator on the EURUSD Daily Time Frame
In this type of trading, the usual caveat applies too. The bigger the time frame, the bigger the implications are. Both for the risk, and the reward.
Below is the EURUSD daily chart. The regression channel used here has some visual aids.
Look at the linear regression line. The line in the middle.
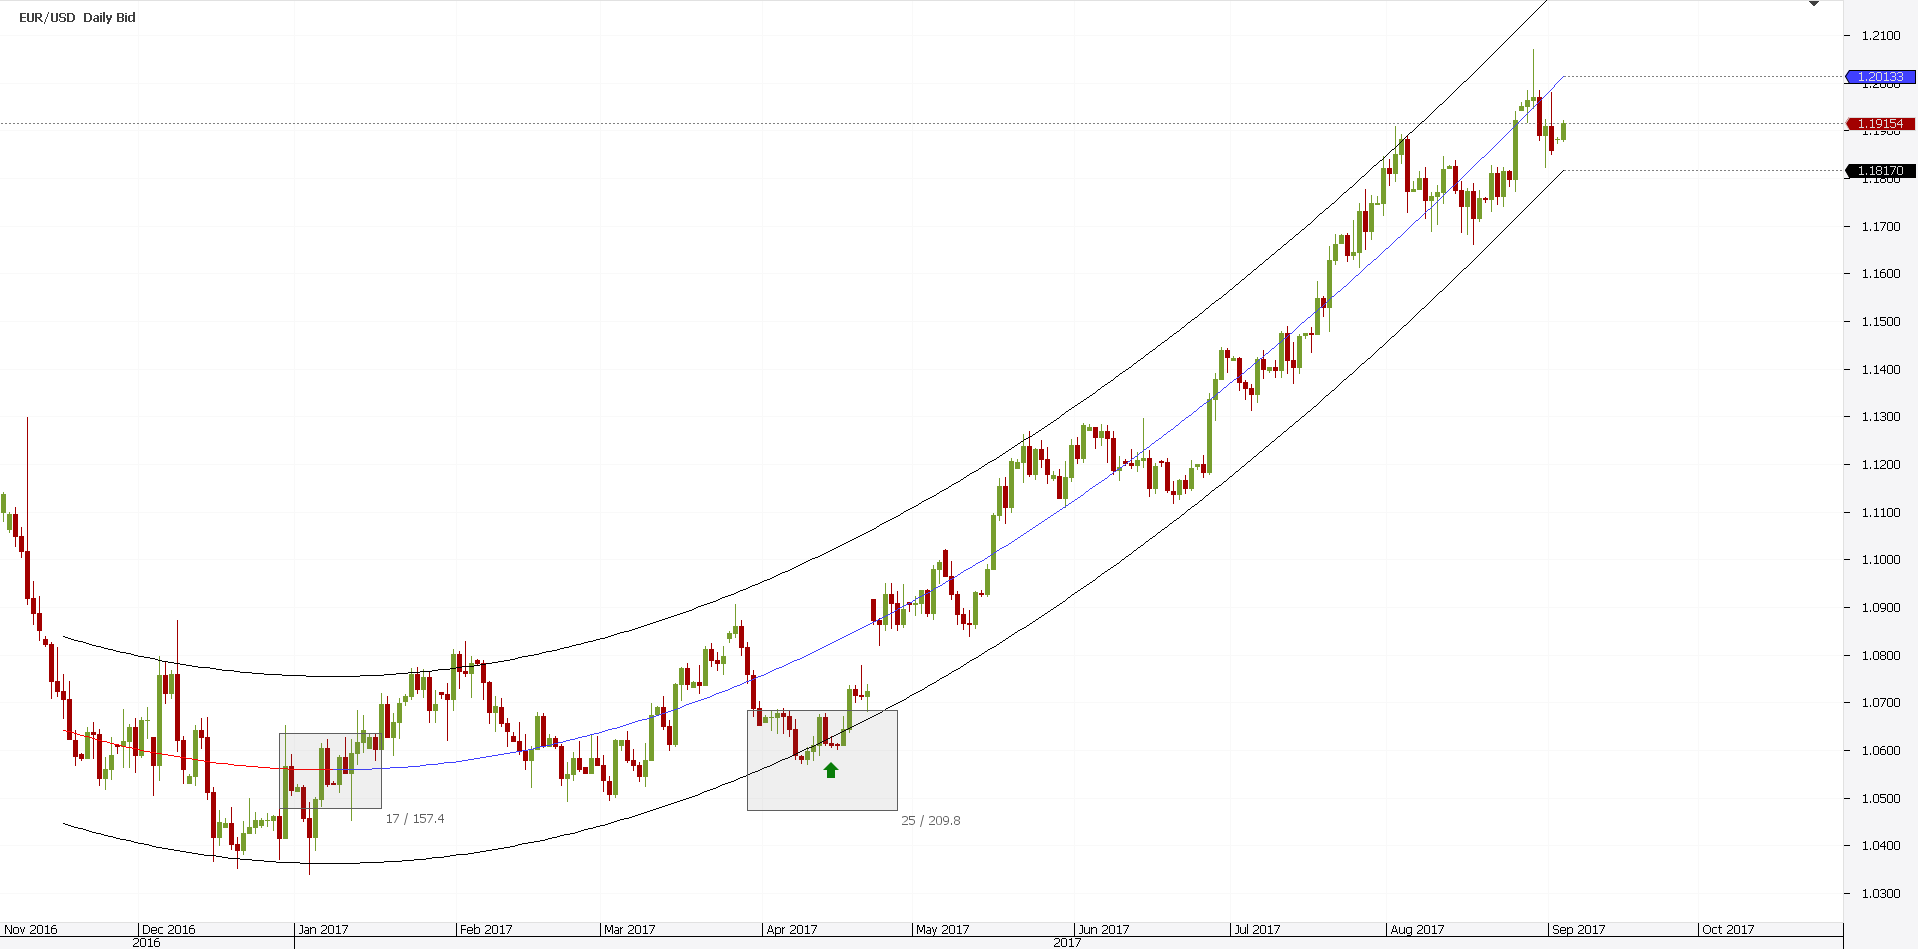
Notice something new? It changes colors.
When it rises, it turns blue. When it falls, it is red instead.
That’s a great helping tool. It tells traders what to do.
As such, they buy when the middle line is blue. And sell, when it is red.
That simple? Yep.
From left to right, here’s how to interpret the EURUSD daily chart. First, spot when the linear regression line changes direction.
Easy to do that. Simply wait for it to turn blue.
From this moment, we only want to buy. Or, go long.
And, to do that, we apply the principles described earlier in this article.
Second, wait for the price to break below the lower channel line. That’s the long signal.
Third, wait for a close back into the channel. Finally, go long with a stop loss at the lows.
The take profit may differ. It may be at the linear regression line.
Or, at the upper line of the linear regression channel. Another great risk-reward ratio in both cases!
Is it safe to sell the upper line of the regression channel? Let’s just say it isn’t safe to be long anymore.
Channel Trading Strategies with Fibonacci Golden Ratio
The EURUSD daily example shows the power of channel trading strategies. Such risk-reward ratios are not easy to find.
Other indicators in technical analysis won’t perform that well.
However, a closer look at the rising linear regression channel shows that something is missing. There are few potential trades that miss the entry by a bit.
Look at the previous chart. The price comes to almost breaking below the channel.
However, it bounces. Just before breaking, a sharp move higher follows.
Following strictly the earlier rules don’t make sense.
How to solve this issue? Fibonacci has the answer.
More exactly, one of the Fibonacci ratios. The most important one: the golden ratio.
Known as the 61.8% retracement, it offers great entries. Channel trading strategies with the Fibonacci golden ratio have slightly different rules.
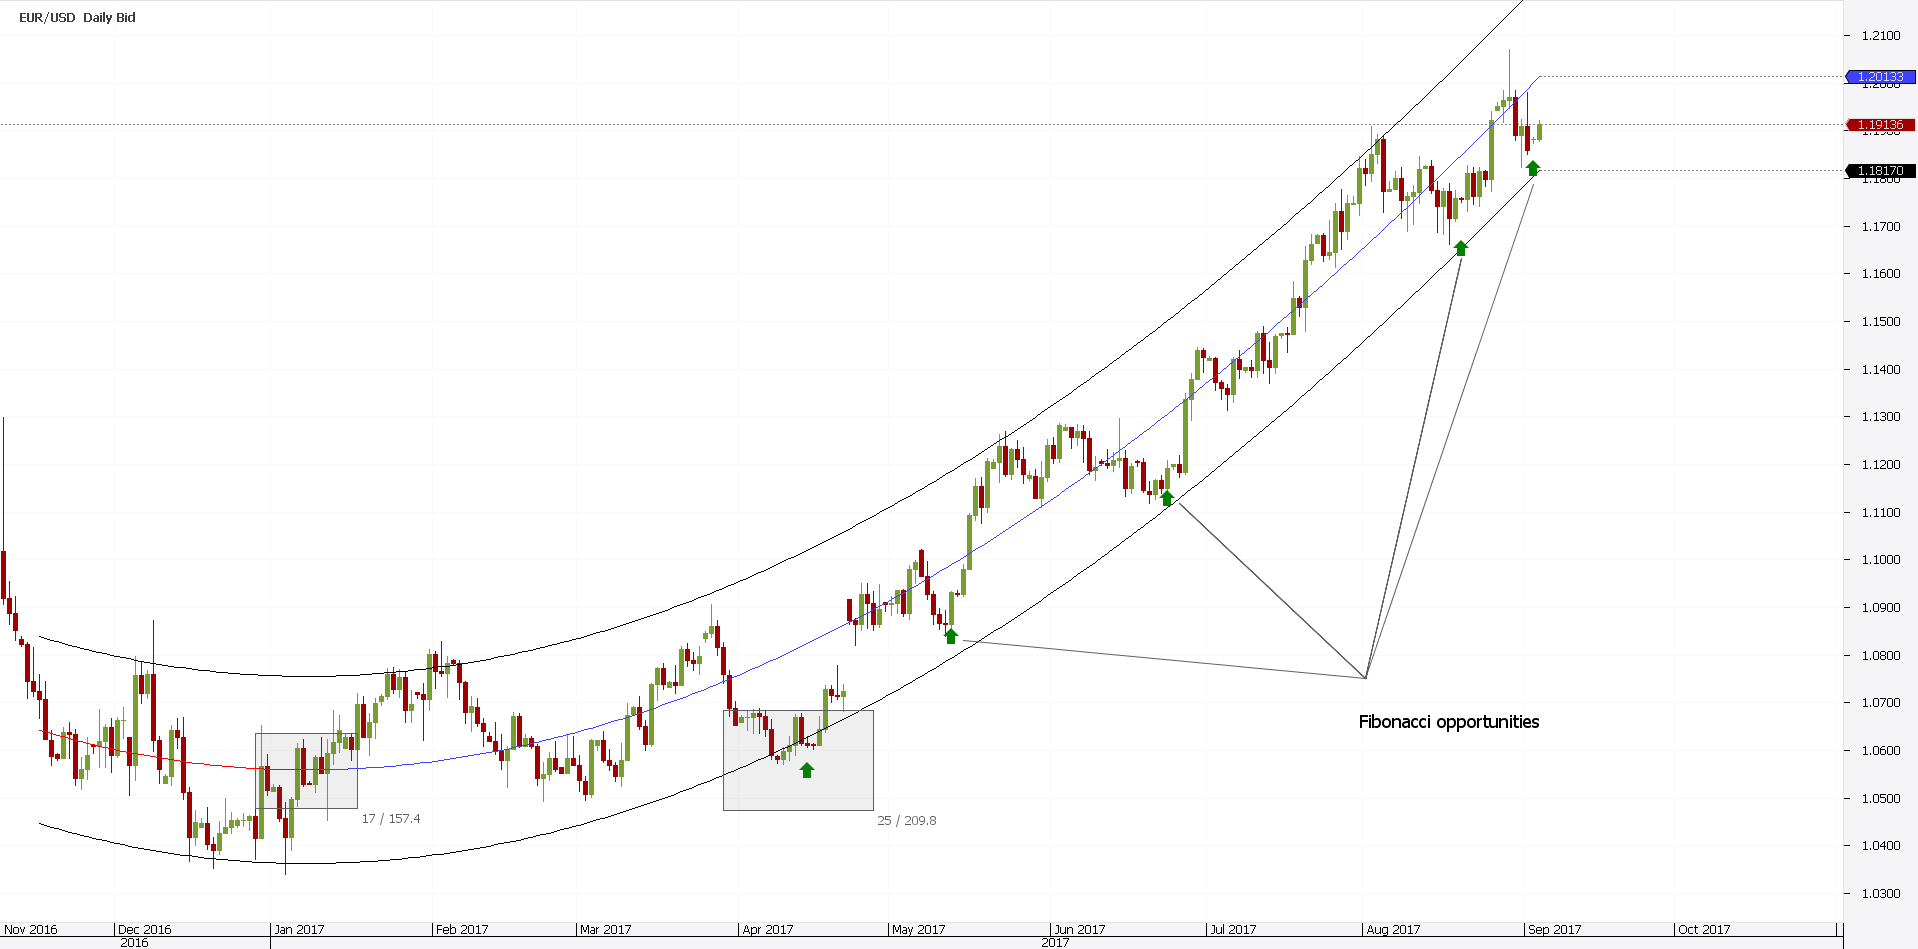
The graph above shows four potential trades. Other than the one mentioned earlier.
What do traders do? First, they calculate the distance from the linear regression line until the lower channel line.
Next, they find out that 61.8% level. Furthermore, they wait for the price to reach it.
And, they wait for a bullish, green candle. That’s the signal to go long.
We only want to buy here, remember? The linear regression line belongs to a bullish linear regression channel.
Finally, they go long. They place a stop at the lows of the green candle. And target a 1:2 or 1:2.5 risk reward ratio.
Or, the linear regression line. Whichever comes first!
Other Statistic Indicators in Technical Analysis
By now you are aware of the power such indicators have. Because nowadays computers make our life easier, we can calculate virtually anything.
As such, the linear regression channel is only one of various statistic functions we can use. Others are:
- Pearson’s Correlation Coefficient
- Linear Regression Angle
- Standard Deviation
- Time Series Forecast
- The Variance of a financial product
These are only some of the most important ones. Even the linear regression channel has different variations of it.
And, the concepts used in calculating a linear regression changed in time. Traders also use the linear regression intercept indicator. Or, the linear regression slope.
However, the idea is the same. To understand where the price goes.
Conclusion
A regression channel shows everything. As such, traders love it.
Ranges end up giving great trades. A trending environment gives even better ones.
And, channel trading strategies offer one of the best risk-reward ratios.
No one says a stop loss won’t be hit. But, most of the times it doesn’t.
Moreover, when it doesn’t, the resulting trade has bigger than average rewards. That’s all that matter for the trading account to grow.
If trading is a game of probabilities, then using statistic functions indicators makes sense. After all, we want to trade on the right side of the market.
What if there’s a way to find out which side is the right one? Won’t you trade in that direction?
This article proved, beyond doubt two things:
- Super-sized risk-reward ratios are a reality in Forex trading. Not a myth.
- A linear regression channel is the tool to get them.
Rest depends on each trader. Other factors intervene.
Greed and fear, for instance. In short, human nature.
But, if you bothered making a plan, stick to it. Why trading randomly?
Successful Forex traders don’t know where the market goes. They have an educated guess.
That’s all that is. Statistically, the price should go there. Hence, they’ll stand better chances to win.
That’s trading with the linear regression channel. Entering and exiting the market where, statistically, you know the price will react.
What else do you need?
START LEARNING FOREX TODAY!
- Bearish Channel
- bullish channel
- channel breakout
- Forex channel
- Linear Regression
- Linear Regression Channel
- Technical Analysis
share This:


Leave a Reply