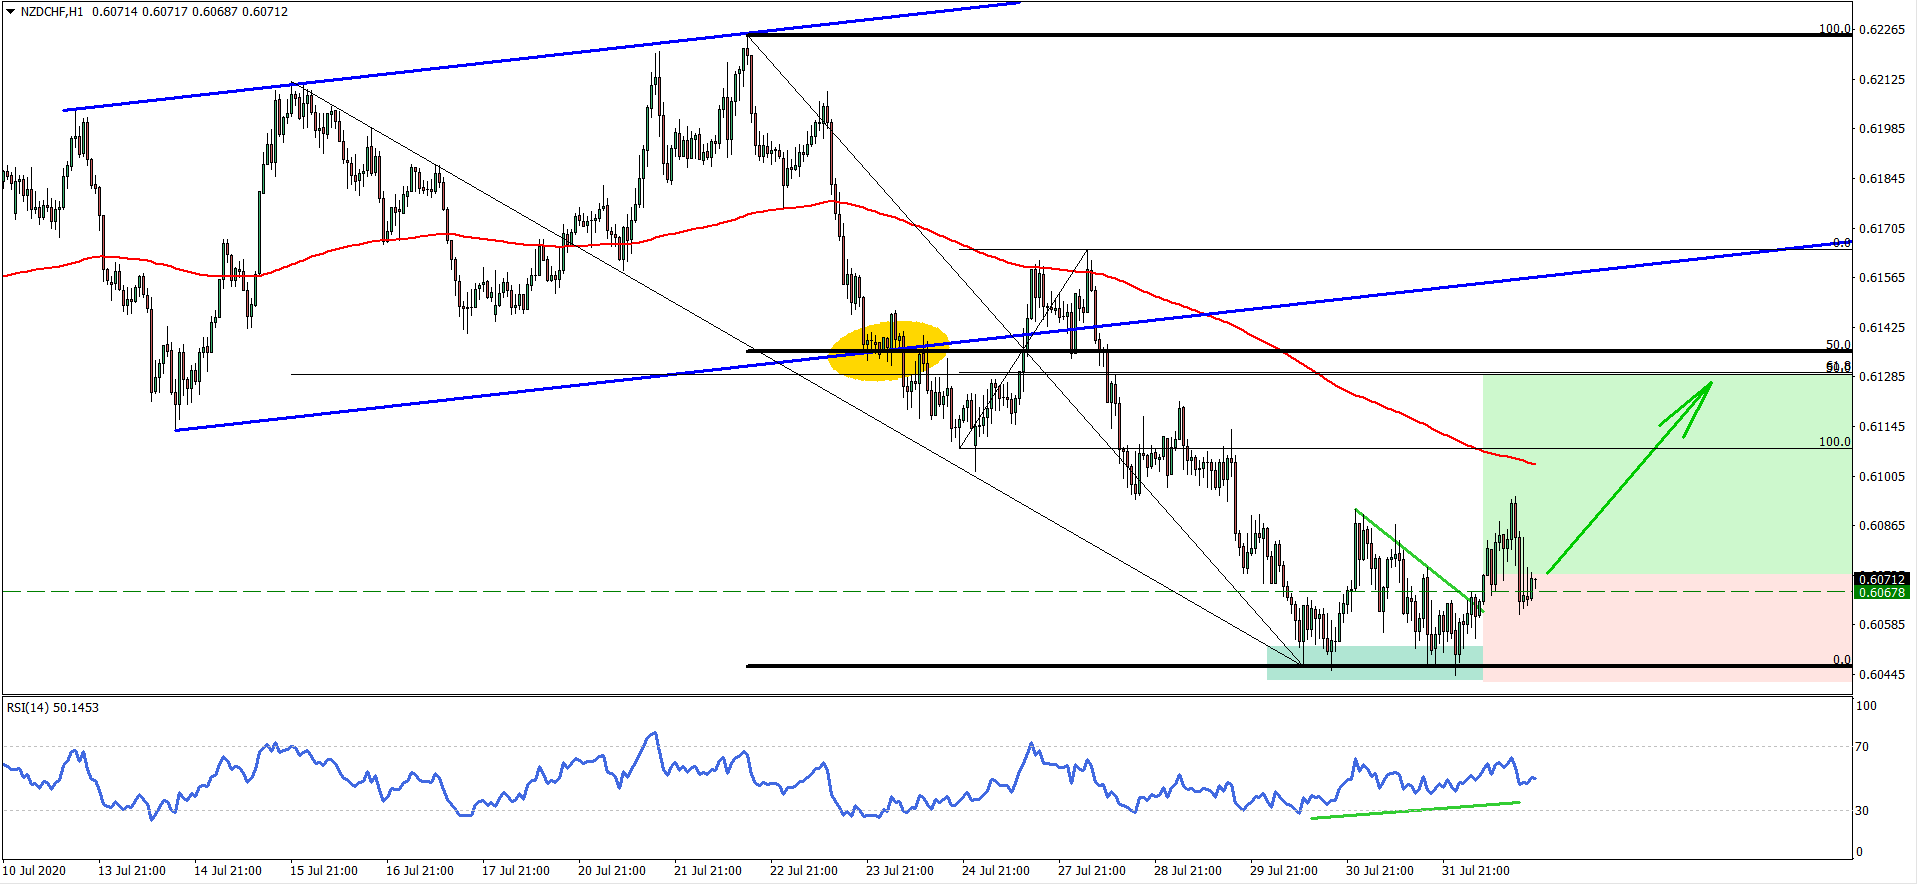
All-in-all NZD/CHF is showing signs of a trend reversal to the upside, but only as long as the 0.6046 support area holds. Along with NZD/CHF, many other XXX/CHF pairs are expected to rise due to the expected CHF weakness as per multiple previous analyses.
Disclaimer: The analysis presented in this article is for educational purposes only and should not be considered as financial advice.
This analysis was done on MetaTrader 4.
Click below to open a Free Demo Account with our trusted brokers:
Trade Idea Details:
NZD/CHF symbol on the MT4 platform
Type: Bullish
Key support levels: 0.6046, 0.6067
Key resistance levels: 0.6090, 0.6108
Price Action:
The NZD/CHF trend has been quite bearish since the price has rejected the top of the ascending channel at 0.6225 back on June 22. Pair has dropped by 177 pips during the period of 5 trading days, although finally, it found the support at 0.6046.
The support is confirmed by the Fibonacci retracement indicator applied to the breakout point of the descending channel, where 50% retracement was placed at the breakout. Clearly, the distance between the top of the channel and the breakout point equals to the distance from the breakout point to the 0.6046 support (0% Fibs).
At this support NZD/CHF has established a double bottom while the RSI oscillator formed a bullish divergence, suggesting a potential trend reversal. After the double bottom formation pair broke above the downtrend trendline yet again confirming an incoming bullish trend. This should result in price moving towards 0.6129, which is a key short to medium-term resistance level for NZD/CHF.
The 0.6129 resistance is confirmed by two Fibonacci retracement levels. First is the 50% Fibs applied to the overall downtrend. The second is 61.8% Fibs applied to the corrective wave up where 200 Exponential Moving Average has been rejected.
Potential Trade Idea:
The breakout point of the short term downtrend trendline seems like a logical entry point for buyers, which is located near 0.6070 level. Based on two Fibs, the key resistance and the upside target is at 0.6029. It is very unlikely that the price will produce a new lower low, which makes it reasonable to place the stop loss just below the recently established low at 0.6046


Leave a Reply