As you’re likely aware, there are a few different methods you can use to analyse the financial markets. One of them is called Technical Analysis (TA), which is the analysis of charts and the associated data surrounding them. Within this broad description there are a number of different ways you can apply TA, which at least partially depend on the chart types that you use.
There are 4 main types of charts you can use: Line Charts, Bar Charts, Candlestick Charts, and Point and Figures Charts. Some types of charts are easier than others to interpret, and they do not all display the same information, that’s why you need to be sure that you clearly understand the information that each type of chart provides, how they are constructed, and how they can be of help in your trading strategy.
The focus of this article is on Candlestick Charts, how you can use them to better gauge market volatility, and to improve your enter and exit strategies.
Quick-Guide To Japanese Candlestick Trading
Where does Candlesticks come from?
The origin of this trading method appeared in the 18th century in Japan from a rice trader named Munehisa Homma. He is rumoured to have made at that time a fortune in the rice markets. While he started recording price movements in the rice market – namely open, high, low, and close prices – he also started to recognize patterns and signals, to which he gave names that we still use today: doji, hanging man, spinning tops, hammer, etc. Homma then relied on these patterns to try to predict the direction of rice prices.
We use this charting methodology today thanks to Steve Nixon, the author that popularized candlestick charting to the Western world. Homma, through his other works, also taught us important lessons about trading (which are actually very close to the foundation of Technical Analysis).
The 1st lesson – even if he acknowledged the relation between the supply and the demand in rice markets, he also noted that market participants’ perception and sentiment could trigger a disruption of supply and demand forces. The market is, in part, a reflection of the psychology of its participants, specifically their emotions. Analysing the psychological aspect of the market allowed him to use it to his advantage.
The 2nd lesson – markets evolve in trend. If markets seem to be oversold, then there should be a buying opportunities, and vice-versa. The Japanese people adopted the Yin and the Yang from the Chinese philosophy, calling these two types of energies “In and Yo”. Homma also described markets rotation as Yang (bull market) and Yin (bear market).
The 3rd lesson – this lesson comes from the previous two lessons above. You should base your trading decisions on past prices to develop expectation for future prices’ evolution, using market participants’ sentiment, and pattern recognition. You should also use “naked charts” to quickly being able to identify potential opportunities through price movement analysis, as they reflect everything about the market.
How to read a Candlestick
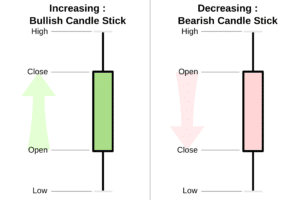
The body of the candlestick represents the range of the difference between the opening and closing prices.
The following picture describes well the energies we talked about.
Yang is a positive energy, which happens during a bull market: the closing price is above the opening price, and the candlestick is green (or white, depending on the broker).
Yin is a negative energy, which happens during a bear market: the opening price is above the closing price, and the candlestick is red (or black, depending on the broker).
Source: Wikipedia
From what we have said previously, we can see that the way in which candlesticks are built and follow each other reflects the psychological state of market participants.
Analysing the size of the body and the size of the shadows, or “wicks”, also contributes to better gauge volatility (black arrow on the chart), as well as who is in charge (bulls – green circles on the chart, or bears – red circles on the chart).
Candlestick analysis is also about identifying zones where you should enter the markets or accumulate, or on the contrary go out or close a part of your position.
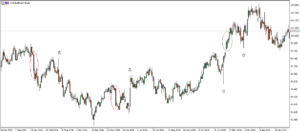
Source: MT5 – Activtrades
The intensity of the movement is also shown by the size of the body: long body vs short body. The more intense the buying/selling pressure, the longer the body will be. Conversely, the greater the indecisiveness the price movement is, the shorter the body will be.
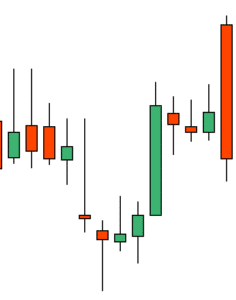
Source: MT5 – Activtrades
Long green candlesticks display a strong buying pressure (bulls), as the closing price progresses further above the opening price and bulls were aggressive. Long red candlesticks are a sign of strong selling pressure (bears), as the closing price is far below the opening price. Of course, the real meaning of these long candlesticks depend on their position within the broader picture: prices could reach a support/a resistance level and might be about to reverse. On the contrary, a long candlestick could be the beginning of a bullish/bearish movement, as the previous trend is over.
Basic indecision candlestick patterns
These patterns appear when the current trend is weakening, as the market is losing momentum, but without giving a proven and validated reversal signal. Indecisive patterns can lead to reversals, but not every time. Too many traders think that because they spot an indecisive pattern on the chart, a trend reversal will happen next. The true meaning of these patterns is more of a warning for traders: “the current trend is weakening and may not continue, so stay alert”.
Doji
During a given time frame, the opening and the closing price of a candlestick are the same (or almost the same), then this figure is called a Doji. You can find different varieties of doji, such as gravestone, dragonfly, and long-legged – it all depends on where the opening and closing are in relation to the entire range of the candlestick on the given period.
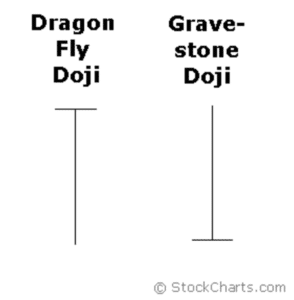
A dragon fly doji pattern will appear when the opening price, high and closing price are the same. The lowest level of the given time frame creates a long shadow downward. A gravestone doji pattern will appear when the opening price, low and closing price are the same. The highest level of a given time frame creates a long shadow upward.
Harami
A harami pattern is formed with two candlesticks: a long one, so one with a long body (bullish/bearish), followed by a smaller candlestick that fits inside the side of the previous one. If the previous trend was bullish, then the second candlestick will be bearish, while if the previous trend was bearish, the second candlestick will be bullish.
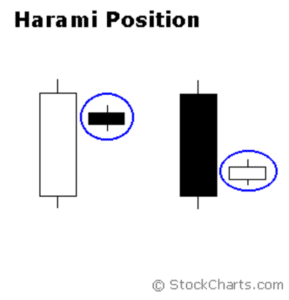
In Japanese, Harami means pregnant, which you should think of to remember that the second candlestick is nestled inside the first candlestick. Usually, harami patterns have small bodies, but they can also be a doji. This is called the Harami Cross.
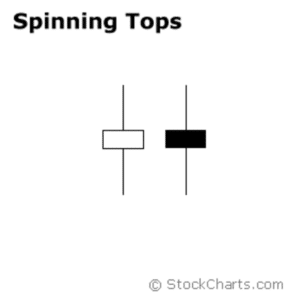
Spinning Tops
A spinning top is a candlestick pattern that has long upper and lower wicks, and a small body. The small body means that there is only a little movement from the opening to the closing. The wicks are showing volatility, both bulls and bears were active during the give time frame of the candlestick, but the market was ultimately neutral.
Basic continuation candlestick patterns
Continuation patterns in Japanese candlesticks display a sign that this is a continuation of the current trend. In a bullish trend, a continuation pattern offers a buying signal if a resistance had been broken, or if a rebound is already initiated from a support level. Conversely, in a downtrend, a continuation pattern offers a sell signal if a support level has just been broken, or if a correction is already initiated from a resistance level.
These kind of continuation patterns should only be taken into account when they appear close to strategic areas, such as supports and resistances levels, trend lines, channel, divergences, etc.
Bullish/Bearish Gap
Continuation gaps appear in the middle of a movement, in the same direction as the movement. This gap is a signal that the preceding trend is going to continue, this could be a relevant entry point.
A bullish gap occurs when the opening price of a candlestick is higher than the closing price of the previous candlestick. A bullish gap usually appears after a significant increase in the asset’s price. A bearish gap, however, appears after a significant drop in the asset’s price. The opening price of a candlestick is lower than the closing price of the preceding candlestick.
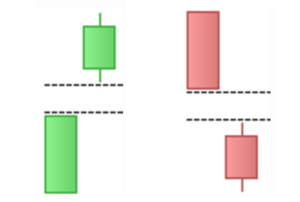
Source: CentralCharts
Rising/Falling Three method
A three method pattern appears within an uptrend to describe a sort of “rest” in the main trend. In the case of a rising three methods, buyers know that the selling pressure is not strong enough to reverse the trend. Conversely, with a falling three method, sellers believe that the buyers will not have such a strong impact, as the downtrend will resume soon.
If we take the example of the rising three method pattern, its structure is the following: five candlesticks, with the first one being is a large bullish candlestick (green) followed by three small bearish candlesticks (red), whose closing prices must be within the range of the first candlestick. Each small candlestick must close lower than the previous one, but shouldn’t be lower than the opening price of the first candlestick. Finally, the last candlestick must be a long bullish candlestick (green) and must close above the highest point of the first candlestick.
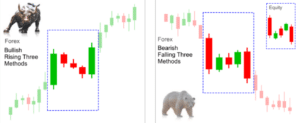
Source: Instaforexpips
Three White Soldiers/Three Black Crows
The structure of the three white soldiers is made up of three candlesticks. The closing of each candlestick must be above the previous one, and in the upper part of the current candlestick. The candlesticks should be approximately the same size. It is preferable that the opening is made in the body of the previous candlestick, but remaining above the median point.
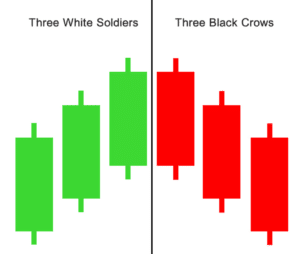
Source: BinaryTribune
Basic reversal candlestick patterns
Reversal patterns in Japanese candlesticks announce a change in the major current trend. In a bullish trend, a reversal pattern will give you a selling signal, if prices just reach a resistance zone, or if we are on the highest level of the given period of time observed. Conversely, in a bearish trend, a reversal pattern will give you a buying signal if prices just reach a support zone, or if prices are on the lowest level of the given period of time observed.
Hammer & Hanging Man
The hammer is a pattern made up of a single candlestick with a small body, bullish or bearish, and a large low wick, whose size must be at least twice as big as its body. The closing price of the next candlestick must be greater than the highest level of the hammer.
A hanging man has the exact structure, but appears within bullish trends, and the following candlesticks confirm the reversal. The hammer appears within a bearish trend, and represents a rejection where buyers are aggressive, and take control.
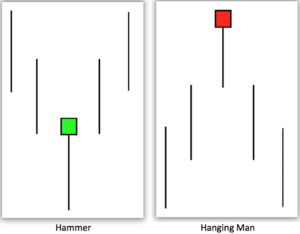
Source: 3rd Wave Consult
Piercing Pattern & Dark Cloud Cover
The piercing pattern structure consists of two candlesticks, with the first one being a long bearish one (red) followed by a second big bullish one (green). The opening price of the 2nd candlestick is done with a bearish gap, and the closing price should be above the median point of the body of the previous candlestick. This pattern means that buyers are taking control.
The inverse of the piercing pattern is the dark cloud cover: the first candlestick is a long bullish one (green) followed by a second big bearish one (red). The opening price of the 2nd candlestick has a bullish gap, and the closing price should be above the median point of the body of the previous candlestick. Sellers are taking control.
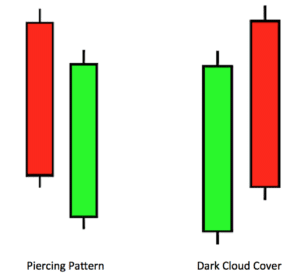
Source: Highwave360
Bullish/Bearish engulfing pattern
The bullish engulfing pattern is a structure formed by two candlesticks: the first one is a small bearish candlestick (red) followed by a long bullish candlestick (green). The opening of the second candlestick has a bearish gap, but the close will be above the level of the opening price of the first candlestick. The big candlestick, therefore, includes the first one. After a bearish trend, buyers are taking control. The more candlesticks the big one covers, the stronger the reversal will be.
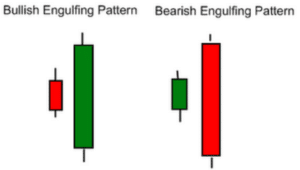
Source: fxtsp
Conclusion
Candlestick analysis, while quite old, is a popular and effective way for traders to analyse charts – among other uses, it allows traders to sport reversals, or breaks, in a trend. Of course, you first need to be sure to spot a trend, as you can’t have breaks or reversals in a range or lateral consolidation. A bullish trend is an upward movement which happens with higher highs and higher lows, while a bearish trend will happen with lower highs and lower lows.
START LEARNING FOREX TODAY!
share This:


February 25, 2017 at 4:43 pm, J0R0 said:
Hi, I am unable to print the article with images. A placeholder is left where the image should be. Tried in 3 browsers, Chrome, Firefox and IE and all have same problem.
April 04, 2017 at 9:22 am, Damyan Diamandiev said:
Hey J0R0,
Can you see the images now?