Every trader has heard of candlesticks. But not all traders have heard of a Heikin Ashi chart. To know how to read Heikin Ashi Candles, one needs to understand the concept first.
Most of the traders take today’s technical analysis for granted. They assume it was always like this.
In fact, technical analysis has changed. Trading has evolved, so technical analysis has evolved as well.
Technical analysis represents the way traders approach the market. In our case, the Forex market.
It has evolved over time, from basic concepts to super-complex trading theories. Moreover, it combines approaches from all over the world.
So, traders choose the approach that fits them best.
The Western world embraced Japanese candlesticks with enthusiasm. Furthermore, it added new things and improved the concepts.
While Japanese candlestick techniques are well-known now, few are aware of the power of a Heikin Ashi chart. Those willing to know how to read Heikin Ashi Candles, have come to the right place.
In this article, we’ll explain:
- What is a Heikin Ashi Candle?
- How to apply the Heiken Ashi indicator on a mt4 chart
- How to read Heikin Ashi Candles
- Trading strategies from a Heikin Ashi chart
- Advantages and disadvantages of using the Heikin Ashi formula
Moreover, we’ll cover common points between the Japanese and classic technical analysis approach. And, why candlestick charts are the preferred choice among retail Forex traders.
I’ll tell you what. At the end of this article, you’ll be fascinated about the Heikin Ashi chart’s power.And, the next thing you know, you’ll start searching for the Heiken Ashi indicator to see it with your own eyes. But, like every long journey, we must start with the first steps…
How to Build the Heikin Ashi Chart
Before Japanese candlesticks were introduced to the Western world, technical analysis had line and bar charts. Those exist today too.
However, ask any retail trader today what’s their favorite chart type. Invariably, the answer is a candlestick chart.
How come? What do candlesticks have that appeals to so many traders?
Several things we can mention here. First, candlesticks show great reversal patterns. and, they show them on the spot. Without any lag.
The head and shoulders pattern is a classic reversal one. But, by the time it forms and the price breaks the neckline, the market traveled a lot.
Moreover, it has a measured move. As such, most of the time traders end up trading only the distance from the neckline to the measured move. That’s too little.
Not the same with candlesticks. Second, a candle or a group of candles make fabulous continuation patterns.
They show future price action almost on the spot. However, continuation patterns on classic charts take their time.
Mostly, they are contracting triangles. They sure take their time until breaking.
Finally, even candlestick charts have taken something from classic technical analysis. As such, one has the benefits of a new approach to charting. And, old school technical analysis availability.
What else do you want as a technical trader?
Explaining the Heikin Ashi Chart
Imagine you’re a newbie to technical analysis. Then, think of a Forex chart.
Any chart you want. Next, pick a currency pair.
What’s the first indicator you’ll pick for your chart? I’ll give you some hints.
First, you’ll choose a trend indicator. Every trader wants to ride the trend.
That’s presented as an easy approach to trading. As such, it is the first choice among Forex traders.
Next, what trend indicator are you most likely to pick? Hint: a moving average.
Every trader has heard of it. Plus, it is really easy to understand the concept.
What if I told you candles have a moving average indicator as well? Or, one that resembles a classic moving average?
That’s the Heikin Ashi mt4 indicator. You’ll need it to see how to read Heikin Ashi Candles.
The Secret Behind the Heikin Ashi Forex Candle
In Japanese, Heikin-Ashi stands for “average bar”. How about that?
See the resemblance with a moving average? But, there’s a catch.
While a classic moving average indicator “averages” the prices in a period, the Heikin Ashi chart differs. Its candles follow these formulas:
- Close = (open + high + low + close)/4
- High = maximum value between
- High of the candle
- Open price
- Close price. Whichever is highest, that’s the value considered
- Low = minimum value between
- Candle’s low
- The open price
- The close price. The lowest value fits the bill
- Open = (open of previous bar + close of previous bar)/2
Let’s review. How to read Heiken Ashi Candles?
It all starts from calculating the new candle’s open. Here’s how:
- Add the open and closing price of the previous candle.
- Divide the result by two. That’s the open price of the new candle.
From this moment on, the candle builds itself. And so does the Heikin Ashi chart.
Applying the Heiken Ashi Indicator on a Chart
Fortunately, personal computers exist today. And, we can use the MetaTrader4 platform to automate the process described above.
Nowadays, we take such small things for granted. However, imagine if you had to do all these calculations by hand.
The Heiken Ashi indicator is key to the Heikin Ashi chart. Here’s why:
- It saves you a lot of time. You won’t have to do all that math. The indicator will simply plot the Heikin Ashi Candlestick for you.
- It is easy to install and use. Simply edit the settings to use it with your favorite parameters.
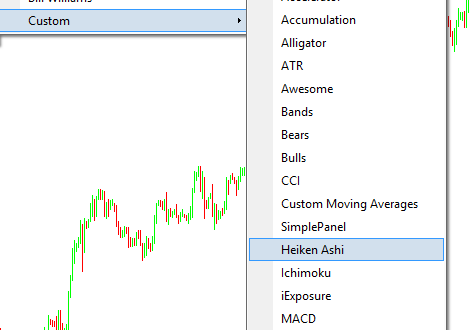
However, the Heiken Ashi indicator doesn’t come with the default mt4 settings. As such, we need to import it onto the trading platform.
That’s easy. Simply search the Internet for it. Next, download it. Finally, make sure you place it under the Indicators tab where the MT4 platform is.
Or, simply use the “Open data folder” tab from the MT4 platform, find the Indicators tab and paste the heiken ashi indicator there.
Because it is not a default indicator, you’ll find it on the Custom ones. The image below shows that.
And so, the Heiken Ashi chart is born. But, make sure you edit the background and the colors of the actual candles.
To avoid confusion, simply edit the Heiken Ashi indicator’s colors in such a way to fit your chart settings. Here’s how to do it:
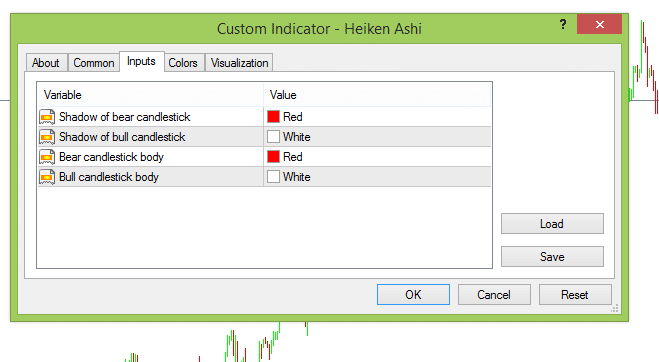
This way, you’ll see the Heiken Ashi chart in its beauty.
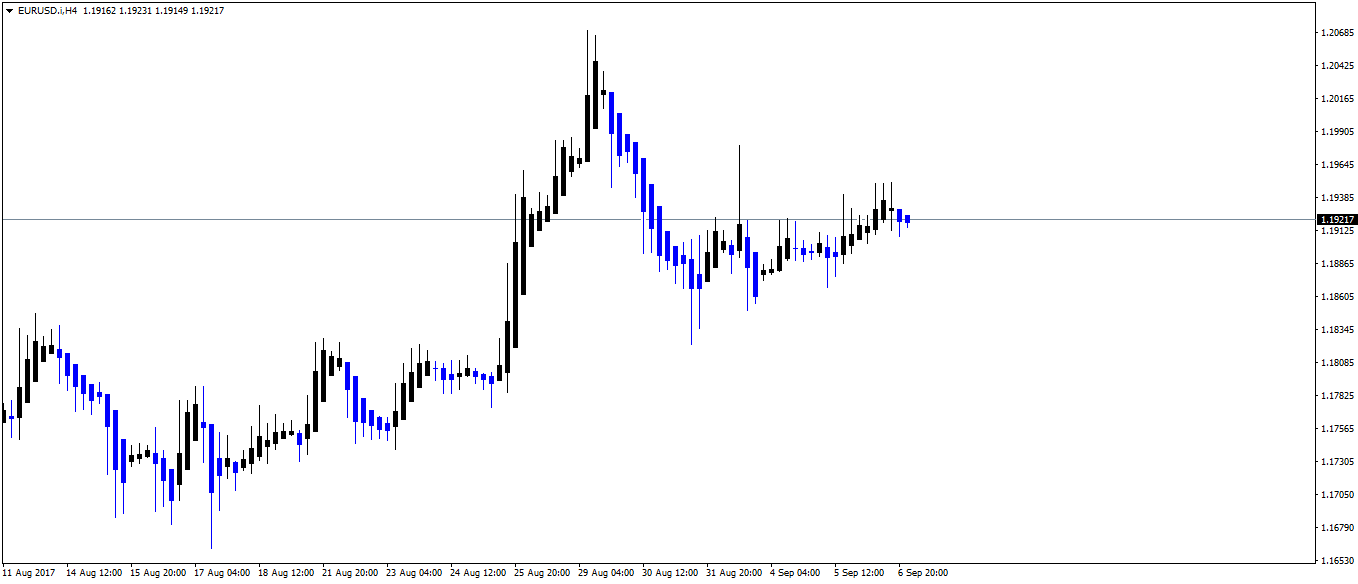
As you can see above, with black we have the bullish Heikin aAhi candles. And, with blue, the bearish ones.
How to Read Heikin Ashi Candles Charts
Have you noticed some differences between the Heikin Ashi chart above and a regular candlestick chart? If not, here are the most important ones:
- Short-term trends are highly visible. The chart appears smoother.
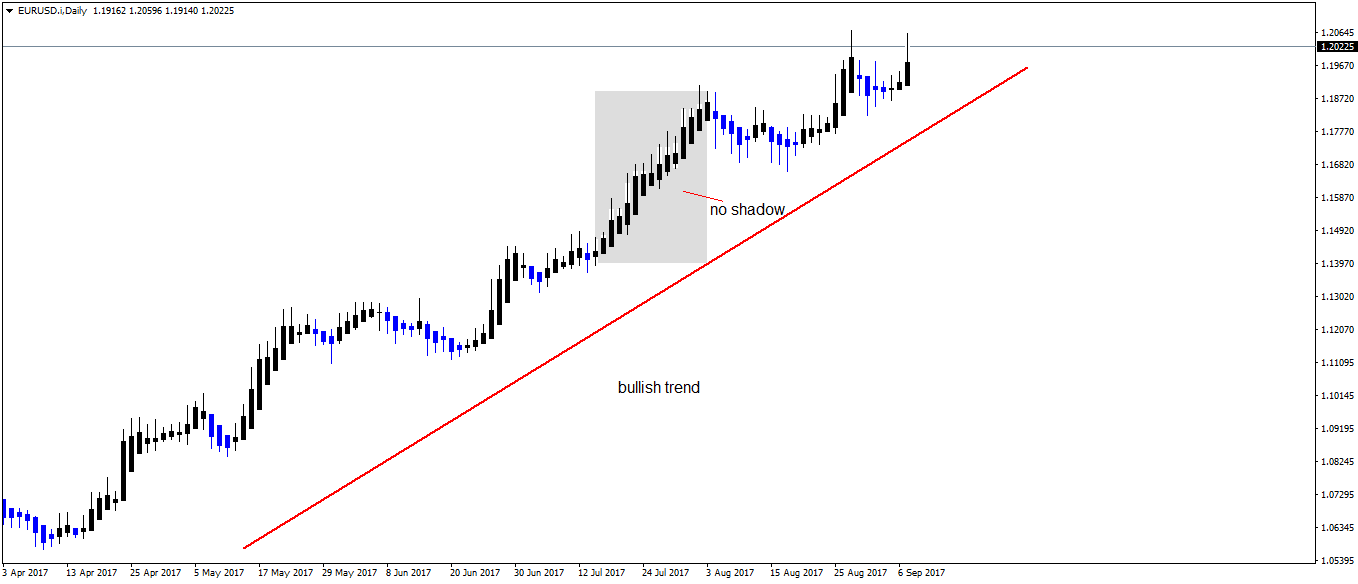
- Trends are easy to spot. When the market is in a trending mode, there are no shadows in the direction of the trend.
Therefore, a Heiken Ashi chart is great for trend trading. Let’s give it a try.
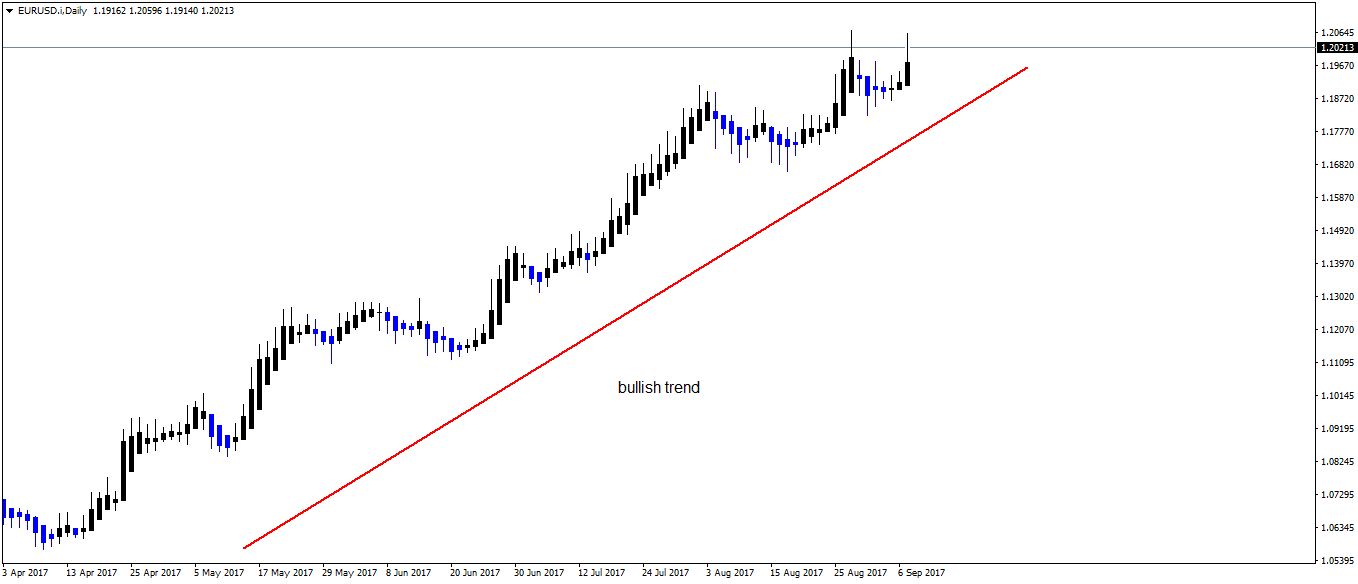
Above is the EURUSD daily chart. The pair rose since the 2017 summer started.
It had little or no pullbacks. Still, it had some.
But, being the daily chart, we want to know how to ride the trend. When to exit and when to exit. After all, that’s trading, right?
The Heikin Ashi chart has the ability to tell us when trends will continue. And, when they’re about to reverse.
As such, we can trade in the right direction. Of course, in a strong trend like the one above, the long side is favored.
How to Read Heikin Ashi Candles – Trading Strategies
Two things we must consider. They’re valid in both bullish and bearish trends.
When a Forex pair is in a bullish trend, the bullish candles have little or no shadow. That’s the definition of a strong trend with the Heikin Ashi chart.
As such, all you should do is to look at market formations like the ones below. That’s it.
This makes riding a trend on the Heikin Ashi chart very easy.
Trend Riding on a Heikin Ashi Chart
As usual, trend lines help. The idea is to ride the trend.
Hence, to trade in the trend’s direction. Or, only to look for opportunities to go long.
Classic patterns from technical analysis help. Trend lines, triangles, and so on.
Like the Elliott Waves Theory states, there’s no trend without its corrections. Even a bullish, five-wave structure, has two corrective waves.
The same here. The market won’t move in a straight line.
As such, the Heikin Ashi trader looks for the best opportunities to enter the market.
But, not at all costs. The Heikin Ashi chart offers the tools for great risk-reward ratios.
To ride a bullish trend, traders follow several steps. First, they look at a counter trend move. In this case, at a bearish move.
Second, they draw a trend line connecting the bearish candle’s upper parts. Third, they wait for the market to break the trend line.
Next, they go long at the close of the heikin ashi candle. And finally, they place a stop loss at the last lows in the correction.
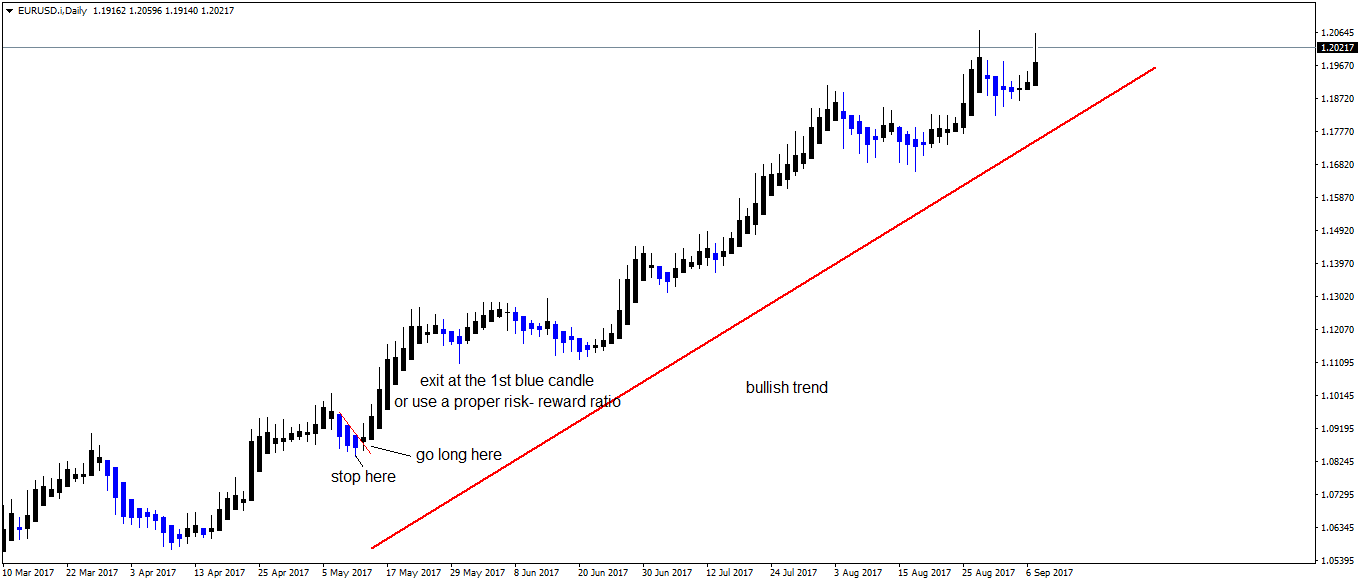
The Heikin Ashi chart above illustrates this Heikin Ashi strategy. Let’s review the steps:
- Draw a trend line connecting the bearish candle’s upper body
- Buy on a break
- Set the stop at the previous low
- Set the target.
For the target, traders two possibilities;
- Ride the wave. That is, they simply stay long until the first blue candle (bearish candle) forms. This is a two-way street. Sometimes the trend is so powerful, it is worth the risk. At other times, the first bearish candle wipes out all profits. And some more.
- Use a proper risk-reward ratio. I mentioned earlier that a Heiken Ashi chart offers fabulous risk-reward ratios. The above example says it all.
How to Read Heikin Ashi Candles – Spotting Reversals
One piece of advice moving forward. Set the stop loss at the lowest point of the ACTUAL candle, and not the Heikin Ashi candle. This way, you’ll stand a better chance of surviving trading algorithms programmed to run classic stops.
For the Forex market, money management is everything. It means, from the two options listed above, we should favor the second one.
A proper risk-reward ratio uses 1:2 or 1:2.5 as parameters. Meaning, for every pip risked, traders look for two and a half pips.
Even such a “small ratio” is hard to get. Not when it comes to a Heikin Ashi chart.
The example above shows even 1:5 or more can be reached. Moreover, using the same principles, plenty of other long trades appear.
But, when to stop? When to stop looking for long trades?
When will a trend fade? Can we tell that using the Heikin Ashi chart?
Yes, we can!
The key stays with the candle’s shadows again. That is the candle’s part of the trend.
Let’s use the same EURUSD daily chart example. We know the trend is a powerful, bullish one.
The market took the whole 2017 summer to rise almost in a straight line. More than five great trades resulted. And, with risk control in place.
However, it can’t go up indefinitely. The clues come from the black (bullish candles).
Look for them to change the structure. Namely, we mentioned earlier a strong bullish trend has no shadows on the lower part of the candles.
This time, before a reversal happens, the trend will hesitate. Falter.
Trend Reversals Examples with the Heikin Ashi Chart
The examples here show how to read Heikin Ashi Candles. More exactly, how to use them to trade reversals.
Above we said the focus should be on bullish candles with both upper and lower shadows. Let’s have a look at the same EURUSD chart.
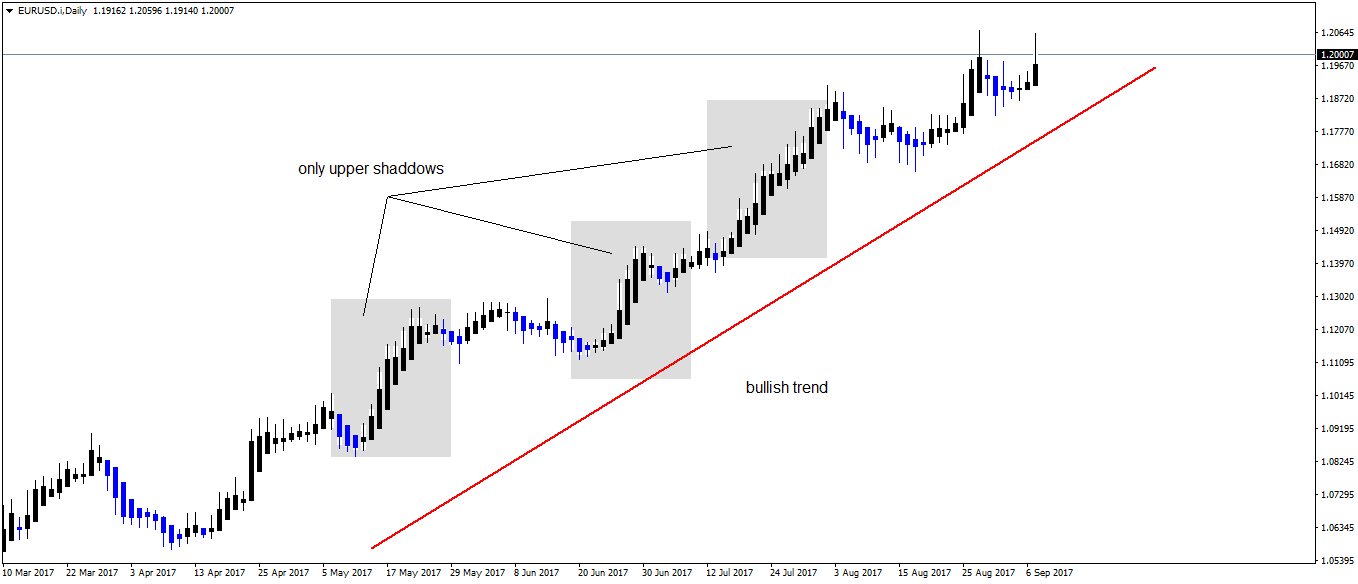
Every time the pair broke higher, the bullish candles had only upper shadows. That shows bullishness still.
That’s a sign to go long. For as long as the pair does this, use the trend trading strategy presented earlier.
What would make the daily EURUSD chart bearish? We already have a small, bearish sign, in a very strong, bullish trend.
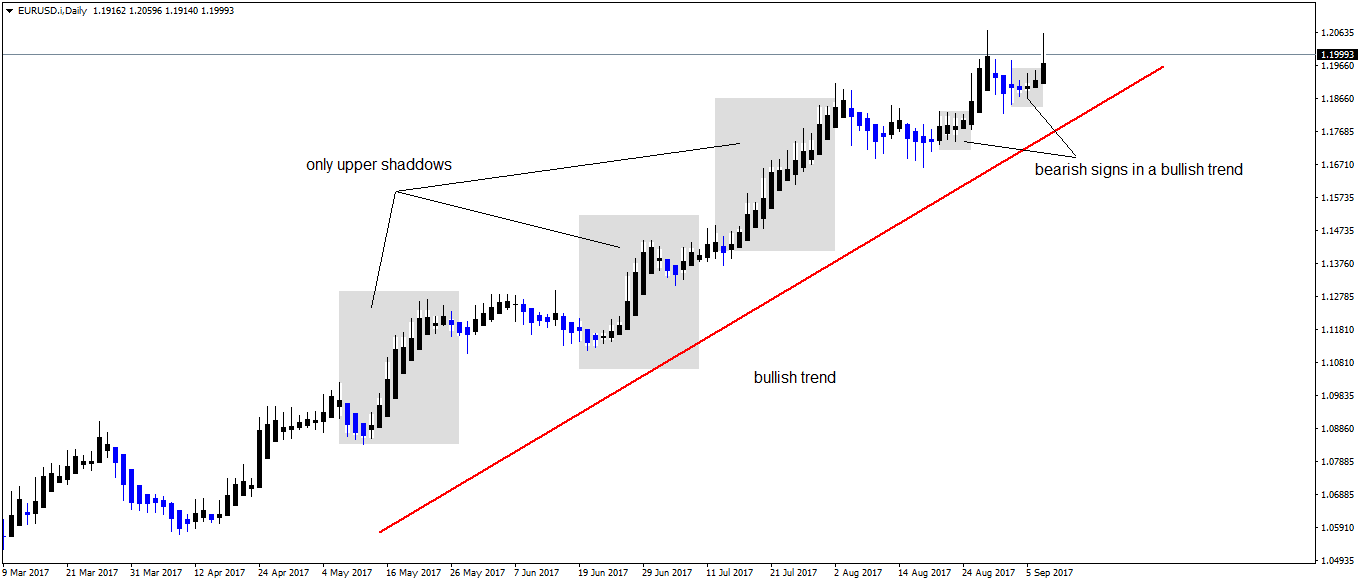
The Heiken Ashi chart above perfectly shows how to read Heikin Ashi candles. Or, bearish candles.
In the last two weeks, the price activity on the EURUSD pair looks fishy. Bulls start to lose control.
The bullish candles, or the black ones in our case, start forming both upper and lower shadows. That’s a sign of weakness.
Bulls will try to cover. And, early bears will look at it as a confirmation that the trend will finally reverse.
Pros and Cons of a Heiken Ashi Chart
The biggest advantage is that a Heiken Ashi chart filter the noise around a trend. That’s a powerful statement.
What does it mean? Trading today is mostly done by robots. Or, trading algorithms. Expert Advisors.
Traders program these robots. And, they’re often programmed to simply run stops on the previous swing.
The Heiken Ashi chart filters the shadows. Hence, the chart becomes cleaner. And, easier to read.
Isn’t it that all we want from a technical chart? To keep it as simple as possible. And, as accurate as possible.
When traders learn how to read Heikin Ashi candles, the first thing that comes to mind is their visibility. And simplicity.
On the downside, many traditional candlestick patterns lose their relevance. Because the Heiken Ashi indicator averages the values, patterns like the ones below won’t matter anymore:
- Morning and evening stars
- Dark-cloud covers
- Bullish or bearish engulfing
- Doji candles
- Piercings
Moreover, gaps won’t appear on a Heikin Ashi chart. That’s something for gap trading strategies and traders that look to address them.
Conclusion
Since the Japanese part of technical analysis became familiar to the Western world, traders embraced the concepts with enthusiasm. They had all the right to do so.
Classic technical analysis deals with continuation and reversal patterns. So does the traditional Japanese approach.
Moreover, traders combine the two approaches. And, pick the best of them both.
Classic technical analysis deals with trend indicators. So does the Japanese approach. And, the Heiken Ashi indicator is the most representative one.
Not only because it is simple to use and interpret. But, because it gives great trades. And fabulous risk-reward ratios.
After all, trading is about managing the risk. If there’s a way to limit the risk, while having great rewards, that’s the way to trade.
This is where retail traders fail the most. Building and respecting a money management system.
The way we look at markets differ from trader to trader. Some traders favor macroeconomics.
They understand differences between economies. And, act accordingly.
Others favor technical setups. But both categories need to know their way out of the market. Before they go in.
That’s money management. And, setups that make sense from a money management point of view won’t come easy.
Think of another technical analysis indicator from classic technical analysis. Then, look for risk-reward ratios like the ones shown in this article.
Chances are, you won’t find many. That says a lot about the power of a Heikin Ashi chart.
Now you know how to read Heikin Ashi candles. And, how to interpret one of the simplest and most powerful Japanese technical analysis concepts.
START LEARNING FOREX TODAY!
- candlestick charts
- chart analysis
- chart trading
- charting
- Forex Candlesticks
- forex charts
- Heikin Ashi
- heikin ashi chart
share This:


Leave a Reply