Shooting stars often appear in Forex. These candlestick patterns are a must-learn when getting started in trading. Most seasoned traders consider the shooting star to be a powerful price formation due to its effectiveness and reliability. It is also is one of the most common candlestick patterns in the market.
The shooting star is a single-candle pattern of bearish nature. It consists of a small body and a long upward wick. The shooting star signals that the current bullish trend is near its end and a reversal may take place soon. In combination with other indicators, this pattern can represent a sell trade opportunity.
 The Shooting Star Candlestick
In this article, we will show you the main elements of this pattern, how to spot it. Moreover, we will explain how you can trade it profitably and increase your odds of success.
Characteristics of a Shooting Star
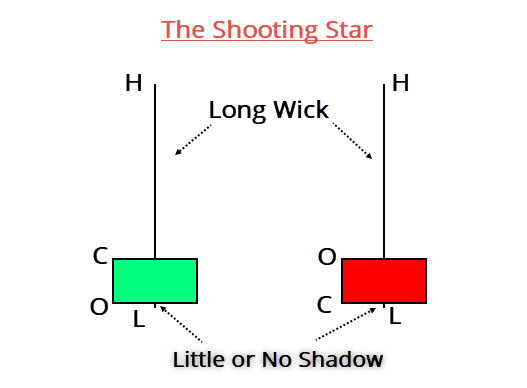
The shooting star has a short body due to the proximity between its open (o), close (c) and low (l) price levels. The second key element is the wick, which should be twice as large as the shooting star’s body.
 Anatomy of a Shooting Star
The left candle in the photo is green since the close is higher than open, while the right candle represents the opposite scenario. Although both candles represent a shooting star, the red candle is stronger since the bears take over and force a close near the session’s low.
Before we share tips on how to make money by trading a shooting star candlestick pattern, let’s first discuss the importance, as well as the key strengths and weaknesses of this formation.
Why is it Bearish?
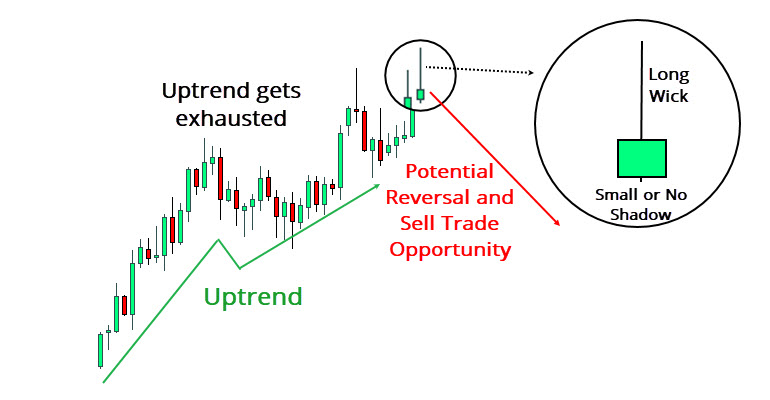
Based on the shape of a candle, a shooting star is a bearish pattern since the long wick is a sign of weakness on the side of the bulls. The upward momentum gets exhausted as the selling pressure grows.
A shooting star plays an essential part in the price action, as it signals an impending reversal. The bulls may have been building an upward motion for a long time and making gains, but the creation of a shooting star at the top of an uptrend sends a signal that this chapter of the story may end soon.
As traders, we always search for ways to capitalize on big moves. That is why a shooting star is a crucial element of the price action, as it signals that a new trend may be starting soon.
How to trade the Shooting Star Candlestick Pattern
As the shooting star pattern consists of a single candle, trading this formation is quite straightforward. As outlined earlier, a shooting star pattern occurs at the top of an uptrend as the bulls start to lose momentum.
 EUR/USD daily chart – How to spot a shooting star
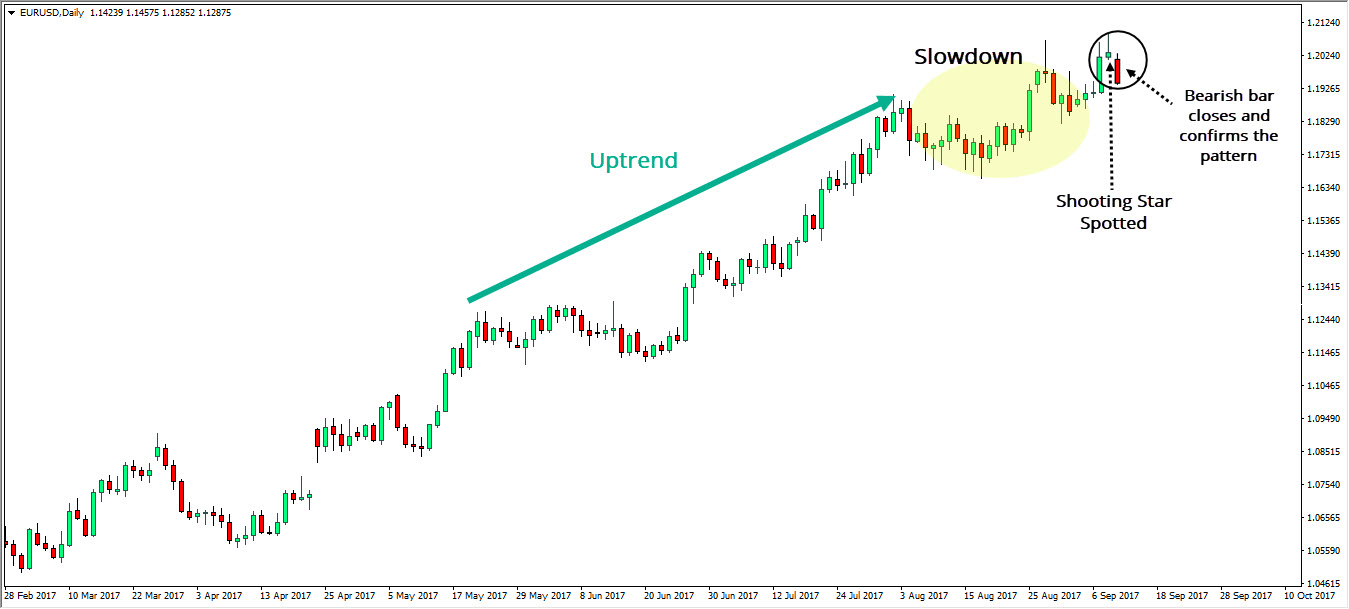
In an example above, we see how the EUR/USD is in a clear uptrend as the price action moves higher in a consolidated fashion. At one point, the price action creates a new short-term high, but the bulls fail to force a close in the upper part of the candle. On the contrary, the price rotates lower and closes near the session’s open and low price levels, thus creating a shooting star.
 EUR/USD daily chart – shooting star confirmation
In a short time frame, the price action creates two candles with long wicks that extend higher, which signals that the bulls are losing their momentum. Finally, a clean shooting star candlestick is formed and then followed by a long bearish candle that confirms the reversal.
Shooting Star Example on a EUR/USD Trade
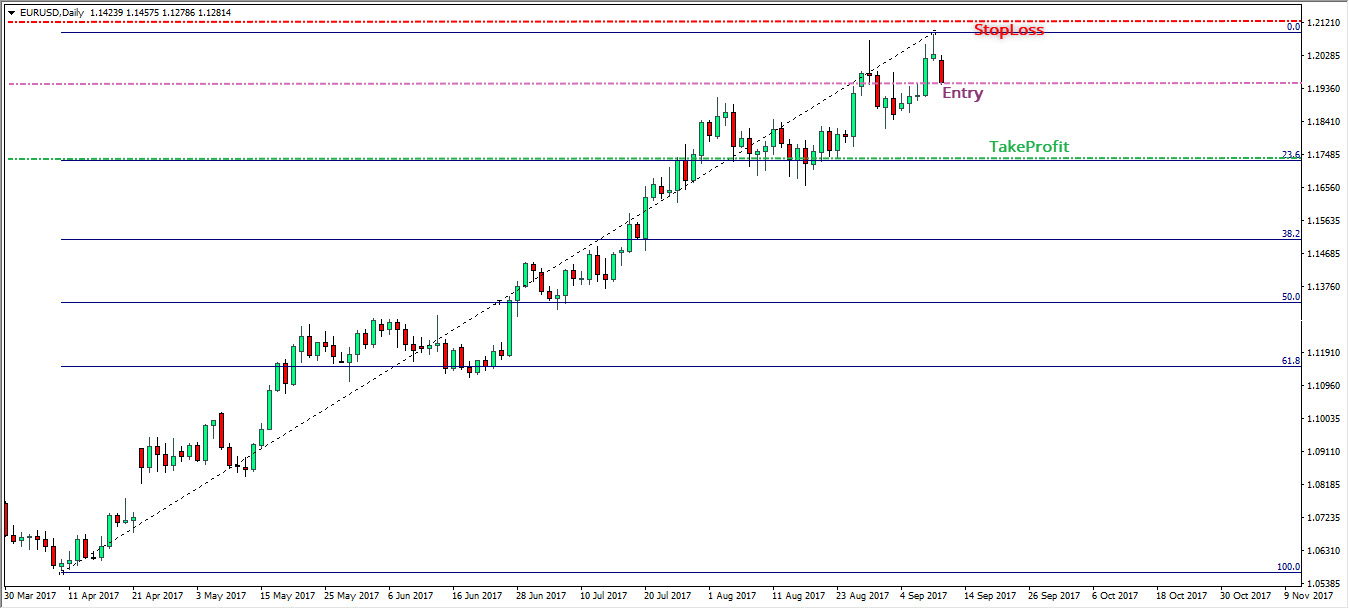
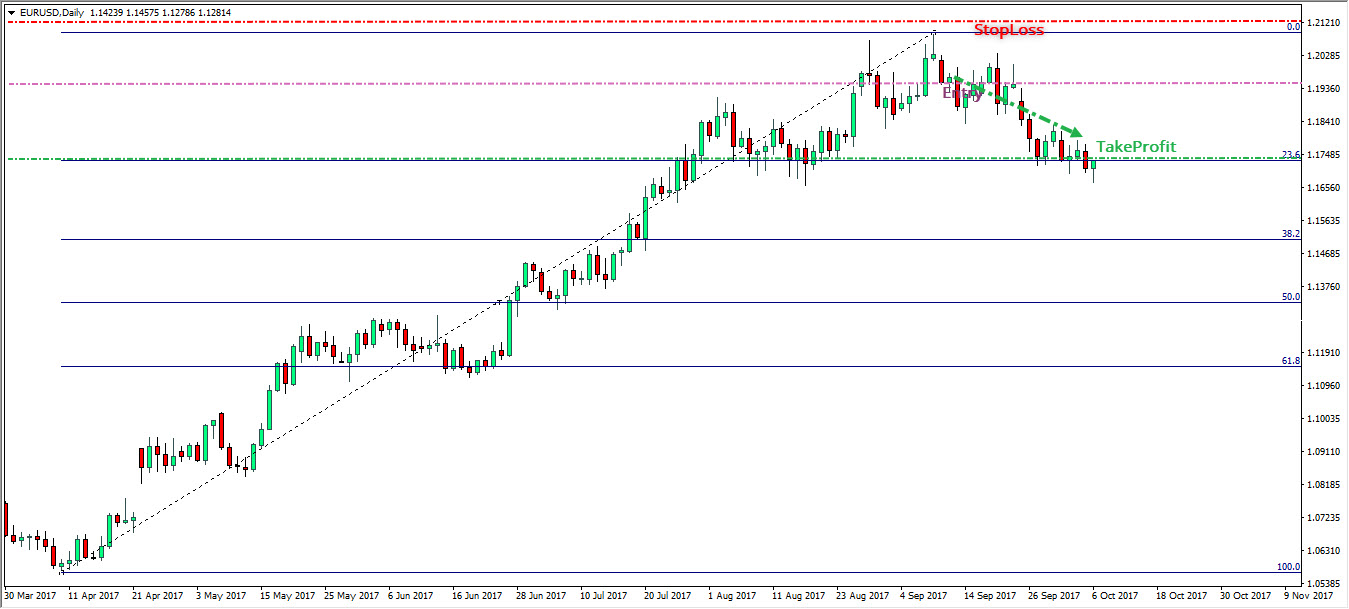
The three lines in the chart below represent key levels in a trade:
- The purple line is the entry point of the trade, which is near to the close price of a shooting star candle.
- The stop-loss order (red line) should be above the high, with some room left to allow for whips and low-liquidity moves.
- The take-profit level depends (green line) on your trading style and risk management. In this particular example, we placed a profit-taking order at the previous resistance. Given that the market had pushed through this resistance line, it is likely to come back to test it in the context of support once it corrects lower. This resistance is also illustrated by the 23.6 Fibonacci Level.
 EUR/USD daily chart – How to trade a shooting star candlestick
Ultimately, the chart above shows how the trade evolved positively. We risked 75 pips to gain 150 pips, which represents quite a good risk to reward ratio.
 EUR/USD daily chart – Trade evolved successfully
As said earlier, you should be cautious and not try to trade all shooting stars you can see on a chart. The reason we decided to trade this opportunity is that we had two additional signs that signaled an impending reversal.
First, there was a long wick to the upside in one of the prior candles that sent a similar message. Although it looks similar to a shooting star, this candle is not classified as such (we will address this question below). Secondly, the next candle after the shooting star candle was a bearish candle that further validated our idea: the reversal had just started.
It is imperative is to consult other technical indicators and do your homework as your capital is at risk here. Here is a list of tools you can use to confirm a trade idea:
- Fibonacci retracement or key levels
- A Moving average
- Head and Shoulders Pattern
Strengths and Weaknesses
As outlined above, a significant strength associated with the shooting star is its signal that a reversal may take place soon, as the uptrend is near its end. It is considered to be a potent formation due to its effectiveness and reliability.
On the other hand, as it is the case with all candlestick patterns, a shooting star issues a signal, not a trading signal. For this reason, always verify the validity of a signal by checking other technical indicators.
This is especially the case with single-candle patterns since it is tough to predict future trends based on the shape of a single candle. Also, it is useful to check other candles near the shooting star candle to assess additional confirmation of a reversal.
The difference between the shooting star and other candles
Given that there are more than 100 different candlestick patterns, it is no surprise that some of them look very similar. In this particular case, it is worth noting the difference between a shooting star and a hammer, an inverted hammer, and a gravestone Doji.
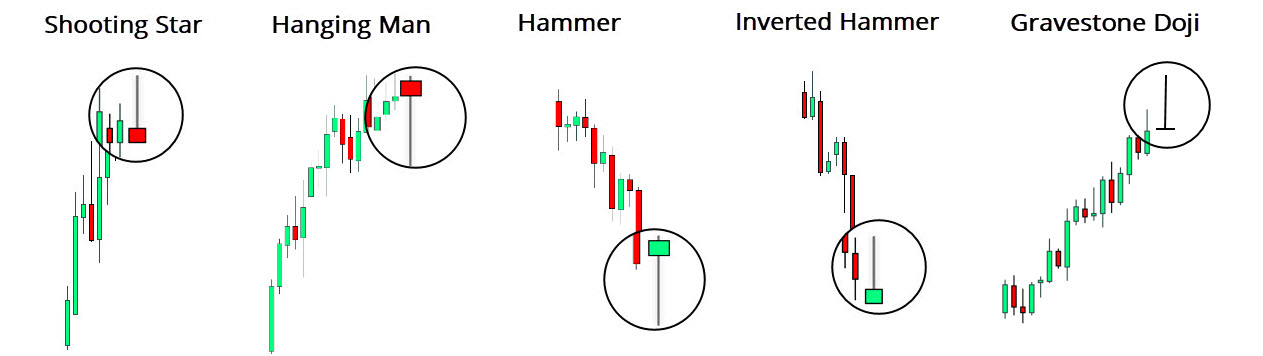
The Hammer
A shooting star is a hammer pattern turned upside down. Both send the same message: a change in the price direction may start soon. The big difference is that the former is a bearish reversal pattern, while the latter is a bullish reversal formation.
A hammer takes place at the end of a downtrend, while a shooting star occurs at the end of an uptrend.
The Inverted Hammer
An inverted hammer occurs at the bottom of the downtrend when the bears show the first signs of weakness and tiredness. Like a hammer, an inverted hammer is a bullish reversal pattern that signals the growing presence of the bulls in the equation.
The difference between an inverted hammer and a shooting star (Source: Intraday Trading Signals)
As seen in the photo above, an inverted hammer takes place in a downtrend while a shooting star occurs after a series of bullish candles that bring the price action higher.
The Gravestone Doji
The gravestone Doji pattern looks almost entirely the same as the shooting star candle. Traders consider it to be a bearish reversal pattern that takes place at the end of the uptrend, again the same as the shooting star.
The critical difference between these two candles is that a shooting star formation has a body. Whether the body is green or red is of lesser importance.
As seen in the photo above, a gravestone Doji candle (1) has no body structure, but the close and open levels are the same, which is the key characteristic of all Doji candlestick patterns. On the other hand, a shooting star has a small body (2). A combination of these two patterns increases the chance of a bearish reversal.
Summary
A shooting star is a single candle bearish reversal pattern that occurs at the top of an uptrend. The price action moves higher until it prints a new high, which is then not followed by a strong close. The bears use this opportunity to get a closing price near the open and session’s low.
This pattern has a long shadow that extends higher, preferably a new short-term high. A shadow should also be twice the size of the body. A shooting star pattern is important since it signals that the price action may reverse its course, as the bulls appear to be losing their momentum.
As always, verify these signals by checking other candles and indicators, and look for confirmations before you enter a trade based on a single pattern.


Leave a Reply