
In this article, we will share a candlestick cheat sheet that will help you improve your price action technical analysis. In addition, you will be able to identify the top 5 candlestick patterns and improve your strategy. Forex candlestick patterns are special on-chart formations created by one, or a few, Japanese candlesticks. There are many […]
One of the most important ingredients for successful trading is Forex chart patterns technical analysis. Recognizing figures on the graph is an essential part of the Forex strategy of every trader. It is vital that you learn chart patterns and their meaning. I have decided to spare some time to show you how to trade […]
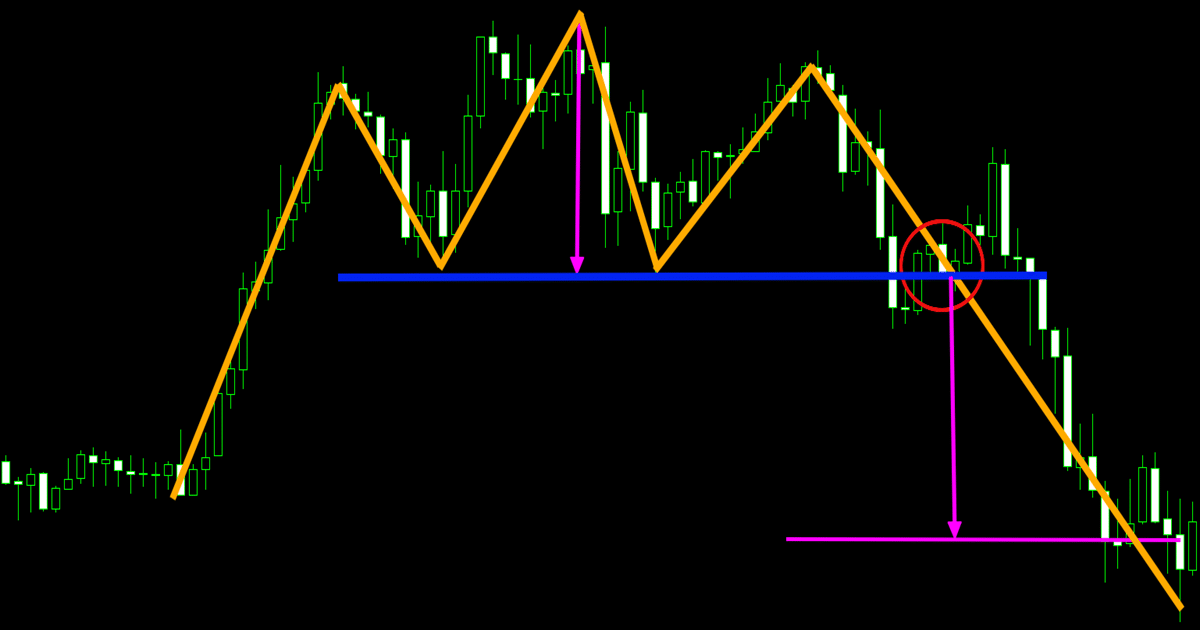
Forex trading has much to do with trends. To ride them, traders look for trend continuation patterns. To fade them, they ignore continuation patterns and focus on reversal ones. There aren’t many continuation patterns technical analysis provides. But those that exist are enough for the right positioning. Any journey into continuation patterns technical analysis offer […]
The new trading example today is on the USD/JPY Forex chart. The price action created a bullish triangle breakout that appeared after a big swing on the chart. The further activity of the price created a good trading opportunity in bullish direction. Signals of the Bullish Triangle Trade The price action dropped drastically on mixed US Jobs […]
Taking on Forex trading is, like any endeavor, a journey that has its own set of victories and defeats. For you to become a successful trader, besides diligently educating yourself, planning, and executing your strategies, the ability to remain coolheaded and not get tangled up in emotions is as crucial as the rest. This is […]
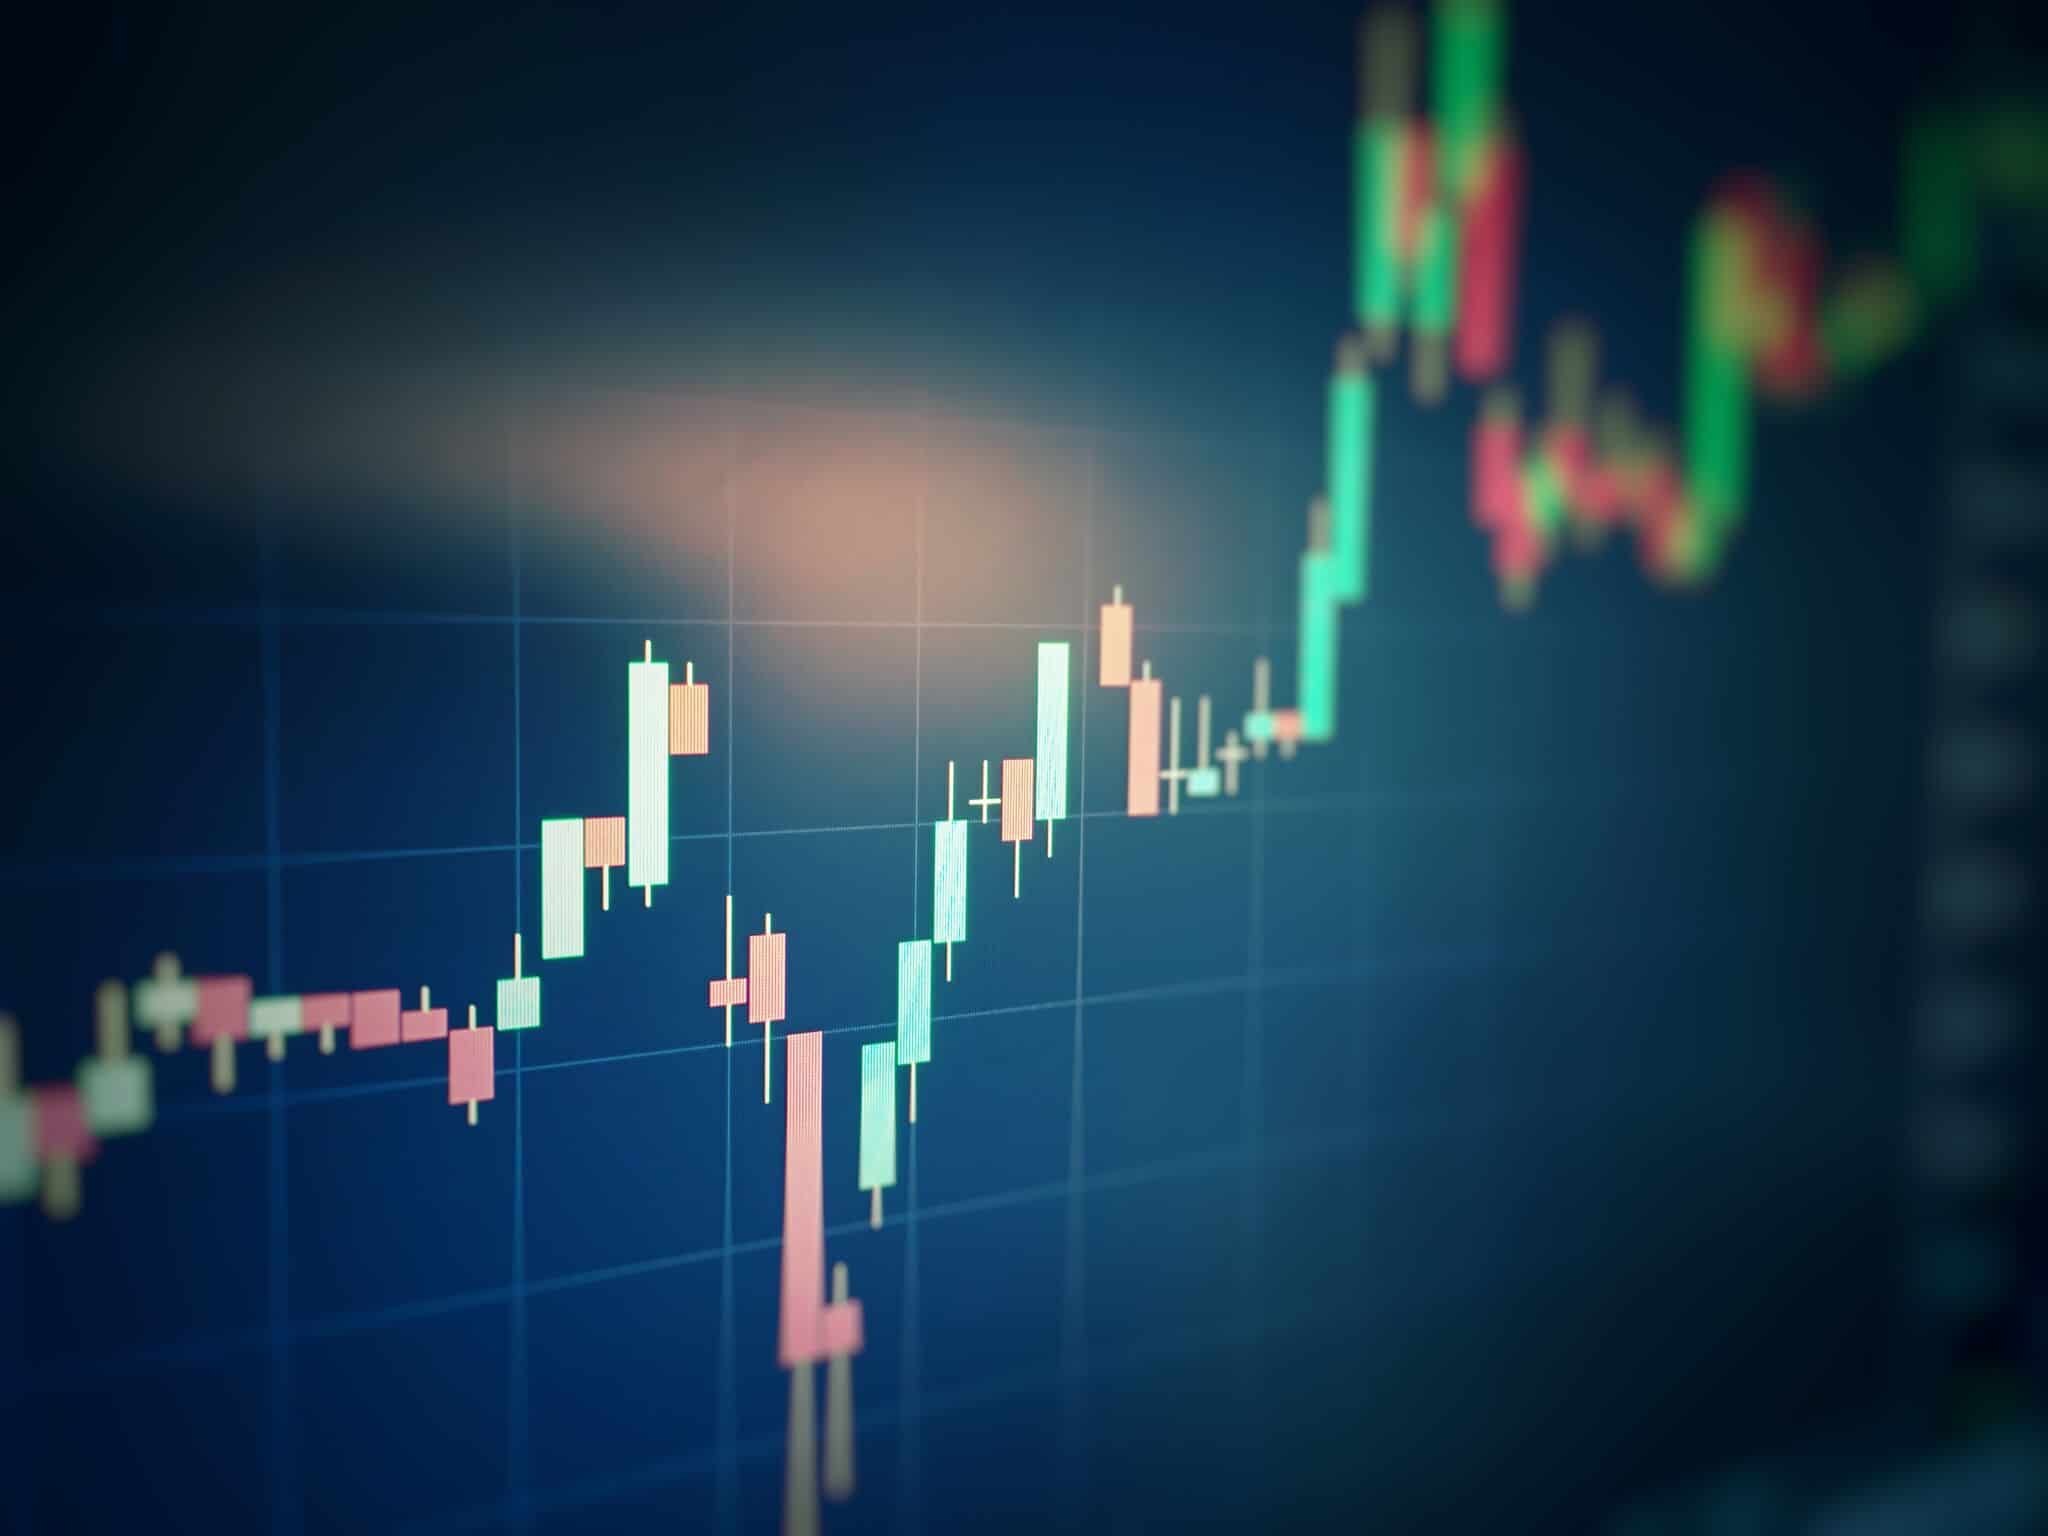
As you’re likely aware, there are a few different methods you can use to analyse the financial markets. One of them is called Technical Analysis (TA), which is the analysis of charts and the associated data surrounding them. Within this broad description there are a number of different ways you can apply TA, which at least partially depend on the chart types that you use. (more…)