Technical analysis is the base of speculation. Therefore, understanding technical analysis using multiple timeframes comes handy in Forex trading. Moreover, technical analysis using multiple timeframes by Brian Shannon became almost a cult among retail traders.
And, for a good reason. Brian took technical analysis to a new level.
His approach to Forex trading looks at markets through a different eye. He considers both market structure and trend alignment in his analysis.
But, technical analysis using multiple timeframes by Brian Shannon is more than a technical analysis approach. It gives a way of trading.
In this article, we won’t focus on Brian’s work. After all, there’s plenty of information about it on the Internet.
However, we will touch the technical analysis using multiple timeframes subject from a new perspective. The idea is to:
- Make it clear and simple for everyone
- Present sound strategies
- Use Forex timeframes accordingly
- Show how trading multiple timeframes works
In the end, it doesn’t matter the approach used. In Forex trading, only the winners celebrate.
As we all know, this is a dog-eat-dog world. The market has no mercy.
Technical analysis or not, nobody cares. At the end of the day/week/month/year, you’ll worth the number of pips made. Nothing more.
Some traders use fundamental analysis only. But, the right approach should use both analyses: technical and fundamental.
If there’s a reason for a move to happen (typically a fundamental one), there’s a chart that predicts it. That’s technical analysis.
Every trader has a different approach. And, understanding of it.
Even the same trading theory has different results. How come?
Human nature has the answer. Traders cope with stress and emotions differently. As such, the results differ.
Technical Analysis in Forex Trading
Throughout time, traders looked for patterns to predict the future. That is, to predict future prices.
It all started in the early 1900’s when the basics of charting appeared in the United States. Imagine how things were back then:
- No Personal Computers (PC)
- No Internet
- Printers? Dream on…

How did traders approach a chart? Pen and paper is the right answer.
The stock market provided the moves. As such, traders keen on finding the holy grail took a pen and paper and drew levels.
From levels, they reached patterns. Moving forward, models became trading theories. And, trading theories lead to technical indicators.
The funny thing is that technical analysis in Forex today is no different. I mean, the market differs, of course.
Forex trading today:
- Refers to a different market.
- Covers the entire world
- Uses automated machines to open/close trades.
The above are only some of the differences between the two. Moreover, technical analysis of Forex market brought something new to the table: speed.
More exactly, the speed the market reaches the take profit/stop loss level. Because robots govern today’s trading, execution times keep shrinking.
Even today new and new technologies appear. As such, execution improves almost every year.
In the meantime, computers appeared. Oh my God, what a relief…
Can anyone imagine Forex trading in 2018 without a computer? Or, without an Internet connection?

PC’s made it easy to:
- Chart historical data
- Use multiple timeframes analysis
- Spot patterns easily
- Correctly draw trend lines
- Use and develop technical indicators (oscillators and trend ones)
And much more. Above all, they gave access to trading theories thought lost. Therefore, traders, today have plenty of technical tools to choose from.
Forex Trading Theories in Today’s Markets
Usually, Forex traders come to the market with little or no knowledge. Moreover, they jump and fund a trading account without knowing what they’re doing.
Statistically, that’s a fatal mistake. Over ninety percent of them end up losing money.
The reason belongs partly to technical aspects. And, to advertising.
Forex brokers present trading as super-easy. Which, apparently, is not.
So, traders end up opening a trading account. Next, they fund it and lose their deposit. Finally, they’re willing to learn.
And so, the technical journey begins. Technical analysis for Forex traders starts with basic aspects:
- Trend indicators
- Oscillators
- Market geometry
- Support and resistance
- Head and shoulders
- Wedges
- Flags
- Pennants
But it won’t stop there. For those willing to put more time into it, they’ll discover:
- Japanese candlesticks techniques
- Cycles in the market
- The importance of historical data, etc.
And then there are trading theories like:
- Elliott Waves Theory
- Drummond geometry
- Point and Figure
- Harmonic patterns
- VSA – Volume Spread Analysis, etc.
In a nutshell, everything above makes technical analysis. However, each trader ends up knowing a bit of every field but mastering none.
For this, they must lean more into a theory. They must bring something to the trading table:
- Putting in the time in front of the screen
- Stop treating trading as a hobby
- Always experiment new things, etc.
In fact, this is how technical analysis evolved in time. And, this is how it will change in the years to come.
Because the market changes, the approach to treat it will change too. One thing won’t, though: the role of multiple timeframes trading.
Technical Analysis Using Multiple Timeframes
One of the reasons so many traders fail is because they miss the big picture. For some, the big picture represents the fundamental aspect.
Well, this is normal. Forex pairs have two currencies.
Moreover, each currency belongs to an economy. If currency pairs move on economic news, how about forming an idea about an economy?
Therefore, Forex trading means comparing two economies. In earnest, it means having the bigger economic picture in mind and act on it.
The sum of all economic news defines the shape of the respective economy. When it points to expansion, that’s bullish. Of course, a decline in economic activity will, sooner or later, result in a decrease in the currency’s value.
Can we do the same with technical analysis? The answer is yes.
And, technical analysis using multiple timeframes by Brian Shannon explains it. But it represents only one point of view.
In fact, looking at multiple timeframes on the same currency pair gives the bigger picture. The technical bigger picture.
Combined with the fundamental one, it represents a powerful tool in the hands of smart traders.
Perhaps the best use of multiple timeframes trading is seen in one of the most popular trading theories: the Elliott Waves Theory.
Forex Timeframes in Elliott Waves Theory
The theory developed by Ralph N. Elliott considers impulsive and corrective waves. Five waves make an impulsive wave, while three waves show a correction.
But one of the most significant challenges for Forex traders is where to start the count from. Or, how to know when a move ends and the other one starts?
Elliott built the theory around market cycles. To this day, this represents one of the enigmas surrounding the approach.
While the overall principle sounds easy to understand and apply, cycles makes it difficult. Supercycles, grand cycles, minuetes…difficult concepts to understand and practice.
However, since technical analysis in Forex market evolved, the Elliott theory became “accessible” again. Technical analysis using multiple timeframes holds the key.
Elliott wasn’t the first one to use cycles in interpreting the market. Hurst’s cycles are as bit as famous.
But Elliott introduced the following concept: the market forms various cycles within cycles of bigger degrees.
Such complex becomes the analysis that many traders lose the sense of it. And, that’s a shame because the principle is one of the most influential technical analysis has ever seen.
Top/Down Analysis in Forex Trading
One of the things that lead to success in trading comes from building a strategy. Then, following it on and on.
Money management is the same. First, find the proper risk-reward ratio. Second, set the risk per each trade. Finally, use and repeat. On and on, without questioning.
The same with technical analysis. Find a setup that works. Next, use it on multiple timeframes. Moreover, on multiple currency pairs. Finally, repeat again and again.
A top/down analysis holds the key to the Elliott Waves Theory. It brings traders closer to understanding the famous Elliott cycles.
Technical analysis using multiple timeframes show where to start the count. And, on a top/down analysis, we should start with the bigger timeframe.
Elliott traders use historical data a lot. In fact, without historical information, the analysis loses its importance.
The thing to do is to start from the biggest timeframe possible. Sometimes that’s even the yearly one.
Next, traders analyze the cycles of a lower degree. And, they do that until reaching timeframes they can trade.
Today’s timeframes available on every broker include:
- Monthly
- Weekly
- Daily
- 4h
- Hourly charts.
Below hourly, things become too noisy for the Elliott theory.
If you put the original Elliott cycles to the above timeframes, you’ll find the key to what Elliott suggested over a century ago. That is, the market reacts in various cycles due to human nature’s interference.
Technical Analysis Using Multiple Timeframes – The USDJPY Example
Below, the USDJPY weekly chart shows part of an Elliott Wave’s count. That’s the representation of an Elliott cycle.
Trading multiple timeframes implies having “bits” of the entire analysis on each timeframe. Let’s try to translate the chart below. Of course, some Elliott knowledge helps.
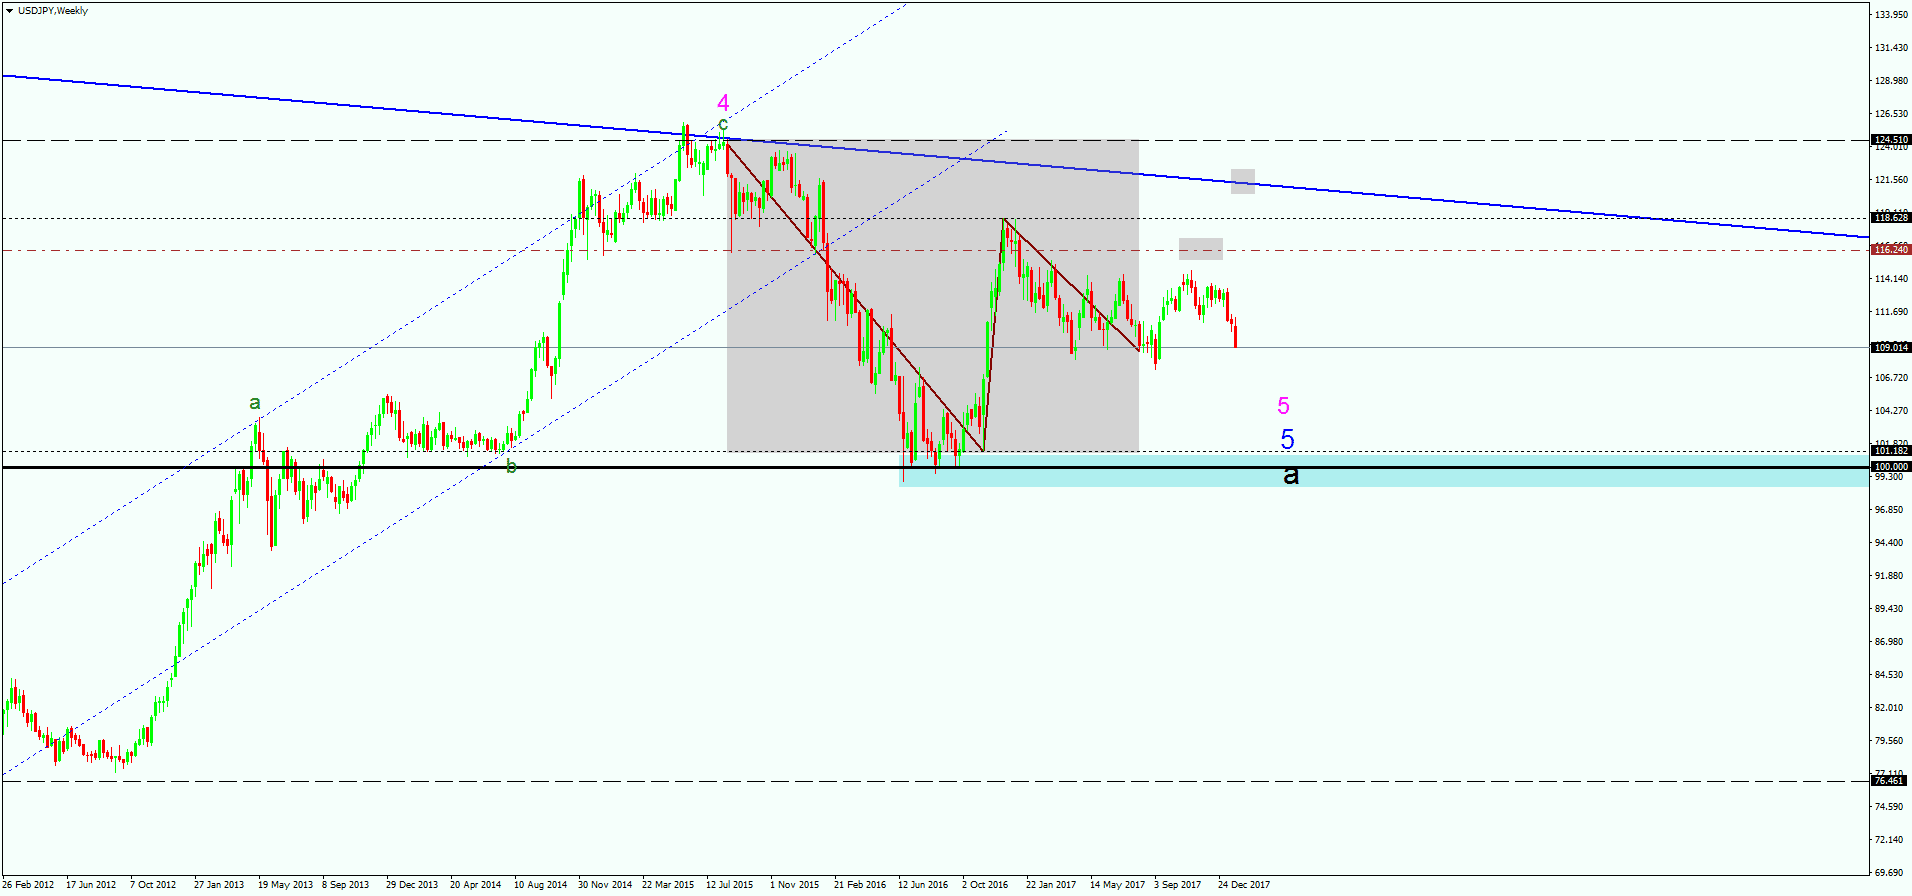
First, we see the maximum value shows a number. It means this timeframe shows an impulsive wave. Or, at least parts of it.
However, a closer look reveals a stunning development: the 4th wave in magenta has letters of a lower degree. That forms only in so-called terminal patterns.
In classic pattern recognition approach, this is a wedge. A falling one.
In Elliott Waves terms, the market forms a terminal impulsive move. Moreover, it shows analysis on the left side of the chart (bigger timeframe – monthly). And, it gives the place to start counting on the lower timeframe – weekly.
How cool is that?
Therefore, the monthly chart will show the analysis prior to the 4th wave. Consequently, the lower time frame (the daily one) will show the detailed analysis in the 5th wave.
Here’s an attempt:
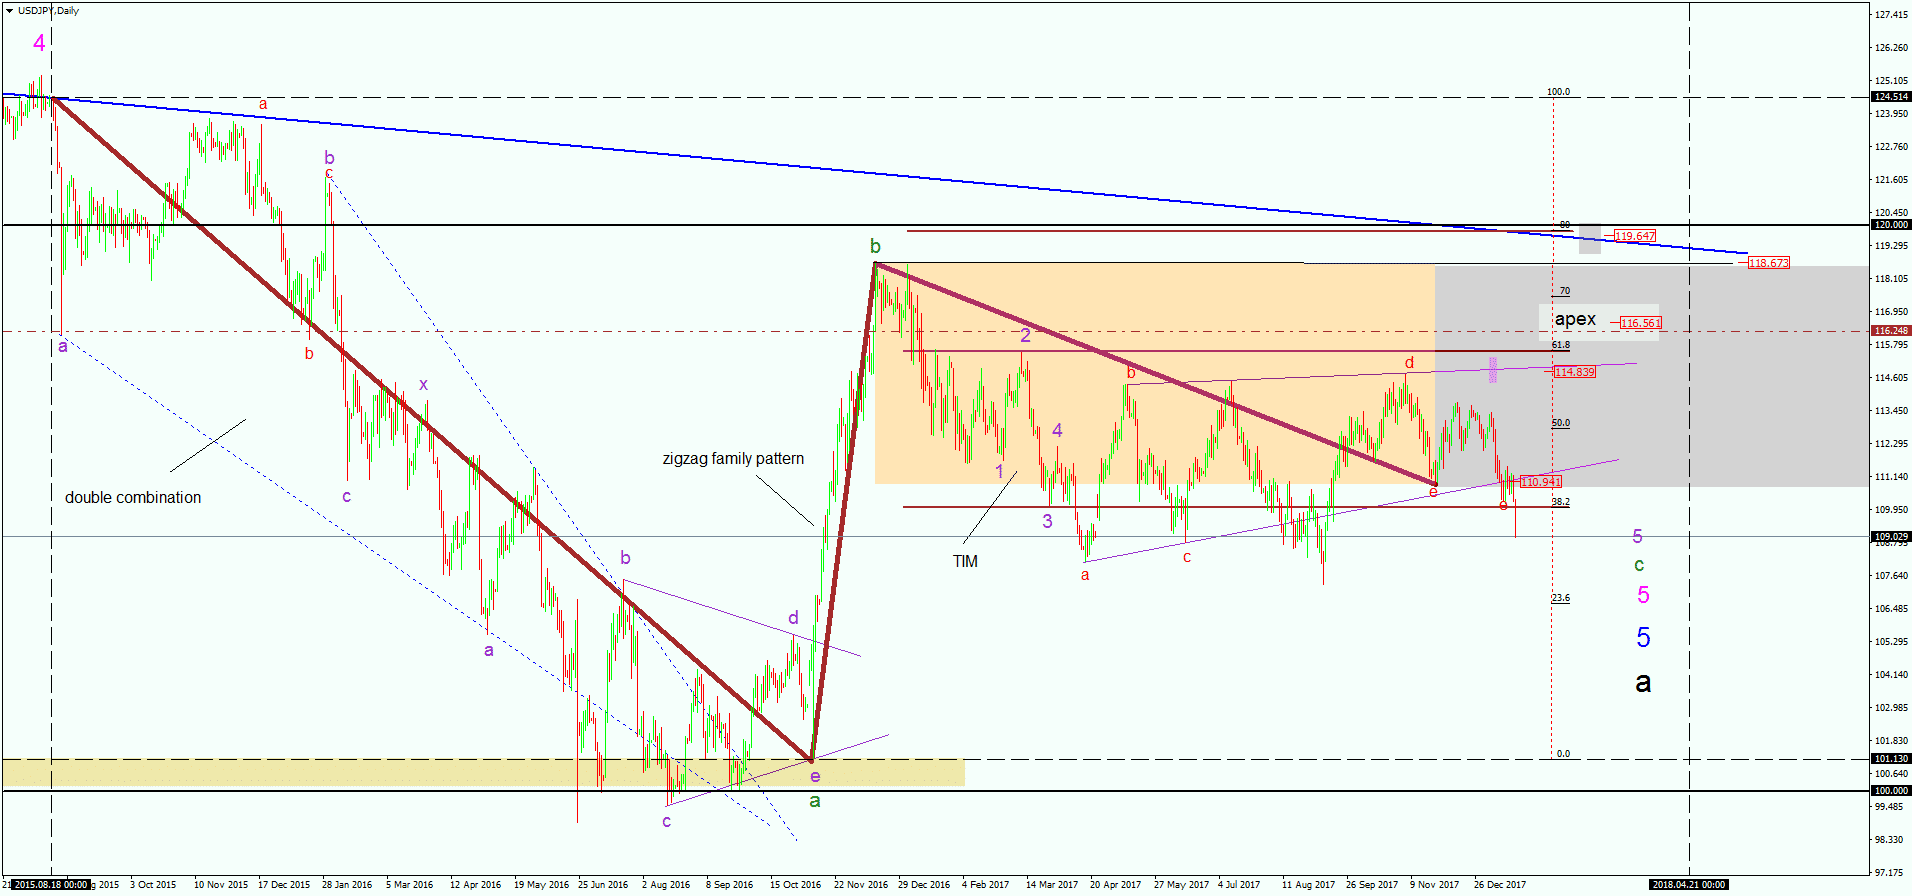
Spot something interesting? Hint: look on the top left corner.
What do you see? The count starts from where the previous analysis ended.
That’s the power of technical analysis using multiple timeframes. And, it fits the Elliott Waves Theory perfectly.
Multiple Timeframe Analysis with the Same Strategy
Earlier the Elliott Waves approach offered the full Monty. The full picture to understanding a currency pair.
However, counting waves with this approach is time-consuming. And, prone to errors.
As such, there’s no guarantee. Either you’re right, or wrong.
When right, you make pips. But, when wrong, you’ll lose steadily.
Luckily, technical analysis using multiple timeframes comes to help. Here’s a list of things that help:
- Build a strategy on a timeframe. Any timeframe you want will do the trick. Think of an indicator or two, or more, whatever. Make rules where you want to buy and sell.
- Set the money management rules that define the strategy.
If the strategy works on a timeframe it must work on all timeframes. Therefore, if it works, say, on the EURUSD hourly chart, it must work on the monthly as well.
Only that the parameters in terms of the size of the trade and everything will adapt to the new timeframe.
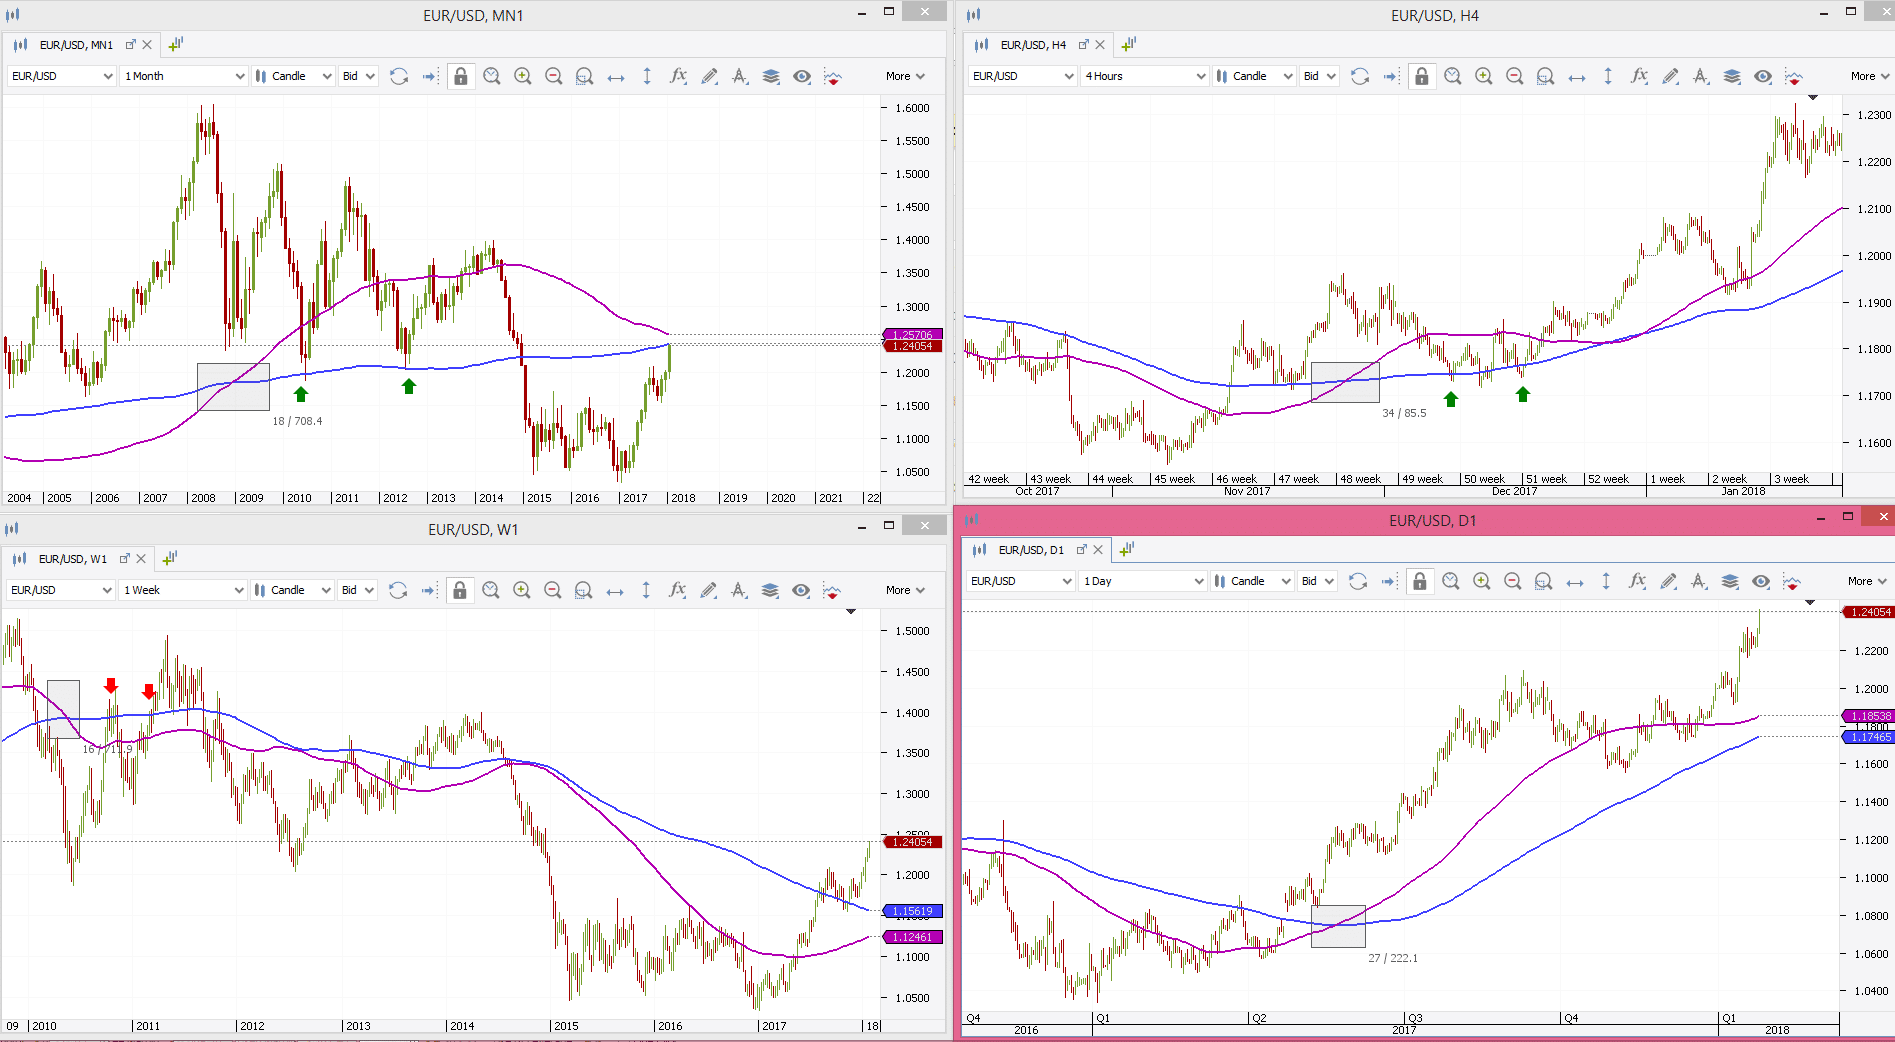
The chart above shows a possible setup for multiple timeframes trading. In this case, it shows the EURUSD on four different timeframes:
- Monthly
- Weekly
- Daily
- 4h
Moreover, it uses the same strategy:
- MA200
- MA100
- Wait for a cross, buy or sell MA200 cross for the MA100 take profit. Do this only the first two times.
That’s multiple timeframes trading at its best. However, only four timeframes appear here.
In reality, if a strategy proves profitable, apply it to al time frames. As such, you’ll:
- Scalp – in one minute, five-minute and other lower timeframes up to the hourly charts.
- Swing trade – on the hourly, four-hour and daily charts.
- Invest – on timeframes bigger than the daily one.
How About Hedging?
Using the strategy described above, your trading account will enjoy a bit of everything. And, all these, while keeping the eyes on one currency pair. More importantly, on one single strategy.
But, other trading techniques appear suitable. One of them is hedging.
Hedging means to fully or partially offset a position by opening another one in the opposite direction. Even if your broker doesn’t allow it, smart traders use multiple trading accounts. It is just a means to an end.
Hedging means keeping an open mind regarding the direction. And, all this while enjoying all the benefits of the earlier-mentioned trading styles.
Who cares if the pair spends most of the time in consolidation on the swing trades? Scalping will become more profitable.
Who cares the monthly target takes more time until reaching the desired level? The swing and scalping profits will cover for it.
Technical analysis using multiple timeframes offers the possibility to use various trading techniques on the same pair. Moving on other pairs becomes tricky, though.
One reason for that comes from the fact that not all pairs are the same. Obviously, some have a bigger daily range, others a smaller one.
As a rule of thumb, if looking for bigger moves, focus on major pairs. Forex trading on major pairs has more success when swing trading. Or, even investing.
For scalping, crosses work best. Not all of them will.
Hedging represents just another way to use various timeframes. The idea is to protect the trading account. And, to trade as much as possible on various timeframes.
But it requires a lot of time. Active trading means an active presence in front of the screens. Unfortunately, not many retail traders afford this luxury.
Conclusion
Forex trading has a bit for everyone. News-oriented traders follow the economic calendar religiously.
Technical traders follow economic news only to spot the time of a possible break. No matter the type of the trader, one thing is undeniable: technical analysis as we know it today differs much from the one two decades ago.
Or, a few years ago. Not to mention if we consider a bigger period.
Technical analysis using multiple timeframes offers the advantage of having a clear picture of a Forex pair’s direction. If it corrects on the daily, it may still be bullish on the weekly.
Or, if it corrects on the hourly, it may be bullish on the daily. And so on.
Almost all trading theories allow for multiple timeframes analysis. In fact, successful money management systems recommend such analysis before deciding if a pair is bullish or bearish.
To sum up, the biggest advantage of using such an approach is that it gives something for all time horizons. Because not all traders have the same horizon for their trades, this approach fits most of them.
As always, try not to abuse it. If you can follow a strategy on the EURUSD pair on six different timeframes, don’t fool yourself. You can’t multiply the success on all the pairs.
But, you can use automated trading for that. More about that, perhaps, in a different article.
START LEARNING FOREX TODAY!
- FOREX
- Forex Analysis
- FOREX Strategy
- Forex Technical Analysis
- FOREX trading
- Multiple Timeframes
- Technical Analysis
- Technical Analysis Using Multiple Timeframes
share This:


Leave a Reply