USD/CAD continues to consolidate, providing buying and selling opportunities in the short and medium-term. While the price has corrected down quite substantially and the support area is being rejected, we can expect yet another move to the upside.
Disclaimer: The analysis presented in this article is for educational purposes only and should not be considered as financial advice.
This analysis was done on MetaTrader 4.
Click below to open a Free Demo Account with our trusted brokers:
Trade Idea Details:
USD/CAD symbol
Type: Bullish
Key support levels: 1.3850
Key resistance levels:1.4112
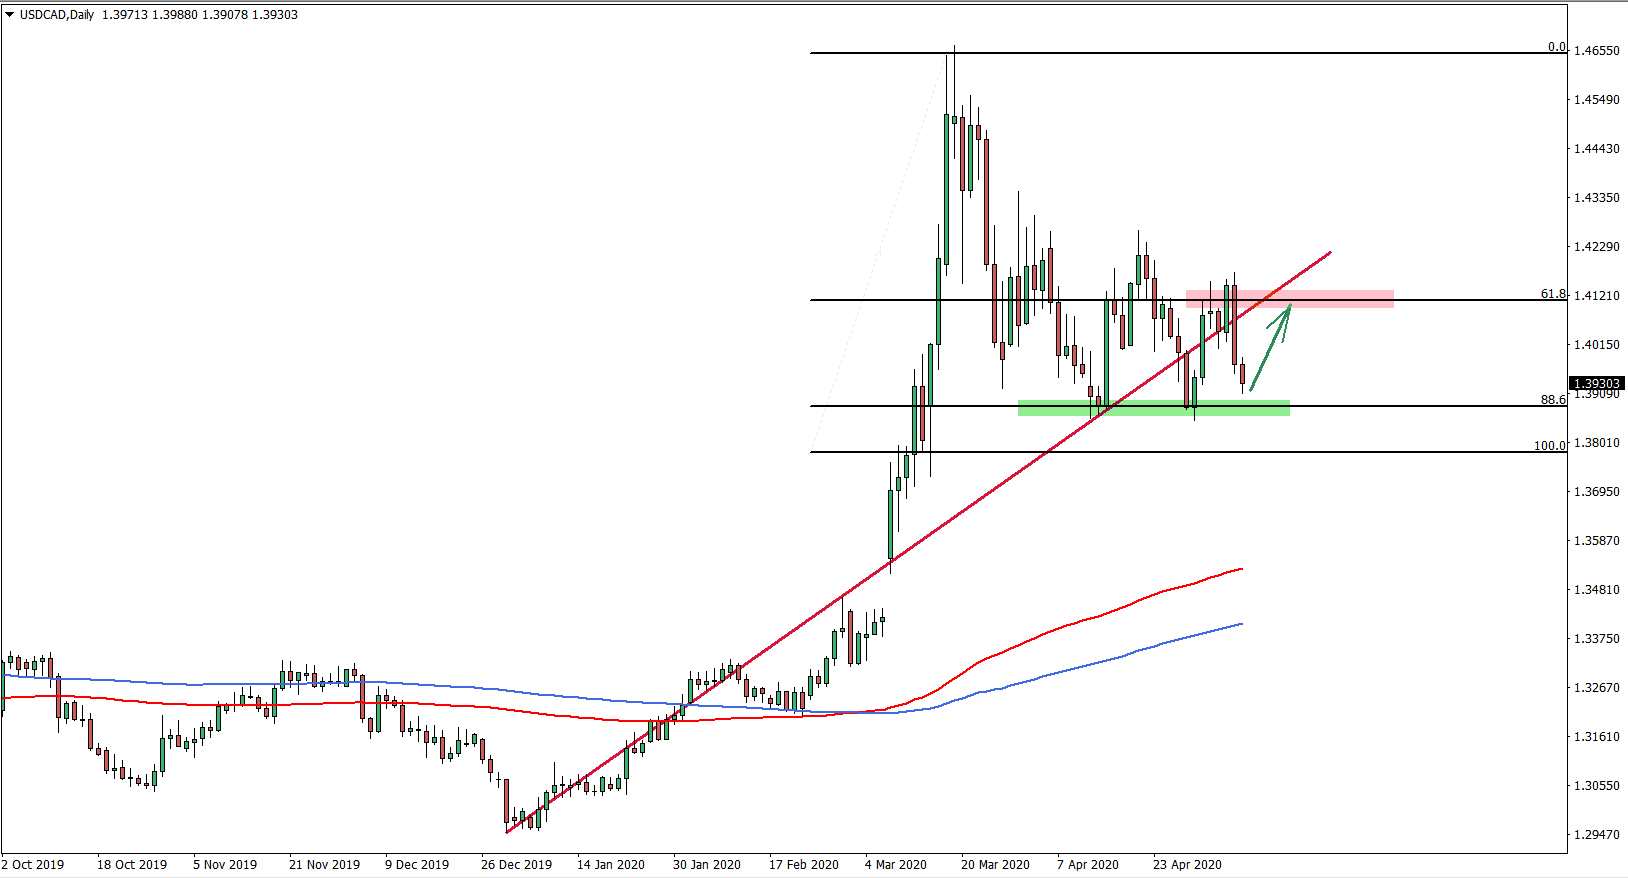
Price Action: USD/CAD continues to consolidate, and currently it is right of the bottom of the range. On the Daily chart, we can clearly spot the support, formed around 88.6% Fibonacci retracement level applied to the last wave up. This is the 1.3880 price, which has been rejecting for two consecutive times, thus producing a double bottom. It looks like USD/CAD is struggling to establish any sort of direction in the medium term, which is likely to result in a continuation of the range trading. The nearest resistance is seen at 61.8% Fibs, which is 1.4112 level, and this is the potential upside target in the coming days.
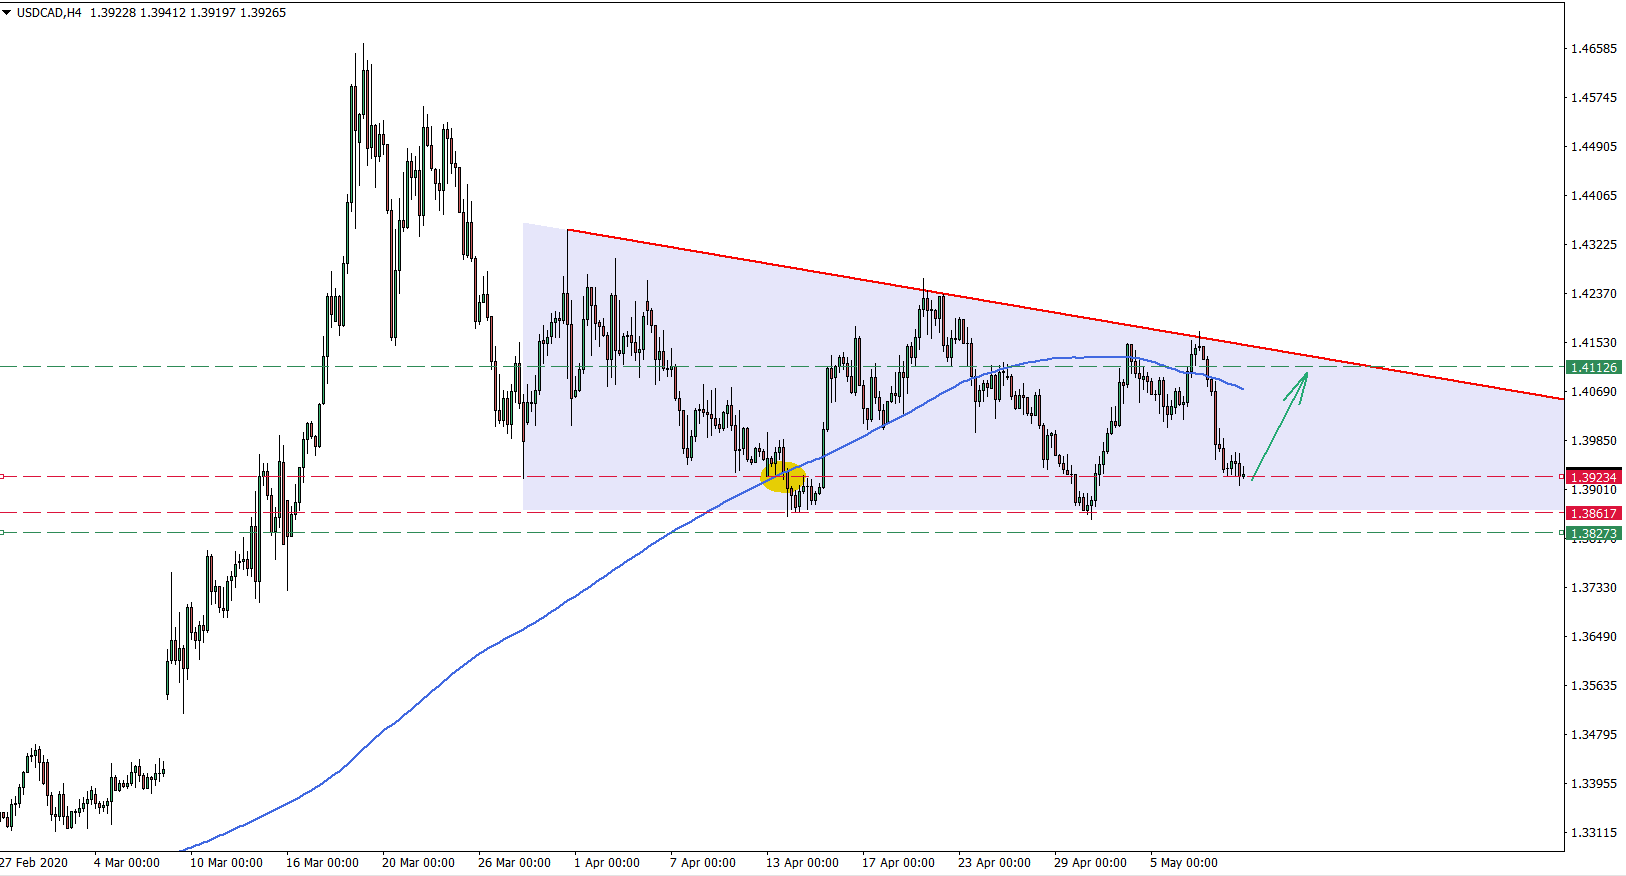
The 4-hour chart below shows that USD/CAD has formed a triangle pattern, without any breakout. Therefore, price is likely to stay within the triangle, thus, the upside move has a higher probability in relation to the downtrend. Currently, USD/CAD has reached the point of the 200 SMA breakout, which is acting as the support. This area should be quite interesting for the short and medium-term speculators and it provides a good risk/reward ratio for buyers. As long as the 1.3860 support area holds, price should be expected to move towards the upper range of the triangle, which corresponds to the 1.4112 upside target as per the Daily chart.
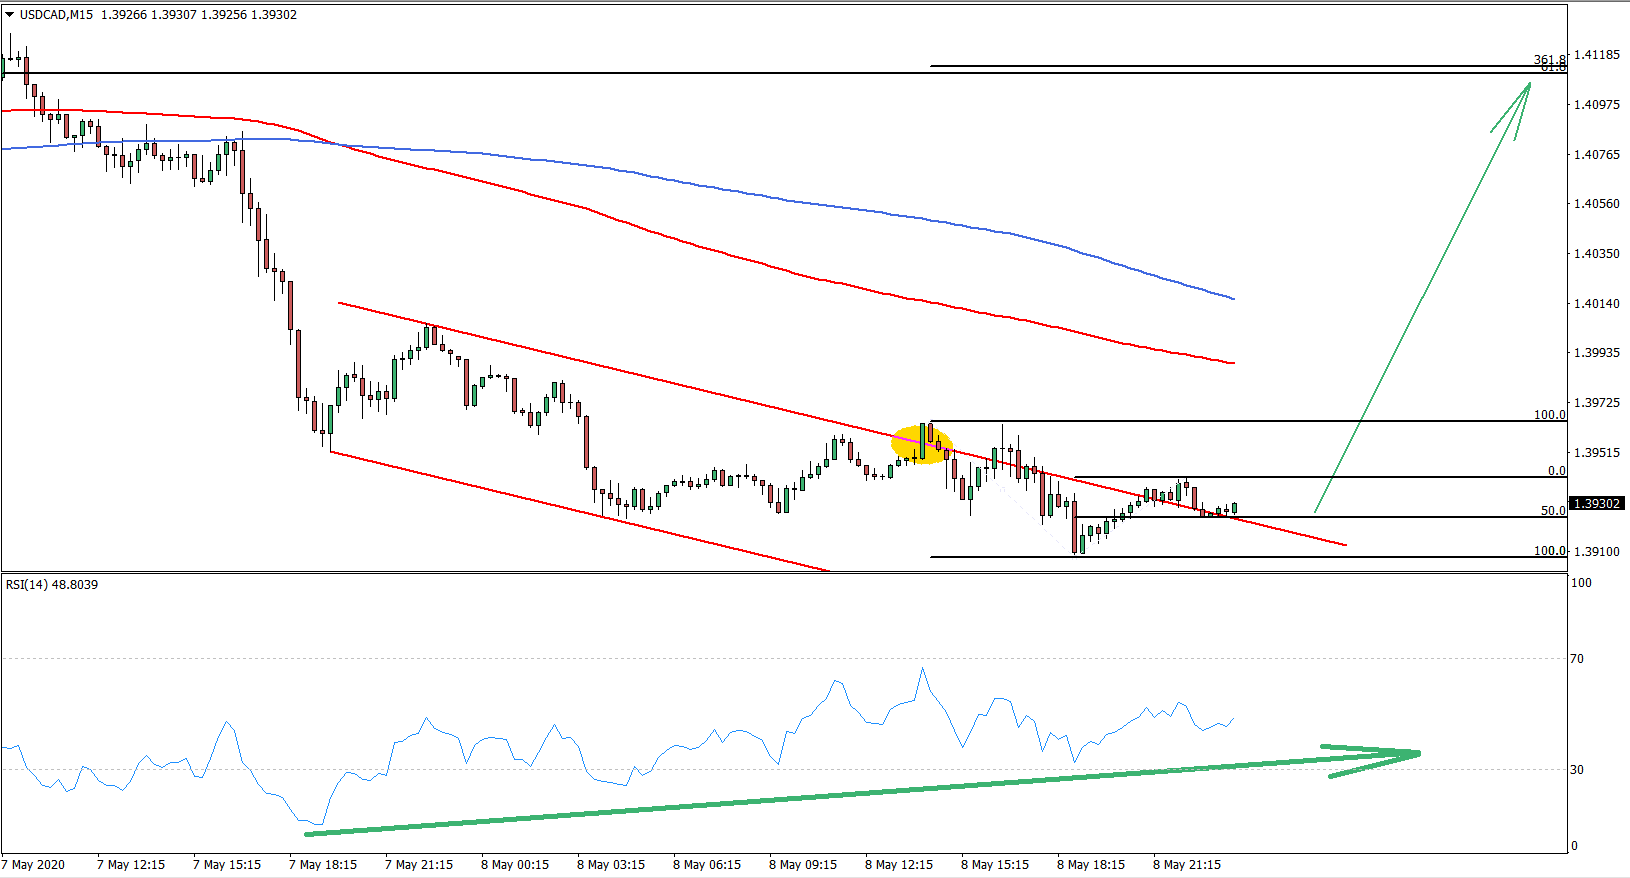
Finally, the 15-minute chart shows that USD/CAD broke above the descending channel, while the RSI oscillator was and still is forming a bullish divergence. The most recent pullback resulted in the rejection of the 50% Fibonacci retracement level, which could be the starting point of the upside move. As we have mentioned, the upside target is seen at 1.4112, which also corresponds to the 361.8% Fibs, applied to the downside move after the breakout of the descending channel.
Potential Trade Idea: The buying opportunity is presented while the price is between 1.3900 -1.3940. Going long within this price range should provide a 2:1 risk-reward ratio. The hard stop loss could be placed at 1.3827, while the Take Profit could be near the 1.4112 level.


Leave a Reply