The long-term trend for Gold remains extremely bullish especially considering a strong ongoing devaluation of the US Dollar…
Analysis Details:
XAU/USD symbol on the MT4 platform
Type: Bullish
Key support levels: 1875, 1848
Key resistance levels: 1900, 1968
The 200 Simple Moving Average has been rejected back on August 12, when the price tested 1863 low. Since then there was no daily break and close below this level, suggesting the validity of the uptrend.
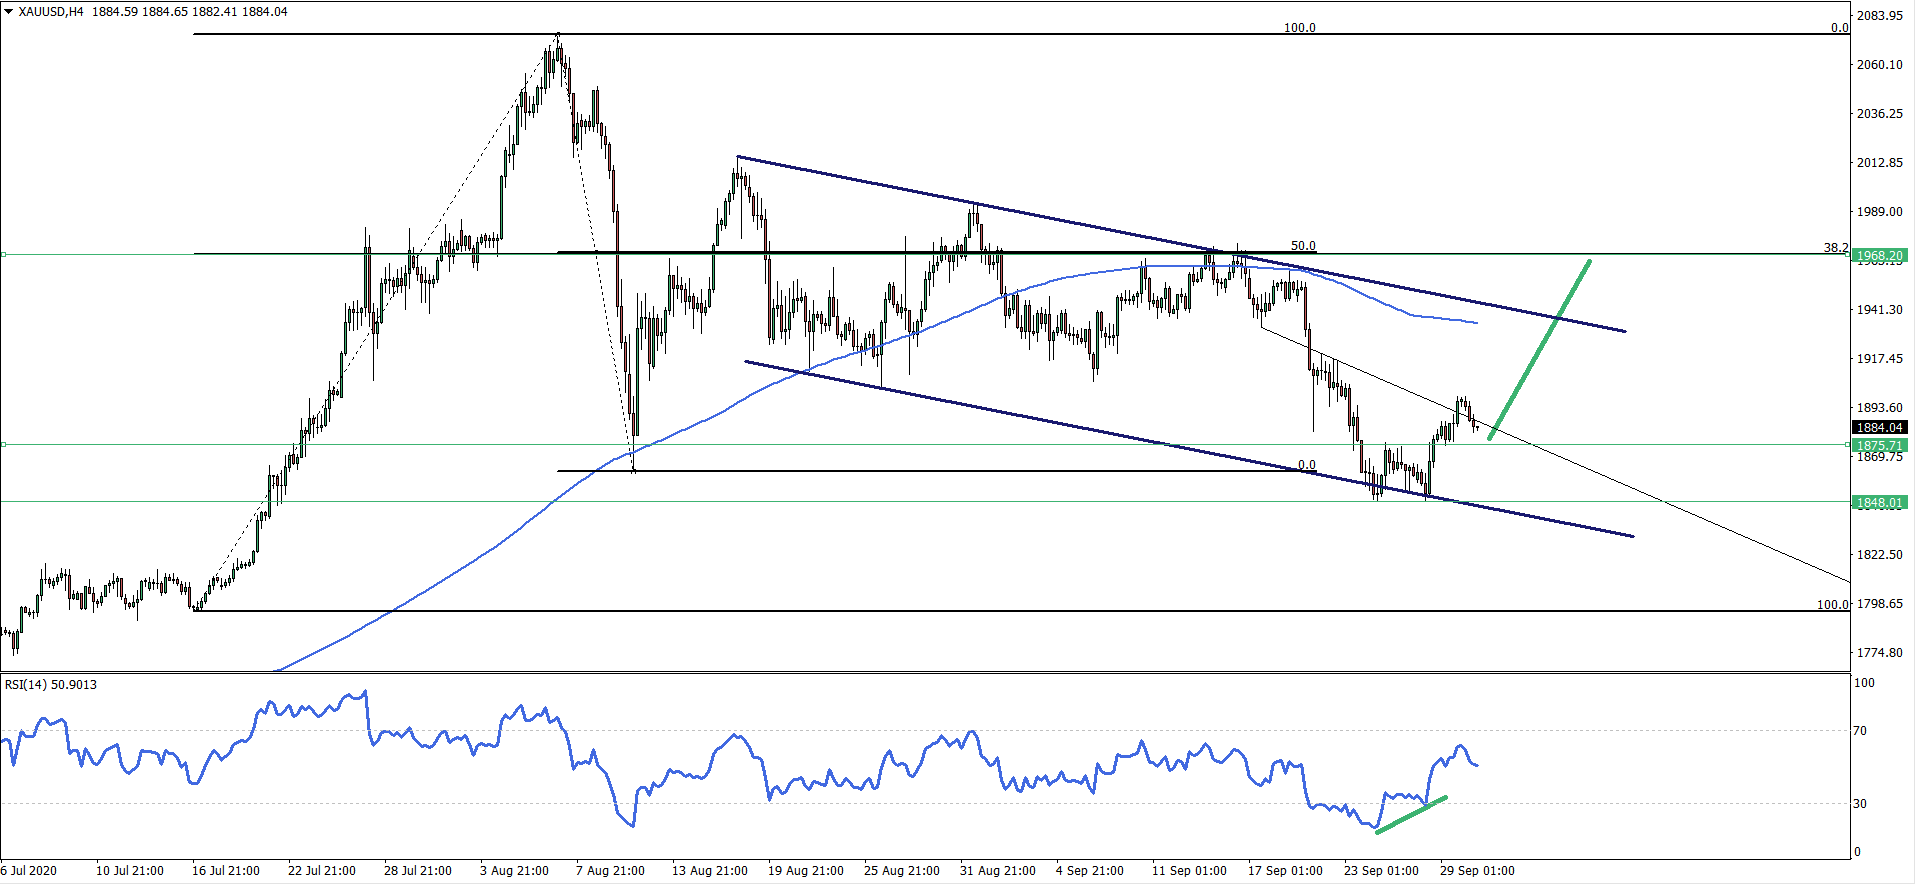
The most recent price action shows that Gold has reached and rejected to bottom of the descending channel. At the same time price has formed a double bottom while RSI has shown a bullish divergence. Considering the most recent break and close above the average-price downtrend trendline, bulls are starting to step in, perhaps in the long run.
Nonetheless, the nearest resistance is located not that far away, at 1968. It is confirmed by two Fibonacci retracement levels, 38.2%, and 50% Fibs as per the chart below. Only when/if this resistance will be penetrated, with a daily break and close above, the long-term uptrend could be confirmed and XAU/USD price might be aiming for a new all-time high.
Disclaimer: The analysis presented in this article is for educational purposes only and should not be considered as financial advice.
This analysis was done on MetaTrader 4.
Click below to open a Free Demo Account with AxiTrader
To get exclusive Trading Signals, join our Premium Channel just for $39 per month


Leave a Reply