On the Daily chart we can witness a strong uptrend which is still valid. This is because price continues to print higher highs and higher lows while remains above the 200 Simple and Exponential Moving Average.
Disclaimer: The analysis presented in this article is for educational purposes only and should not be considered as financial advice.
This analysis was done on MetaTrader 4.
Click below to open a Free Demo Account with our trusted brokers:
Analysis Details:
XAU/USD symbol on the MT4 platform
Type: Bearish
Key support levels: 1920.50
Key resistance levels: 1980.00
Price Action:
The average-price uptrend trendline is being respected, although Gold could be correcting down to test the support trendline once again. As long as the daily closing price remains below 23.6% Fibonacci resistance at 1980.00, XAU/USD should remain under short term selling pressure. The key support at 1920.50 is confirmed by 38.2% and 61.8% Fibs as per the cart below and this is the potential downside target. It also corresponds to the 200 EMA and SMA, making it an extremely strong demand zone.
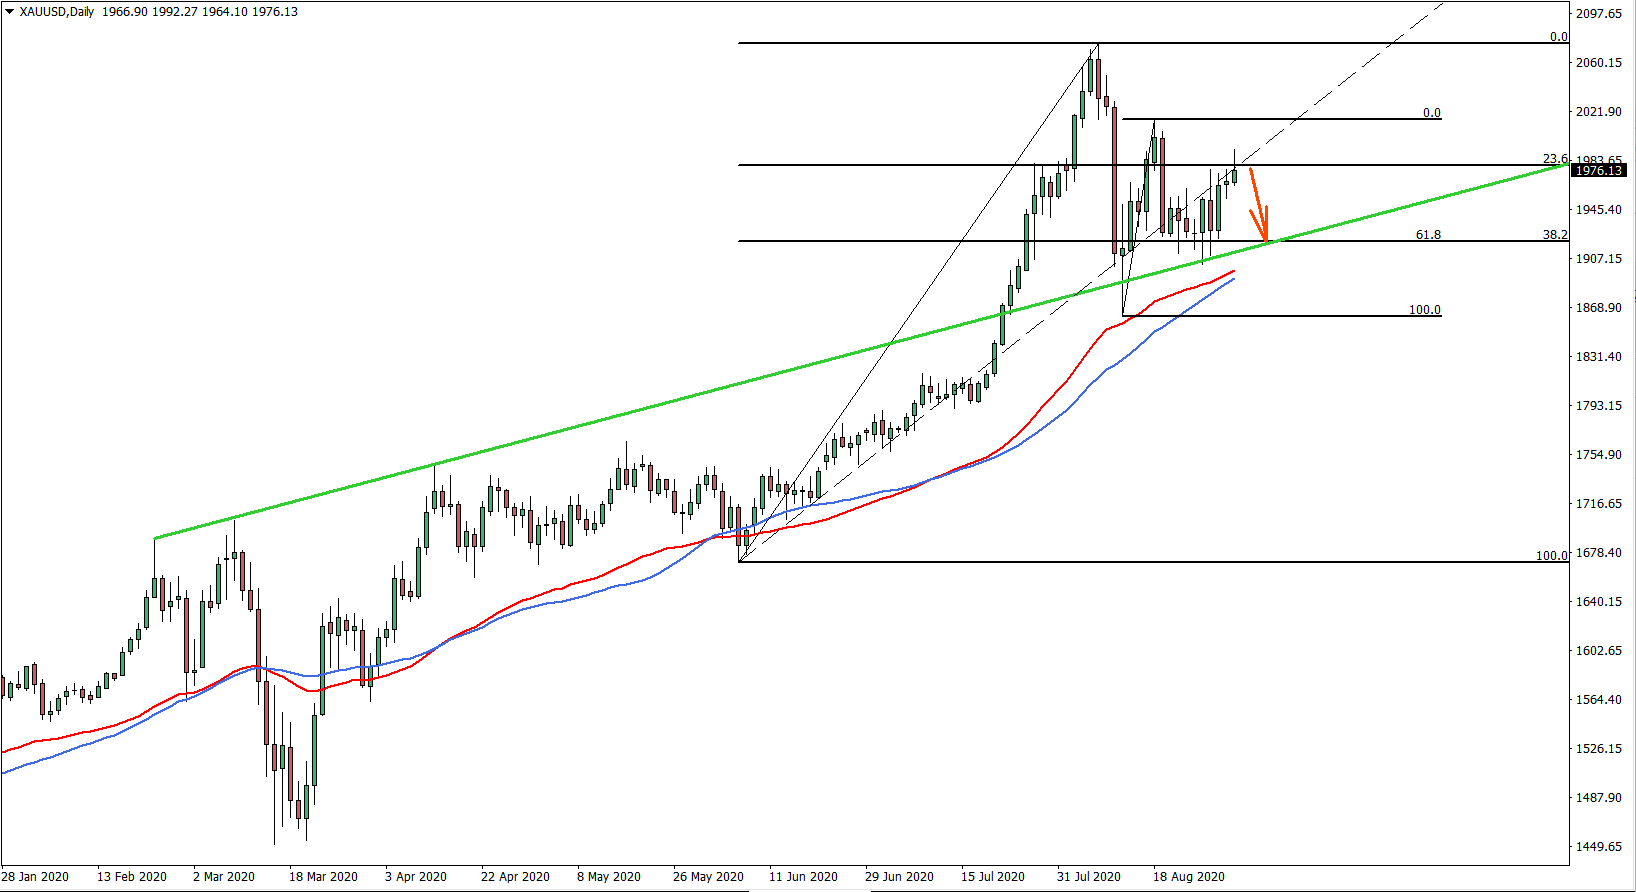
Therefore, in the short to medium term, price of Gold could be heading south, meaning that the consolidation phase can be extended further, before/if the price will continue trending up. On the other hand, a daily break and close above current resistance is likely to confirm strong buying pressure, which should result in the long-term uptrend continuation.
To get exclusive Trading Signals, join our Premium Channel just for $29 per month


Leave a Reply