For long, moving averages define the direction of a market. Any technical Forex analysis course starts with an exponential moving average. Or, any type of other moving averages that exist.
Traders use moving averages to predict price direction. However, for many, they lag too much.
It means that moving averages define a bull or a bear market. But, that’s pretty much all they do.
This article aims to see if this may or may not be the case. Moreover, we’ll look at:
- Different moving averages and how they compare with the exponential moving average
- Forex analysis from a moving average forecasting point of view
- What is the exponential moving average formula?
- Various technical analysis setups to find a moving average forecast
The idea is to show how useful moving averages are. On top of it, to prove, once again, that simple things work best.
In technical analysis, like in any Forex analysis, a simple approach pays the best results. Not only it allows traders to be profitable. But, keeps the trading account light, by avoiding overtrading.
As usual, we’ll make use of plenty of examples to prove our cause. Things like:
- The perfect order
- Multiple timeframe analysis
- Golden and death crosses, etc., will speak for themselves of the power moving averages bring to technical analysis.
Because moving averages consider past prices, a certain lag appears. That’s only normal.
However, they help to filter the noise in a trading day. Or, a week.
Daily, economic news, and snippets from the entire world influence the price action. How do you know what the right course is?
How about having some help on your side? Moving averages are there to keep you on the right side of the market.
Moving Averages – The Cornerstone of Any Forex Analysis
A moving average appears on any trading platform. Starting with the default settings, at least one type of it seems.
There’s a reason for that. Because the moving average formula is simple to apply, there’s not much of a technical setup to it.
Think of it in terms of candles. Or, periods.
As the candlesticks chart is the most popular nowadays, candles appeal more to traders. Moving averages consider a number of candles before plotting a value.
The rule of thumb goes like this:
- The bigger the number of periods, the further from the price the average will be.
Moreover, in terms of support and resistance provided, the same logic applies. Therefore, stronger support or resistance comes with a higher moving average.
Multiple types of moving averages (MA) exist:
- Simple Moving Average (SMA)
- Exponential Moving Average (EMA)
- Displaced Moving Average (DMA)
And, the list can go on. An SMA compounds the average price of a currency pair over some candles.
Of course, candles represent the period considered. Again, the bigger, the more powerful the implications.
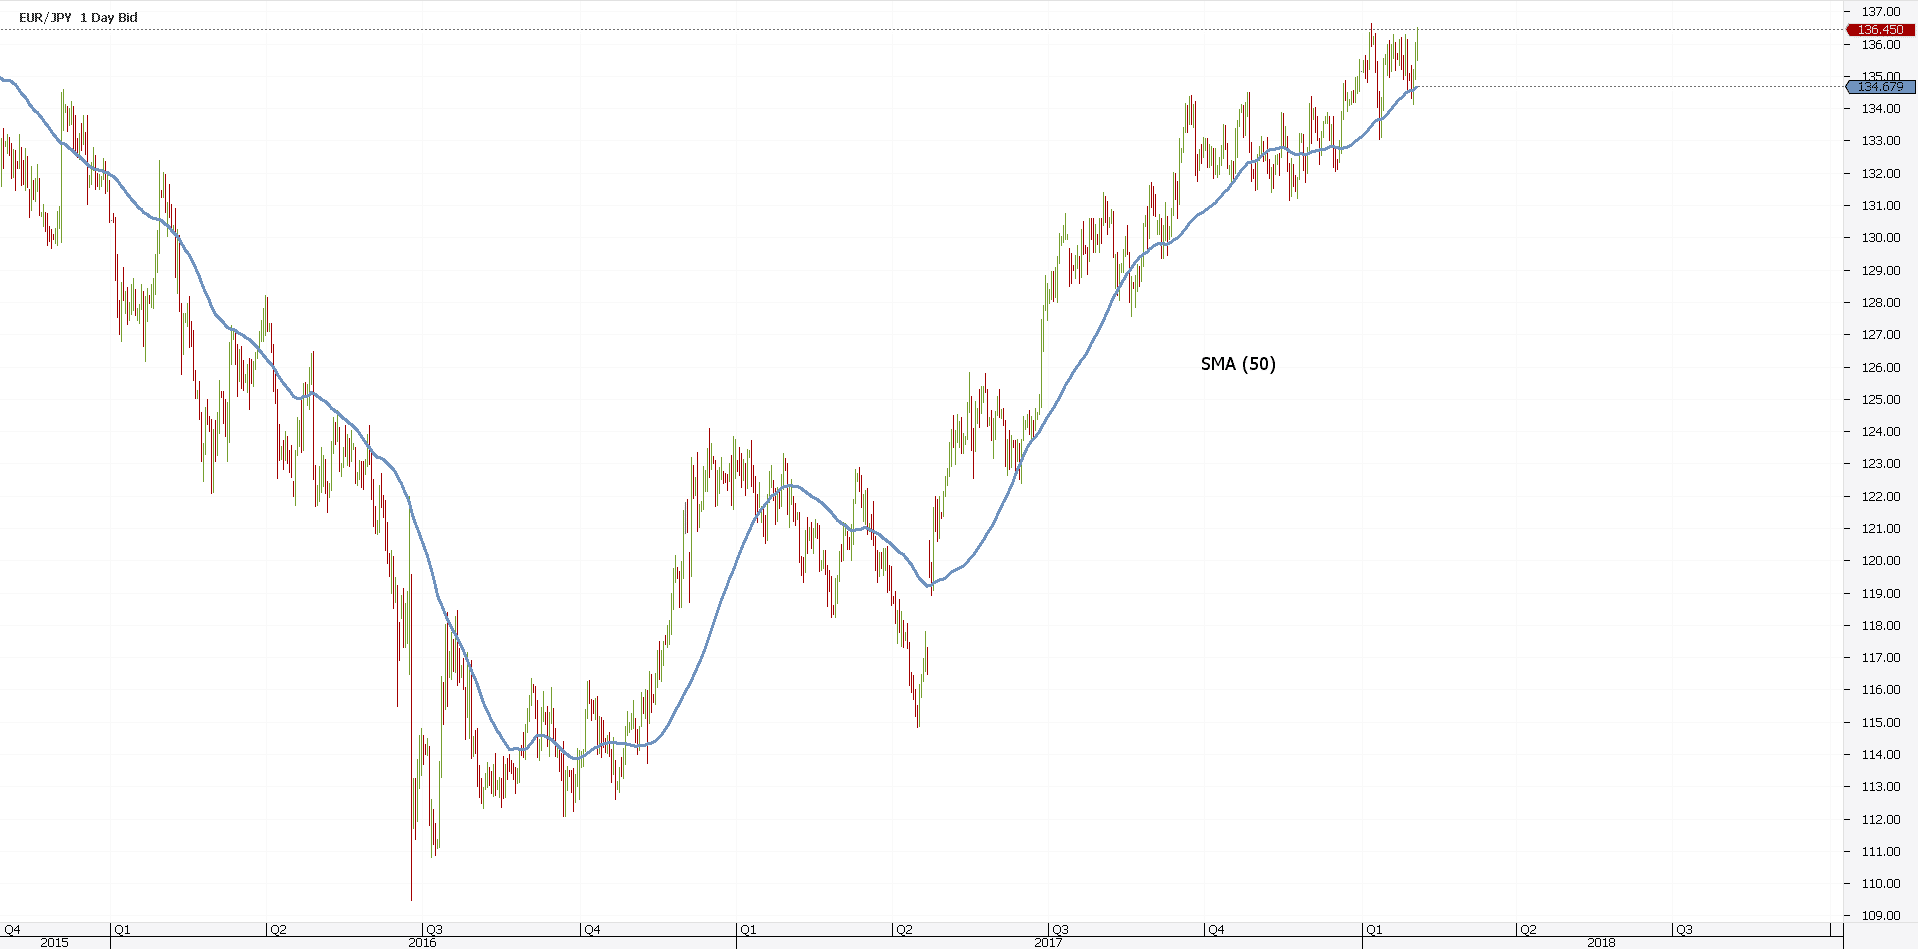
Above you see the EURJPY daily chart. Anyone notices a bullish trend.
But, how about riding the trend? That’s the aim after all, isn’t it?
Moving averages define the trend. Because of that, traders have a clear visualization of the underlying move.
In the example above, the SMA(50) defines the bullish trend. Price finds support every time it tested it for the last year. How about that for a trend?
But the SMA represents the simplest thing to averaging prices. It’s nothing but an average that moves.
However, there’s more to Forex analysis using moving averages. And, the exponential moving average is here to prove it.
Introducing the Exponential Moving Average
An Exponential Moving Average or an EMA, comes closer to perfection. That is, of course, when compared with a classic MA.
Not only it applies more weight to current prices. But, it reduces the lag too.
Because of that, major improvements take place in any Forex analysis that uses MA’s.
Let’s compare an EMA with the same period (50), placed on the same chart (EURJPY).
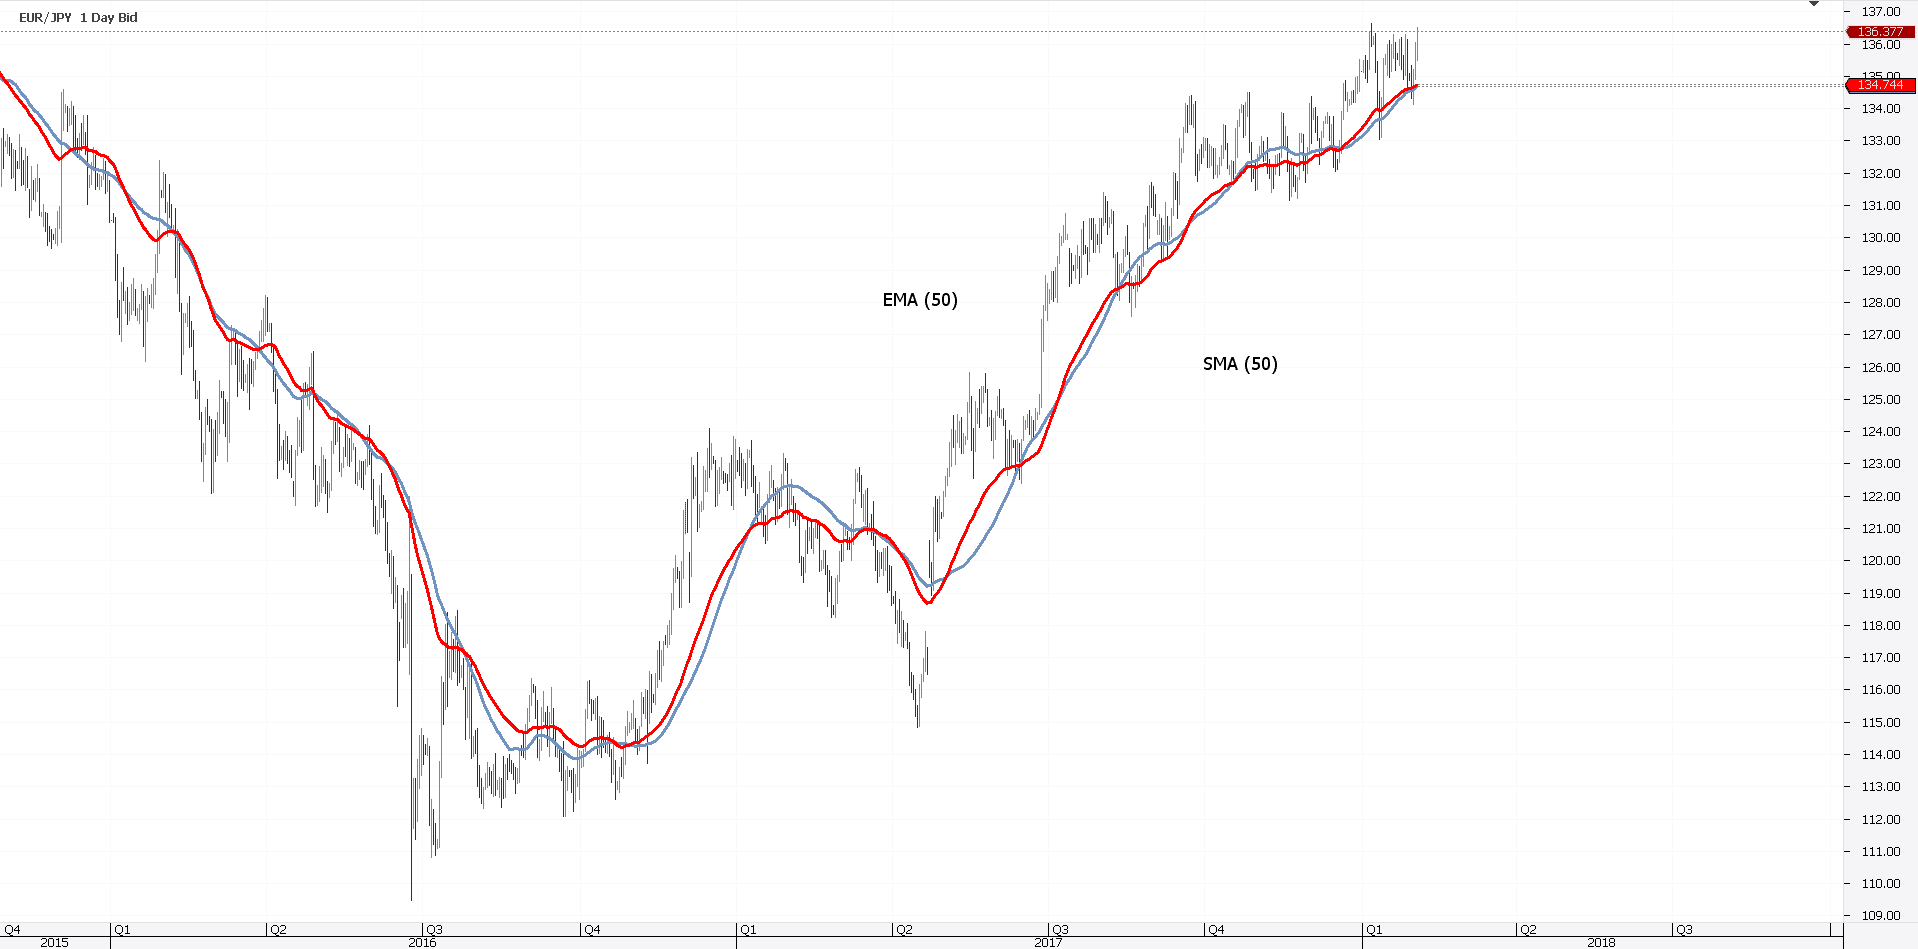
The red line above represents the EMA(50). So, there are two moving averages:
- Considering the same period (50)
- Applied on the same time frame (EURJPY daily)
However, they show two different things. But, a closer look reveals something extraordinary: ranges and trends have different outcomes.
As such, we can make the following rule:
- When the price ranges, the two averages show similar conditions.
- When a new trend starts, the EMA acts faster. Or, quicker.
Therefore, the eyes should be on the EMA and not the SMA. Their simple crossing represents, in many cases, a buy or sell signal.
Bullish trend? Simply buy bullish crosses. Just like the chart below shows:
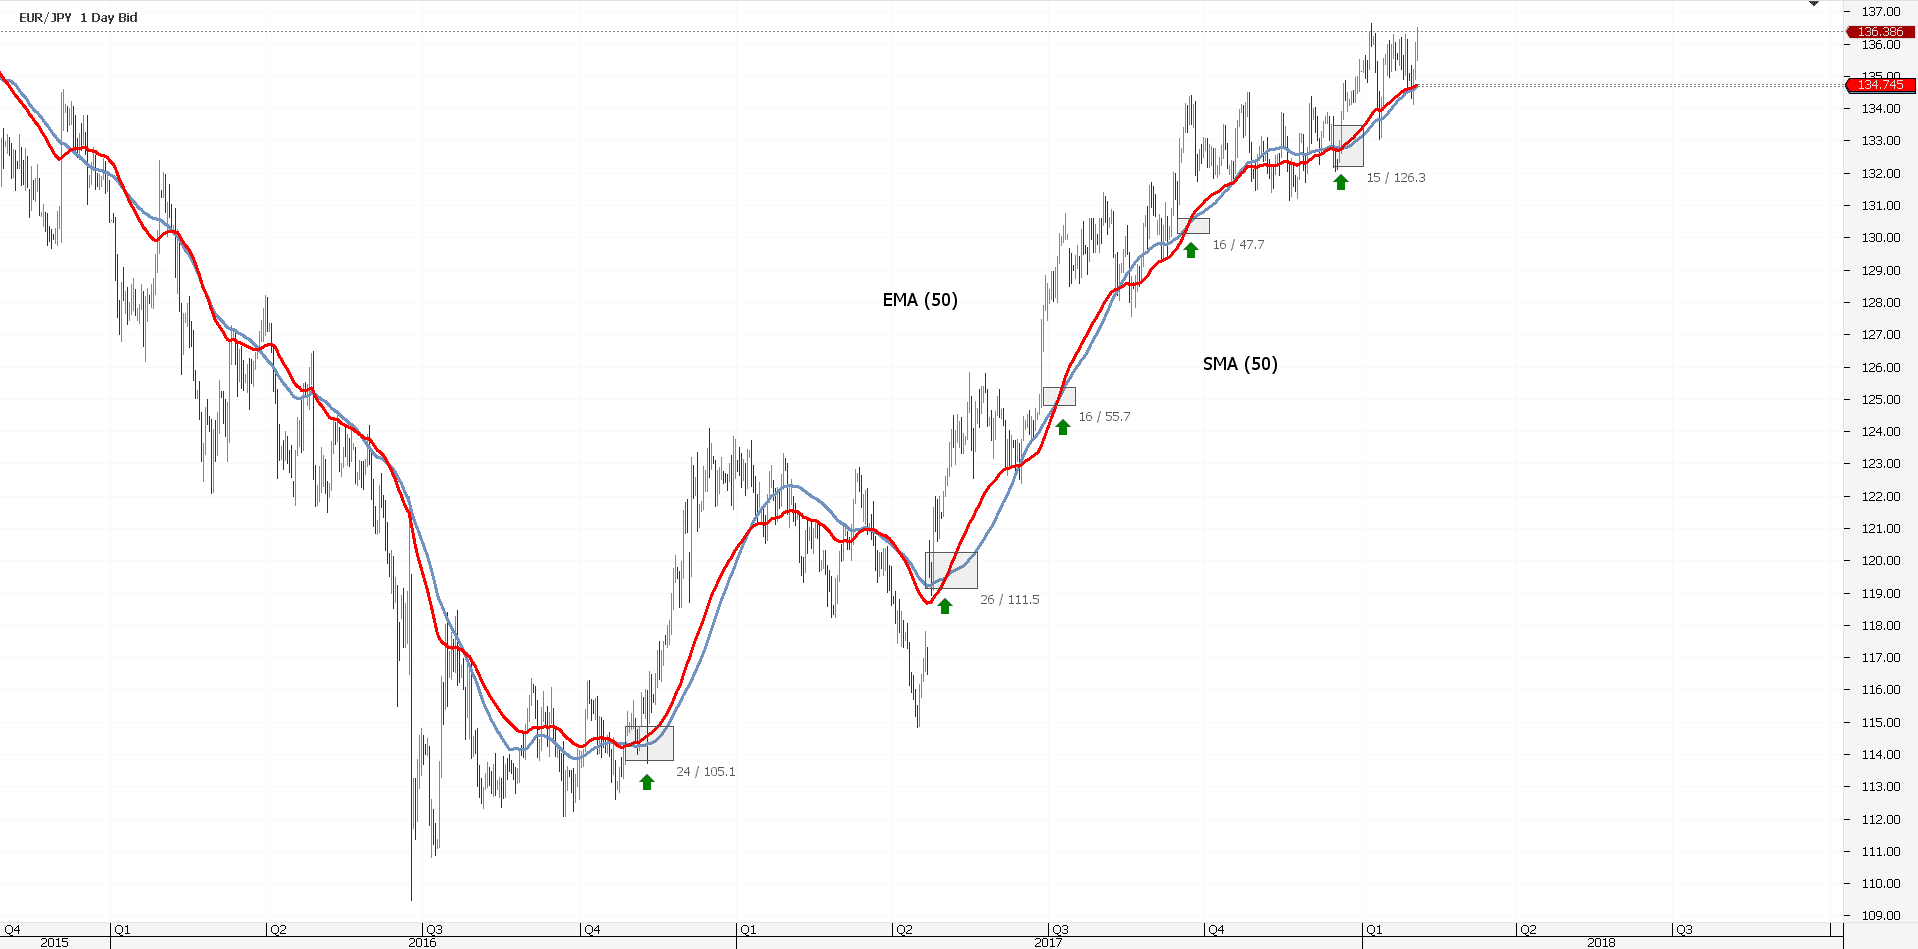
Money management plays an important role here. As you can see, the lagging factor appears clearly in this setup.
Signals lag. But, the direction is correct, and that’s all that matters.
Calculating the Exponential Moving Average
When calculating moving average values, the period matters the most. An EMA12, for example, considers 12 periods.
Be it hours, minutes, days, months…it doesn’t matter. Different timeframes come with different interpretations.
The starting point on how to calculate moving average prices is the SMA. Yes, the simple moving average comes to help.
As mentioned earlier, the SMA averages the prices of the last periods. The SMA(10), for example, averages the closing prices for the last 10 periods.
With every new period, the average drops the oldest one. Because of that, the current SMA value plotted on the chart represents the updated one.
For the EMA, to calculate moving average prices differs. First, you need the SMA for the same period.
Assuming you want to calculate the EMA(20) value. For whatever the reason, it plays a vital role in your Forex analysis.
Merely add the last 20 periods closing prices. Next, divide them by 20. As such, you found the SMA(20).
Second, you need a multiplier. It comes handy when calculating the exponential moving average.
The multiplier gives the exponentially weighted moving average price. It’s much simpler than it sounds.
Here’s its formula: (2/time periods + 1). Using our example: (2/50+1) = 0.0392. Or, 3.92%.
Finally, the exponential moving average calculation goes by the following formula:
[close – EMA (previous day)] * multiplier + EMA (previous day).
Luckily, personal computers exist today. Because of that, trading platforms automatically calculate the EMA and project the value on any chart.
How to Use the EMA
Now that we explained the moving average calculator’s conditions for the EMA let’s explore the using of it.
In any Forex analysis, the strategy represents the starting point. Here are some of the most popular ways for using the exponential moving average in Forex trading.
Perfect Order Trading with Multiple EMA’s
The perfect order concept consists of using various moving averages. Or, to plot averages showing different periods.
In our case, the perfect order system uses EMA(20), (50), (100) and (200). Just like in the example below:
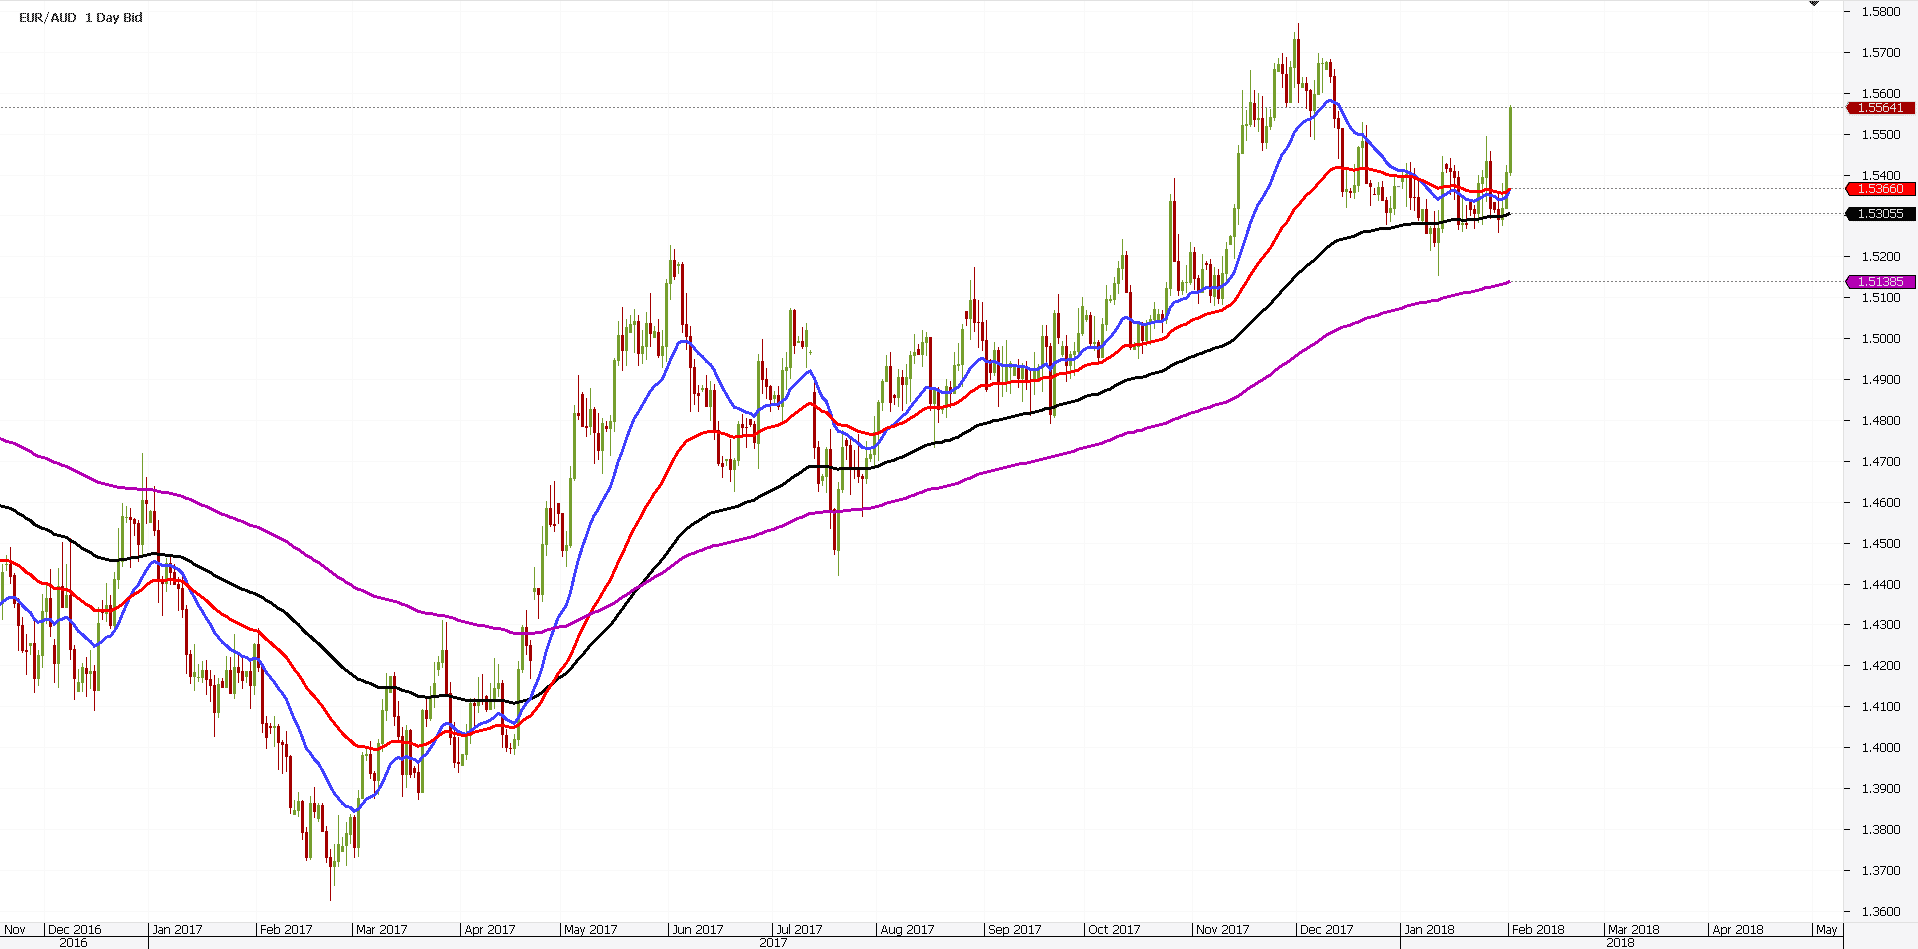
Again, the longer the period considered, the further from the price the EMA will be. The chart above shows the four EMA’s mentioned earlier. However, the perfect order system refers to the period when the EMA’s align correctly.
Effectively, it means EMA(20) above EMA(50). And, EMA(50) appears above EMA(100). Below all, EMA(200) appears.
On a chart/timeframe, multiple perfect order situations may form. The EURAUD daily chart below shows the perfect example.
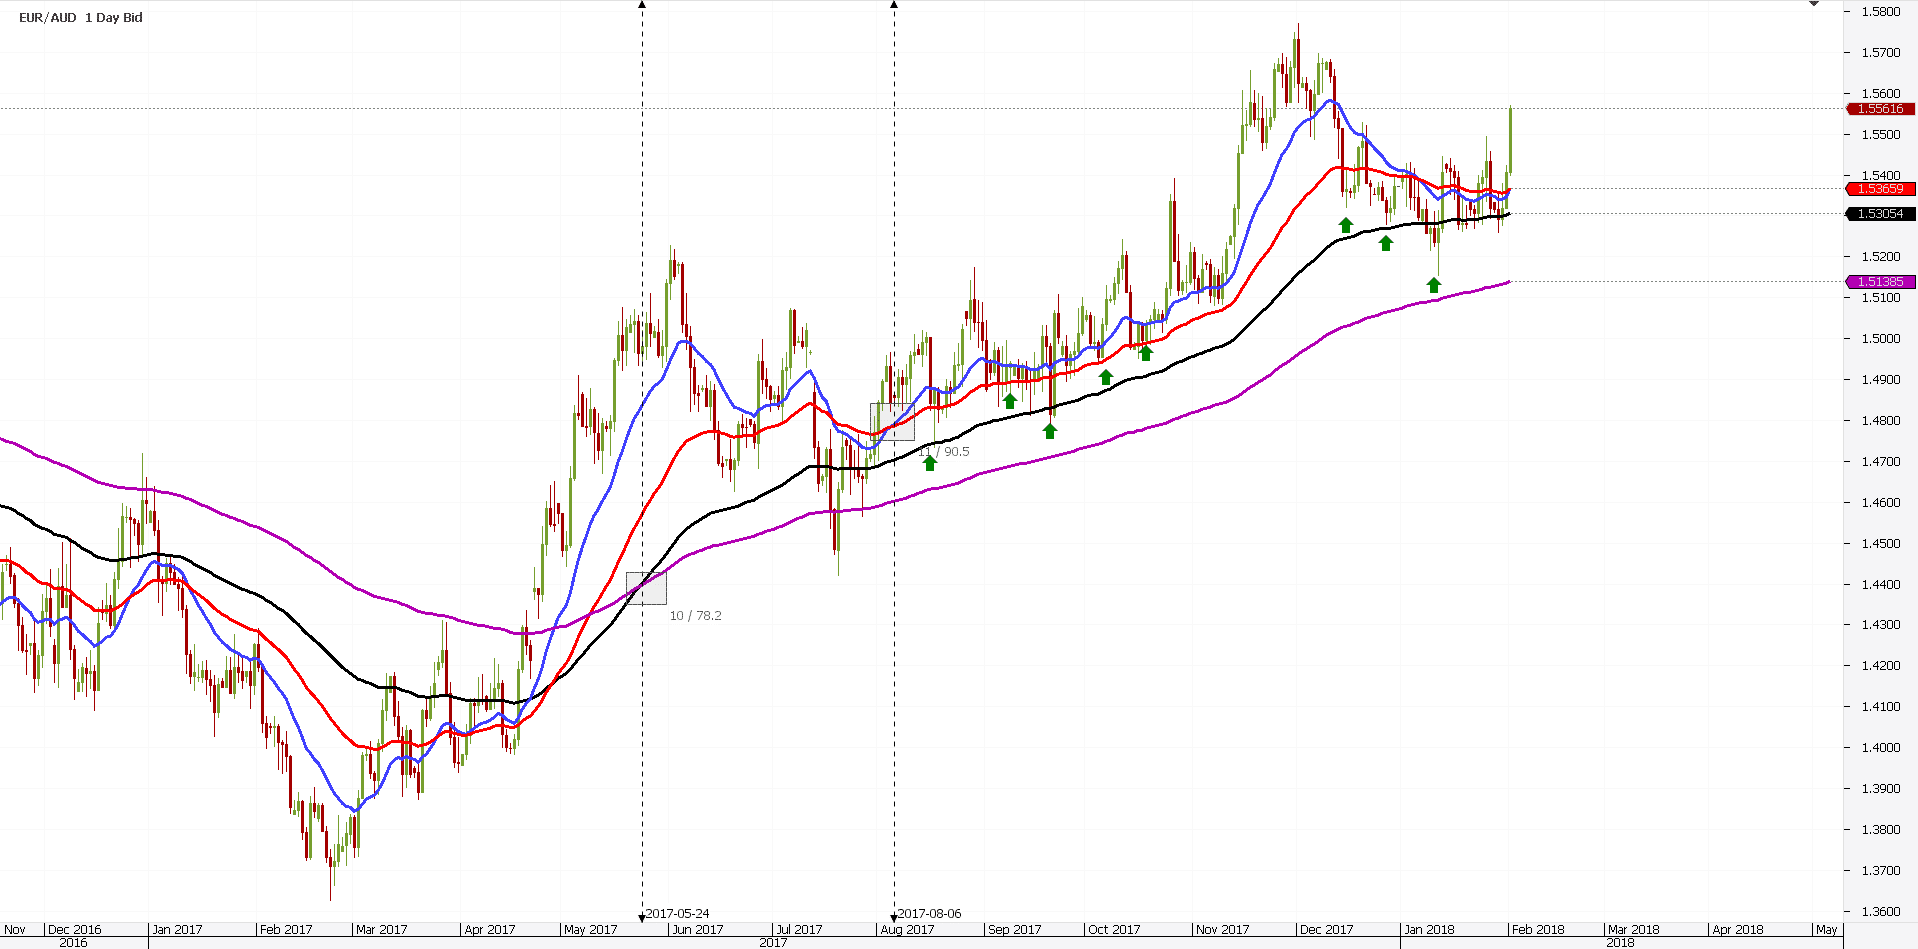
From left to right, the price breaks higher. How do we know that?
First, we look at the previous lower highs series. Second, we wait for the current price to break it. Finally, we wait for the EMA(20), or the blue line, to break above all the other EMA’s.
That’s all we need.
Moving forward, the perfect order forms in strong trends. But, the moment it appears on a chart is not always the ideal one to enter a trade.
Instead, traders wait for pullbacks. Remember what we said earlier?
The longer the period considered, the stronger the support or resistance area is. In the case of the EURAUD example, we consider them support. The new trend is bullish.
In other words, traders:
- Wait for the perfect order to form.
- Buy pullback into EMA(50) and (100)
- Have a stop loss at EMA(200)
- Target 1:2 or 1:2.5 risk-reward ratios.
That’s the strategy. And the earlier chart explains it.
Bollinger Bands Strategy with a Moving Average
Few traders know the famous Bollinger Bands indicator uses a moving average. However, most traders used at least once the Bands in their Forex analysis.
Remember what Bollinger Bands has in its componence? If not, here’s some help:
- Upper Bollinger Band (UBB)
- Middle Bollinger Band (MBB)
- Lower Bollinger Band (LBB).
While all the focus and the fuzz stay with the UBB and LBB, the MBB deserves more attention. Why?
That’s the moving average used in the indicator. Some trading platforms don’t even display the MBB. Most of them show the SMA as MBB.
However, the most performant ones allow traders to choose the average to use. And, the exponential moving average is the perfect one for this purpose.
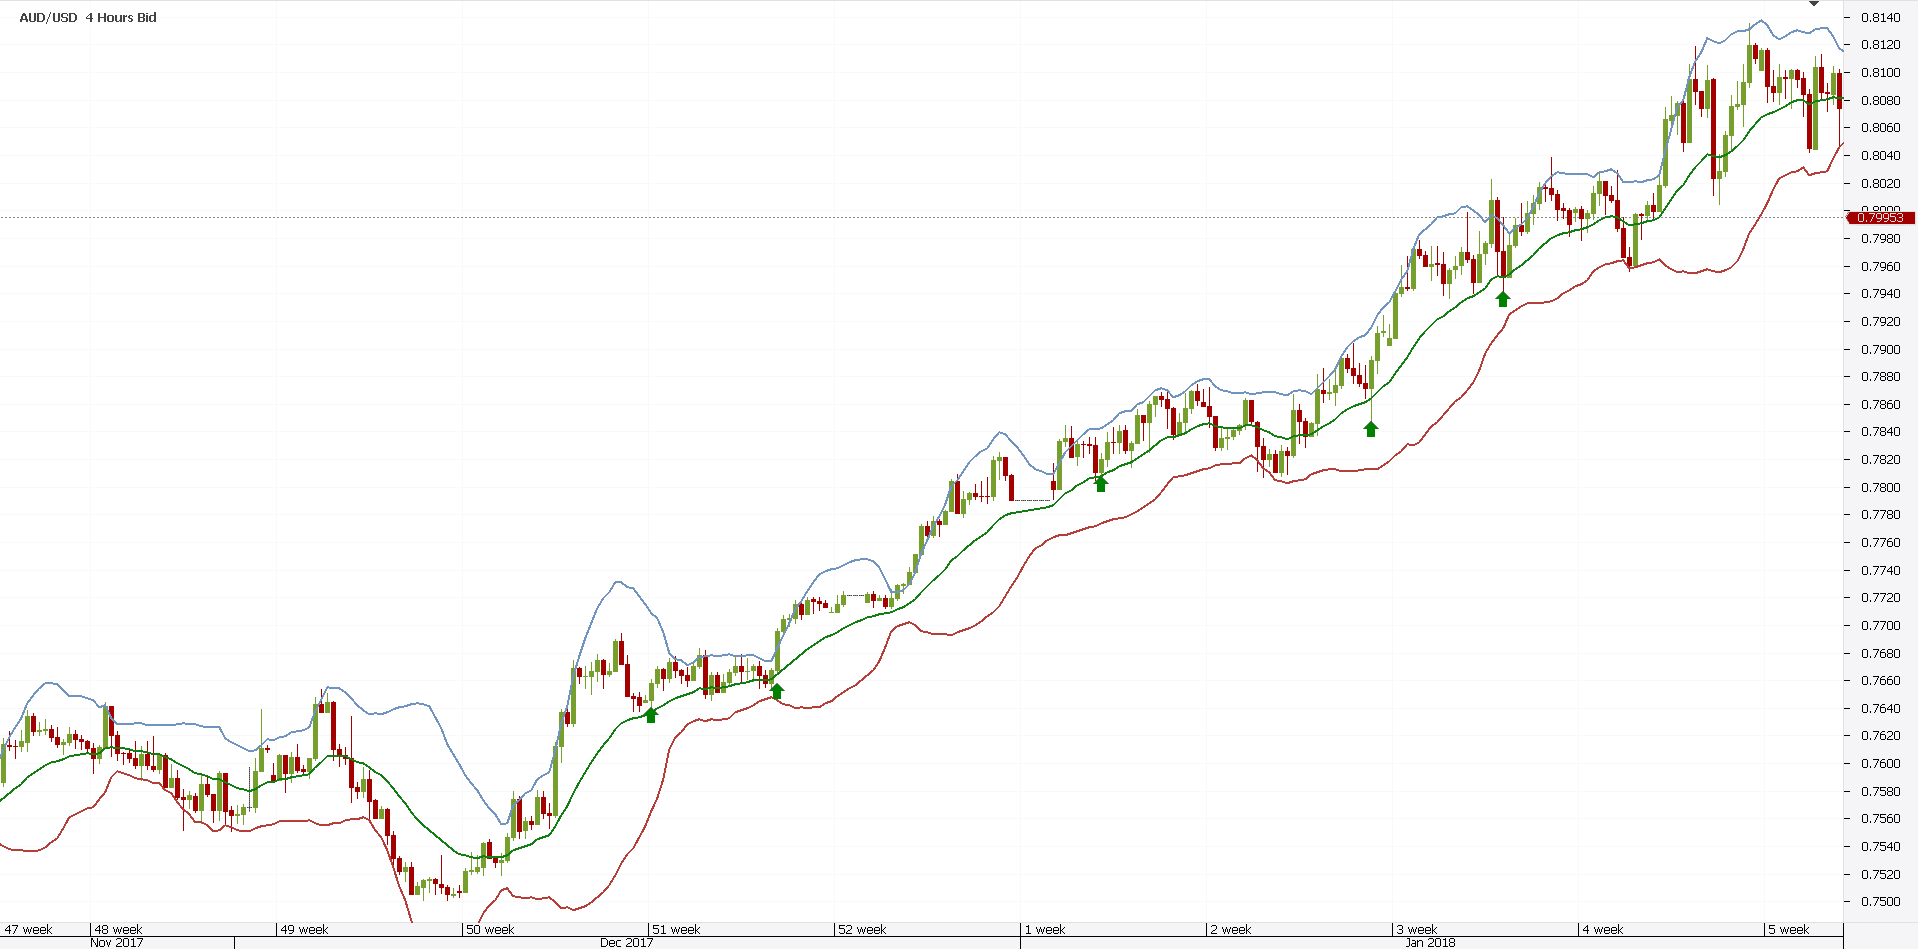
The AUDUSD chart above speaks for itself. The EMA shows as the line in the middle. Or, the green one.
Now, any other MA would fail to follow price so closely. That’s the reason why an exponential moving average works best in this kind of Forex analysis.
The strategy to use consists of:
- Waiting for the bullish trend to start. Use the lower high series break again.
- Buy the EMA pullbacks.
- Stop loss on a close below LBB.
- Target 1:2 or 1:2.5 risk-reward ratios.
As such, a simple approach to trading works best. But again, only when used with a sound money management system, the results will show up.
This way, there are plenty of occasions to ride the trend.
However, the beauty part comes from the timeframes to use. This is just one pair, and one timeframe.
Because of the money management rules, traders can use any timeframe. As long as they adjust the volume, they’ll be fine.
Golden and Death Crosses with EMA’s
For a golden or death cross to form, traders need two moving averages for their Forex analysis. Typically, SMA’s were used.
That’s understandable. Such crosses were invented on the stock market, long time ago.
Moreover, the exponential moving average concept wasn’t even available. It is now, though.
As explained earlier, the EMA comes closer to the price. It reduces the lagging time.
Therefore, when such a cross forms, the EMA’s will be the first ones to show the changes in trending conditions.
After all, this is what crosses like these show:
- The birth of a bullish trend after a golden cross
- The start of a bearish trend after a death cross
For this system, we need:
- EMA(50)
- And EMA(200).
The idea is to wait for the EMA(50) to cross above its bigger sister. That’s a golden cross. Or, a bullish one.
Just the opposite happens when it crosses below the EMA(200). A bearish market started.
The usual caveat applies here too: the bigger the time frame, the stronger the implications are.
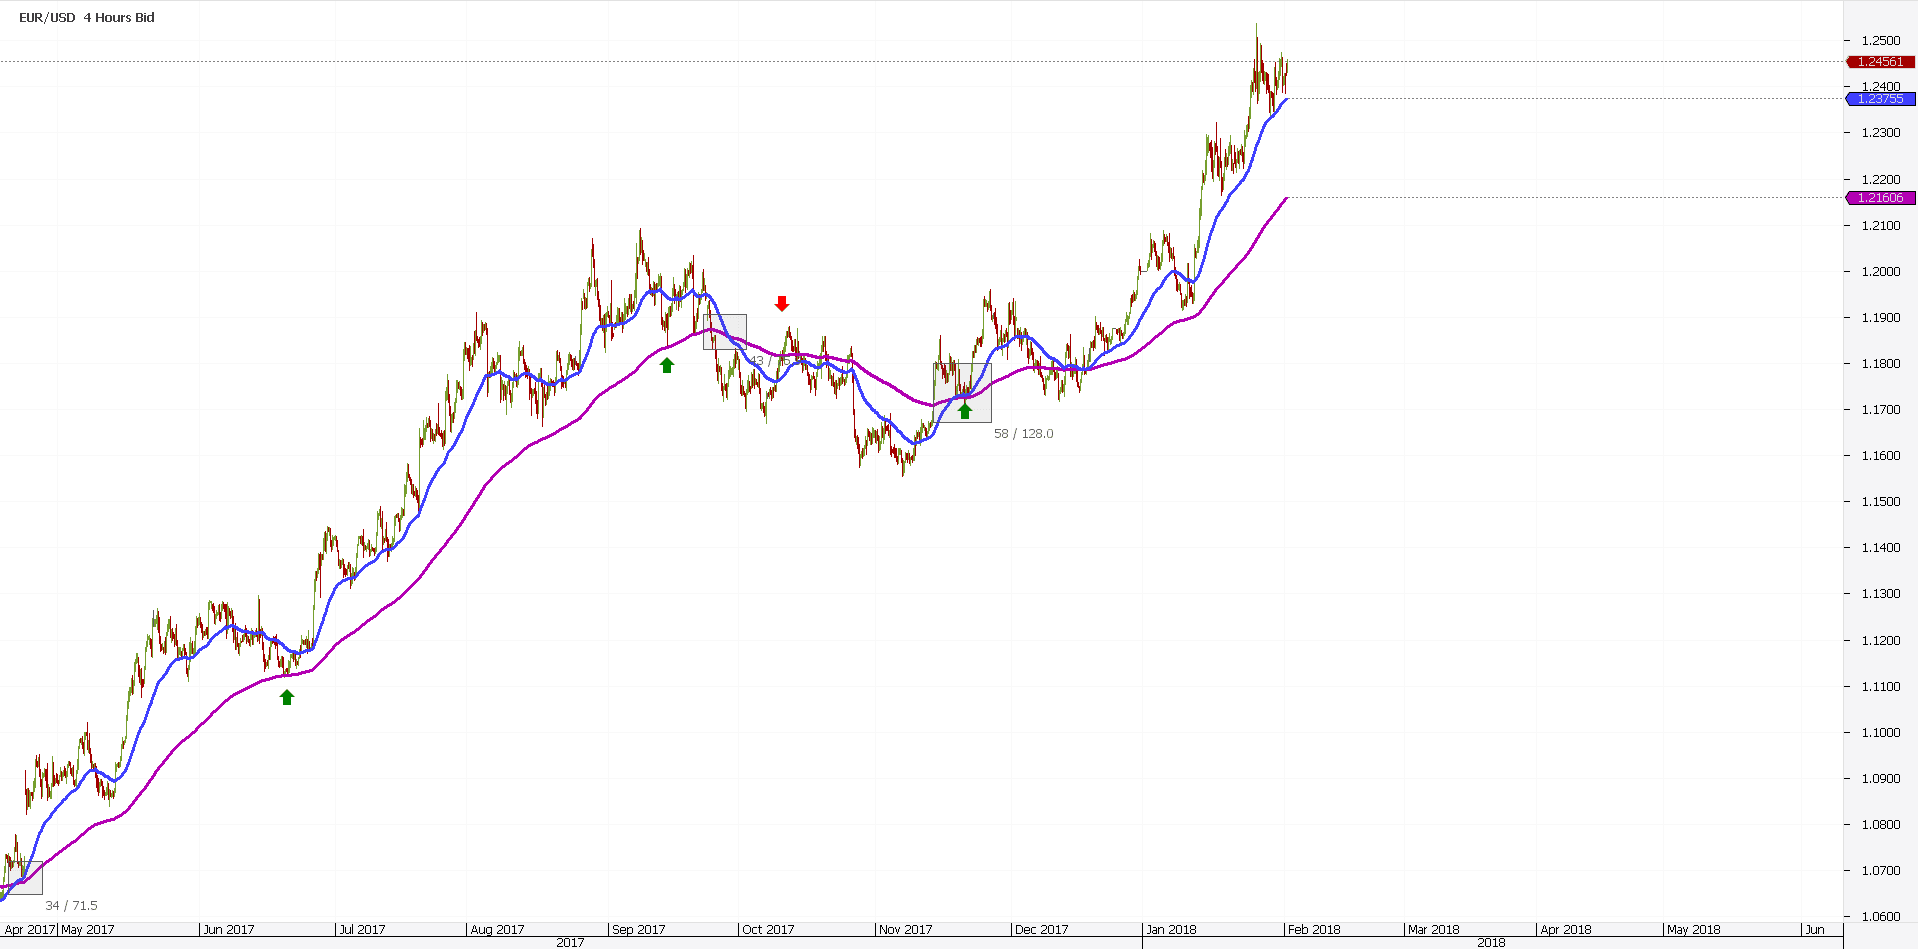
The 2017 trend in the FX market formed on the EURUSD pair. Whoever missed it, lost a big chunk of the price action last year.
Now, the funny story is that a simple Forex analysis like a golden cross helps. It has multiple advantages over other strategies.
Firstly, it is visible. One cannot argue he/she missed the cross. Especially considering the timeframe.
Secondly, it allows for excellent risk-reward ratios. Just use the higher/lows or lower highs for placing stops. And, a proper risk-reward ratio for the currency market.
Finally, it allows traders to ride strong trends. Using simple trailing stops, traders stay in a trade for as long as the trend lasts.
SMA’s vs. EMA’s
Because the crosses were given by the exponential moving average strategy, it is clear the EMA’s role in a Forex analysis.
While this article emphasized the advantages of using an EMA, reality begs to differ. The SMA is not necessarily worse.
Instead, it depends a lot on the purpose of using it. Or, the ultimate goal.
Indeed, the EMA will “turn” before the SMA does. Thus, it offers an earlier signal.
However, the SMA represents the true average over a specified period of time. We can’t say the same about an EMA.
Therefore, the SMA’s plot a stronger support and resistance level than EMA’s.
Using this information, the best approach would be to:
- Wait for golden/death crosses to form using EMA’s
- Enter on support and resistance on SMA’s.
A simple trick like this one makes the difference in a Forex analysis.
Timeframes to Use the Exponential Moving Average
The real subtitle here should include the length of the EMA too. The 200 one seems to be the longest used.
Keep in mind that the longer the period is, the flatter the line becomes. As such, it will have a hard time turning with the new trend.
Many traders become alerted when the price of a currency pair hits the EMA(200). That’s especially true if the EMA is on a monthly, weekly, or daily chart. It shows difficulty to continue in the same direction.
The market reaction follows a specific logic here. Those that enjoyed the ride will book profits.
If the trend was a bullish one, by squaring the position, they’d sell. New traders that want to join the party will sell directly on the EMA(200).
As such, just like that, the two forces (both bulls and bears) join the same market side. Because of that, the price of a currency pair reacts strongly when the EMA(200) comes.
Conclusion
Any Forex analysis represents, in fact, a strategy. How traders approach the market matters the most.
Some use small timeframes to get what they want from the market. These so-called scalpers have a very short-term oriented approach.
They go in and out of the market so quick that an exponential moving average strategy won’t help much. Mostly, they trade on the news and with expert advisors.
Swing traders and investors, on the other hand, do use moving averages. Because they want to spot a trend reversal as early as possible, EMA’s represent the first choice.
Moreover, when buying and selling at a predefined point, EMA’s offer a quicker entry. Again, with proper money management, any EMA Forex analysis works.
Of course, trending conditions help. When the market is in a range, strategies like the ones described here struggle.
But there’s a catch. Use them on different timeframes.
Apply the same principle on the same currency pair. But, using multiple timeframes.
These so-called multiple timeframes analysis concept allows riding various trends. Depending on the time frame, one trend can last for months or hours.
Take the perfect order strategy explained in this article. On one timeframe the signal may be bullish, on another one bearish, and so on.
After all, it is impossible for the market to consolidate on all timeframes. The Forex market doesn’t function this way.
If the broker allows hedging, then so be it. If not, traders use different accounts to profit from a multiple timeframe Forex analysis with exponential moving average strategy.
All in all, technical traders have yet another great tool to use. An EMA strategy helps in identifying strong trends and riding them.
After all, this is all that matters, right?
START LEARNING FOREX TODAY!
- exponential moving average
- FOREX
- Forex Analysis
- FOREX Strategy
- Forex Technical Analysis
- Moving Average
- Moving averages
- Technical Analysis
share This:


Leave a Reply