Reading Forex charts is one of the first steps you need to learn in your trading journey. Fortunately, you are in the right place to understand how a line chart, a bar chart or candlestick chart works. Moreover, mastering Forex charts will allow you to become an efficient and profitable trader.
To read a Forex chart you should:
- Open a chart in your trading platform (MetaTrader 4, for instance)
- Choose a chart type: A line chart, a bar chart or a candlestick chart
- Understand the price points and levels that are displayed in the chart
- Identify the chart timeframe: This could go from a 1-minute chart to a monthly chart.
This post will teach you everything you need to know about reading Forex charts. We have also added some helpful tips so you can customize your own charts, which will enable you to be more productive and help accelerate your learning curve in Forex.
Opening a Chart in MetaTrader 4
The first step is to go to your trading platform and open a chart. For practical purposes, we will use MetaTrader 4 as an example in this guide. Also, MT4 is the most recommended platform for getting started in Forex trading. However, the process below should be very similar if you are using MetaTrader 5 or a different trading platform.
To open a new chart, choose a currency pair on the Market Watch window, right-click it and then click the chart window option.
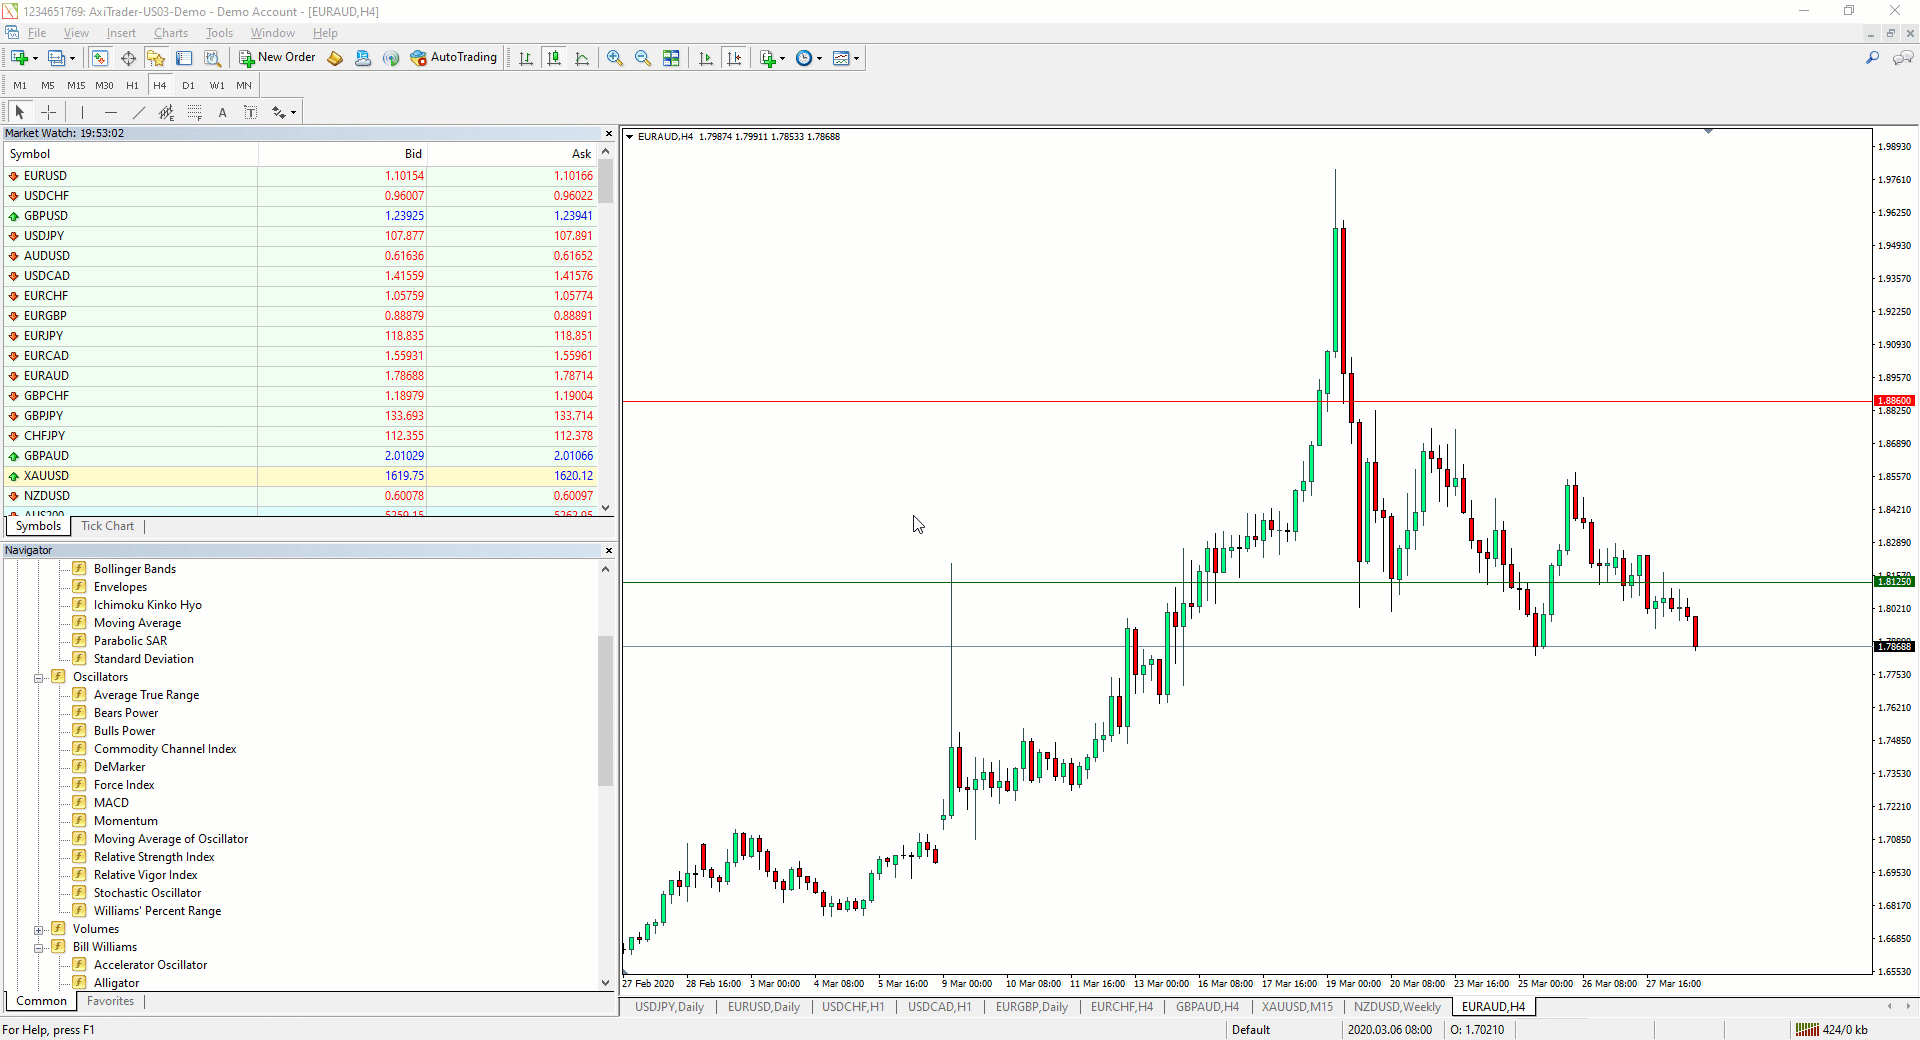
Opening a New Chart in MetaTrader 4 using the MarketWatch
Alternatively, you can click the ![]() button in the standard toolbar, which is usually located at the top right of the MetaTrader 4 window. Then, you can proceed to choose the currency pair:
button in the standard toolbar, which is usually located at the top right of the MetaTrader 4 window. Then, you can proceed to choose the currency pair:
Opening a New Chart in MetaTrader 4 using the toolbox button
After performing one of the two actions described above, you will get a new chart displayed that represents the price action of the chosen currency pair. If you don’t like the style of the new chart, don’t worry, we will teach you in a section below on how to customize your chart and create your favorite template.
Choosing a Forex Chart Type
Basic Elements of a Forex Chart
A Forex chart illustrates the price changes on a specific currency pair. There are two axes: the vertical or y-axis represents the price, while the horizontal or x-axis depicts a time-lapse.
Prices and Timeline Axis in Forex
This is how it looks in the MetaTrader 4 trading platform:
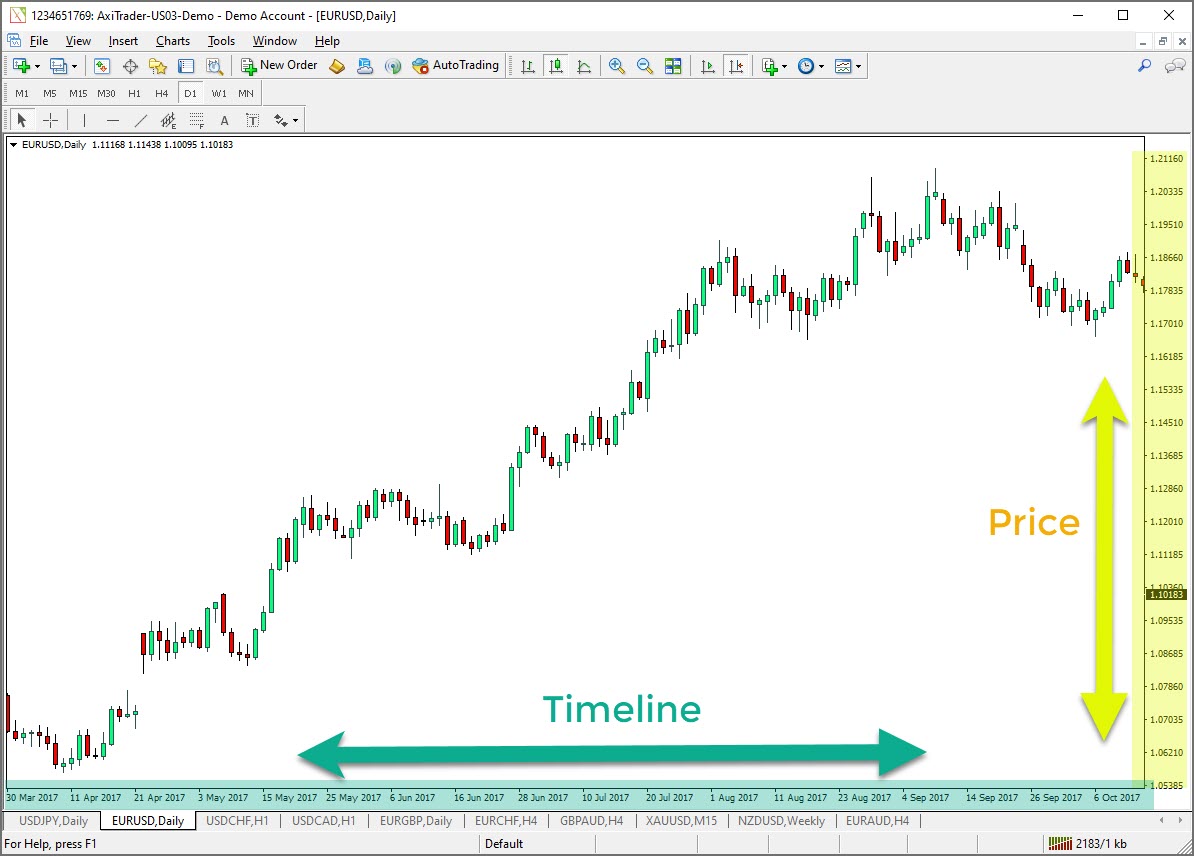
Prices and Timeline in MT4
As you can see in the image above, price action develops from left to right, so the most recent price information will appear on the right side of the chart. The marks in the x-axis represent a specific time period that may vary depending on the timeframe you choose for your chart.
Types of Forex Charts
In addition, there are three main types of Forex Charts:
- Bar Charts

- Candlestick Charts

- Line Charts

To choose one of these options in MetaTrader 4, click one of the following displayed above, which are located in the standard toolbar:
![]()
Standard Toolbar in Mt4
How to Read a Bar Chart
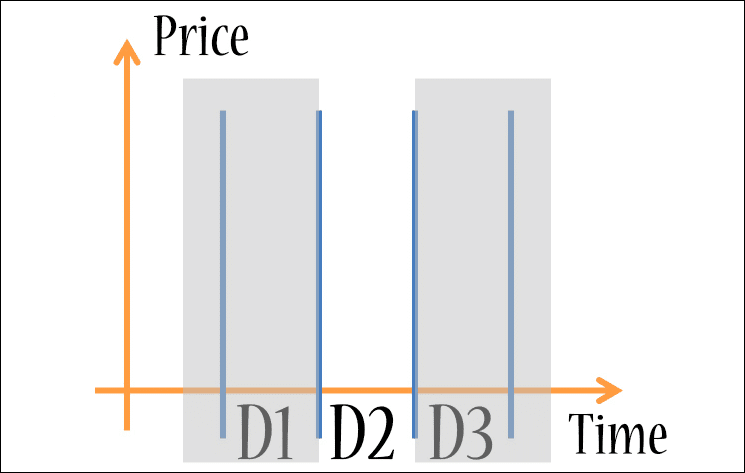
A bar chart is formed of a vertical line and two horizontal lines. The extremes of the vertical line represent the lowest (L) and the highest (H) price levels for a determined period. The two horizontal lines describe the open (O) and the closing (C) price levels, respectively. Therefore, you will often see bar charts under the name “OHLC bars”.
In the example below, you will notice how a bar chart can illustrate the price action of a day (D2):
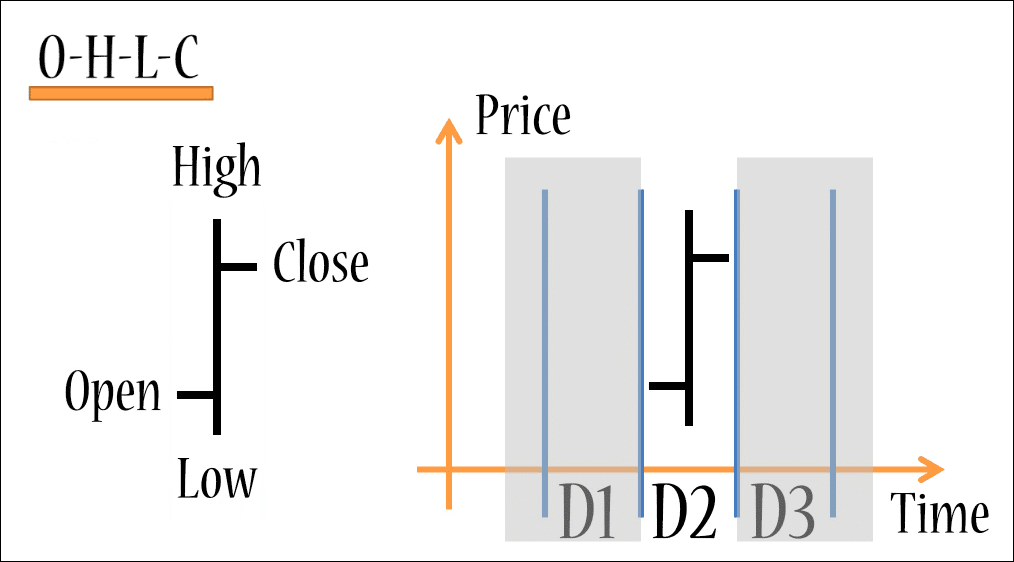
Anatomy of a Forex Bar chart
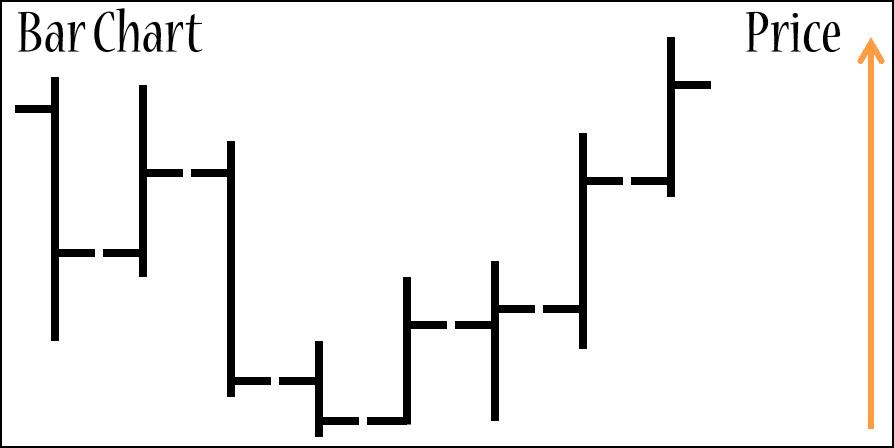
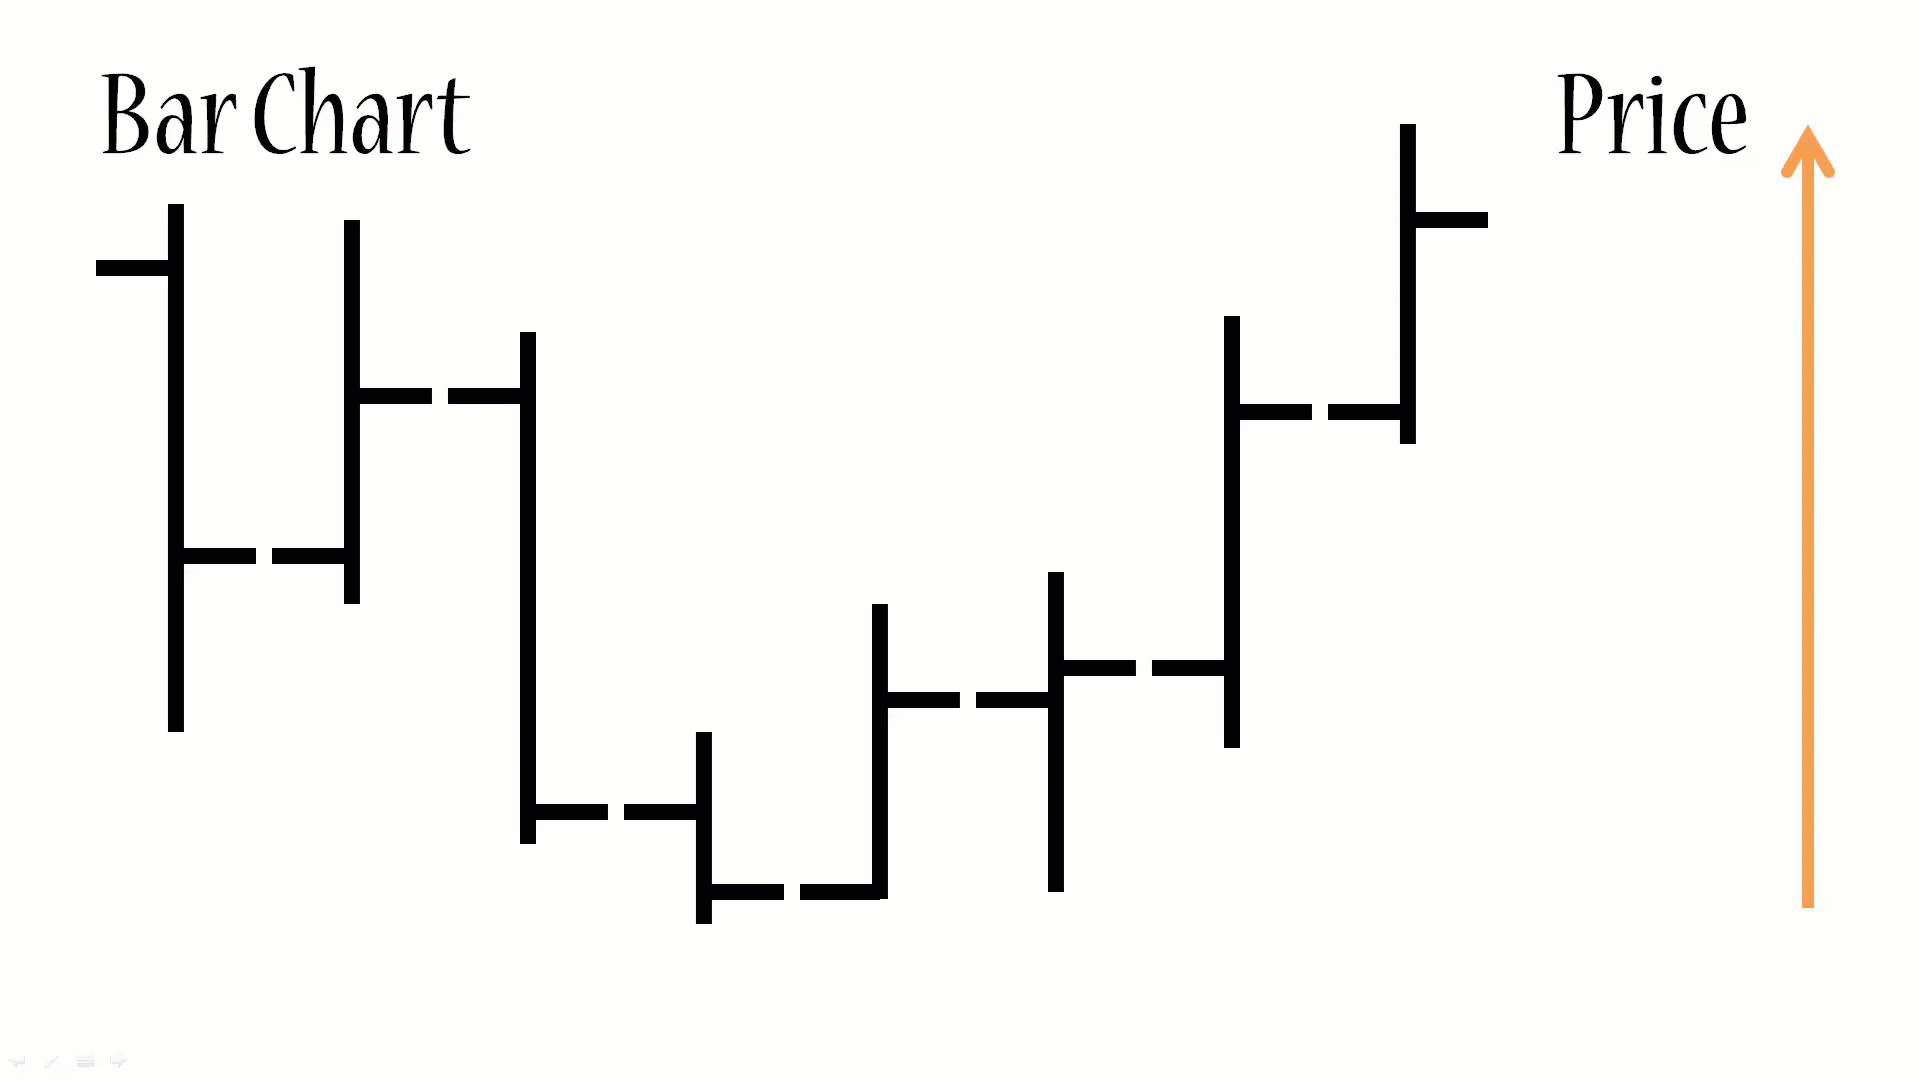
Then, multiple days take the following shape:
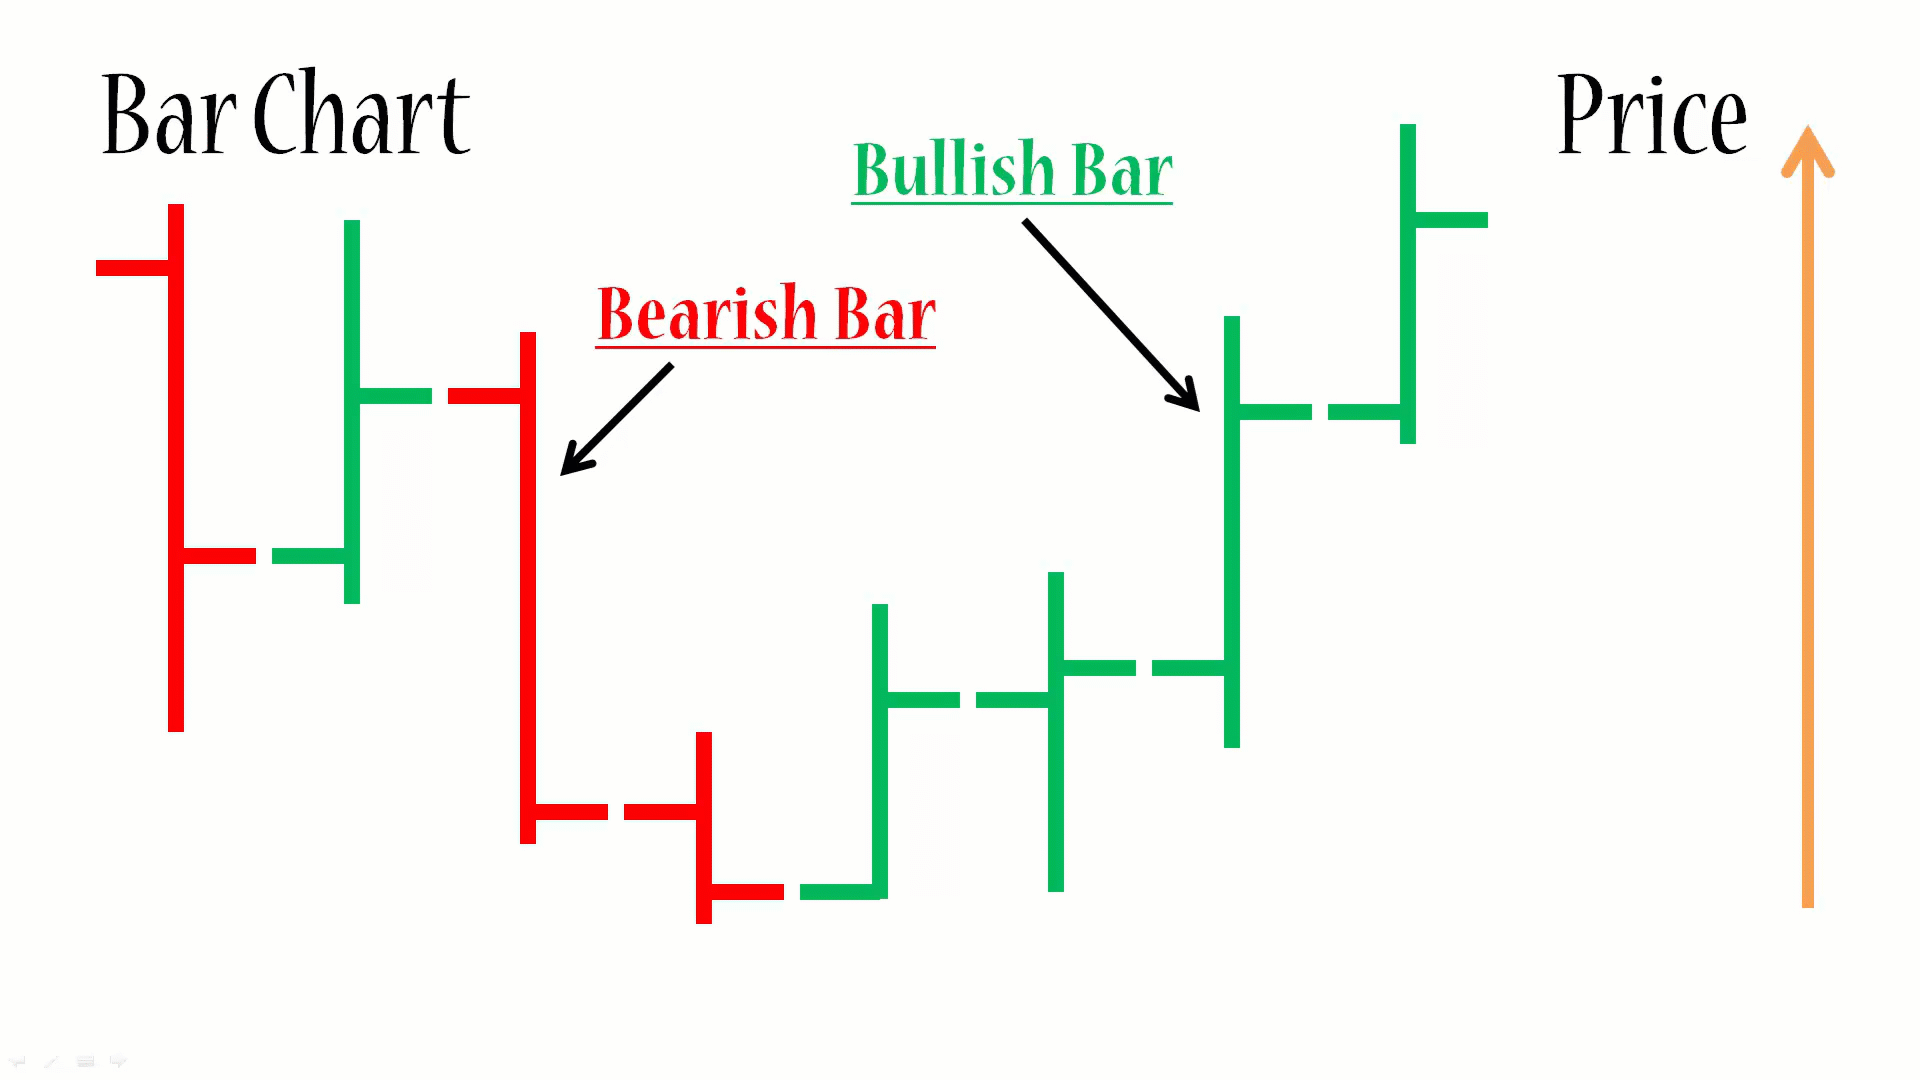
Most of the time, bar charts have different colors depending on their nature: if they are bullish or bearish.
- Green: represents bullish or buyer bars, meaning the close price is at a higher level in comparison to the opening price.
- Red: represents bearish or seller bars, meaning the close price is at a lower level in comparison to the opening price.
Bar charts and color meaning
How to Read a Candlestick Chart
If we add a box shape to the OHLC bars, we get a candlestick bar as a result.
Instead of one vertical and two horizontal lines, we have a rectangular bar. The rectangle symbolizes the body of the candle. Depending on the color, the start and the end of the body represent the open or the close price of the bar.
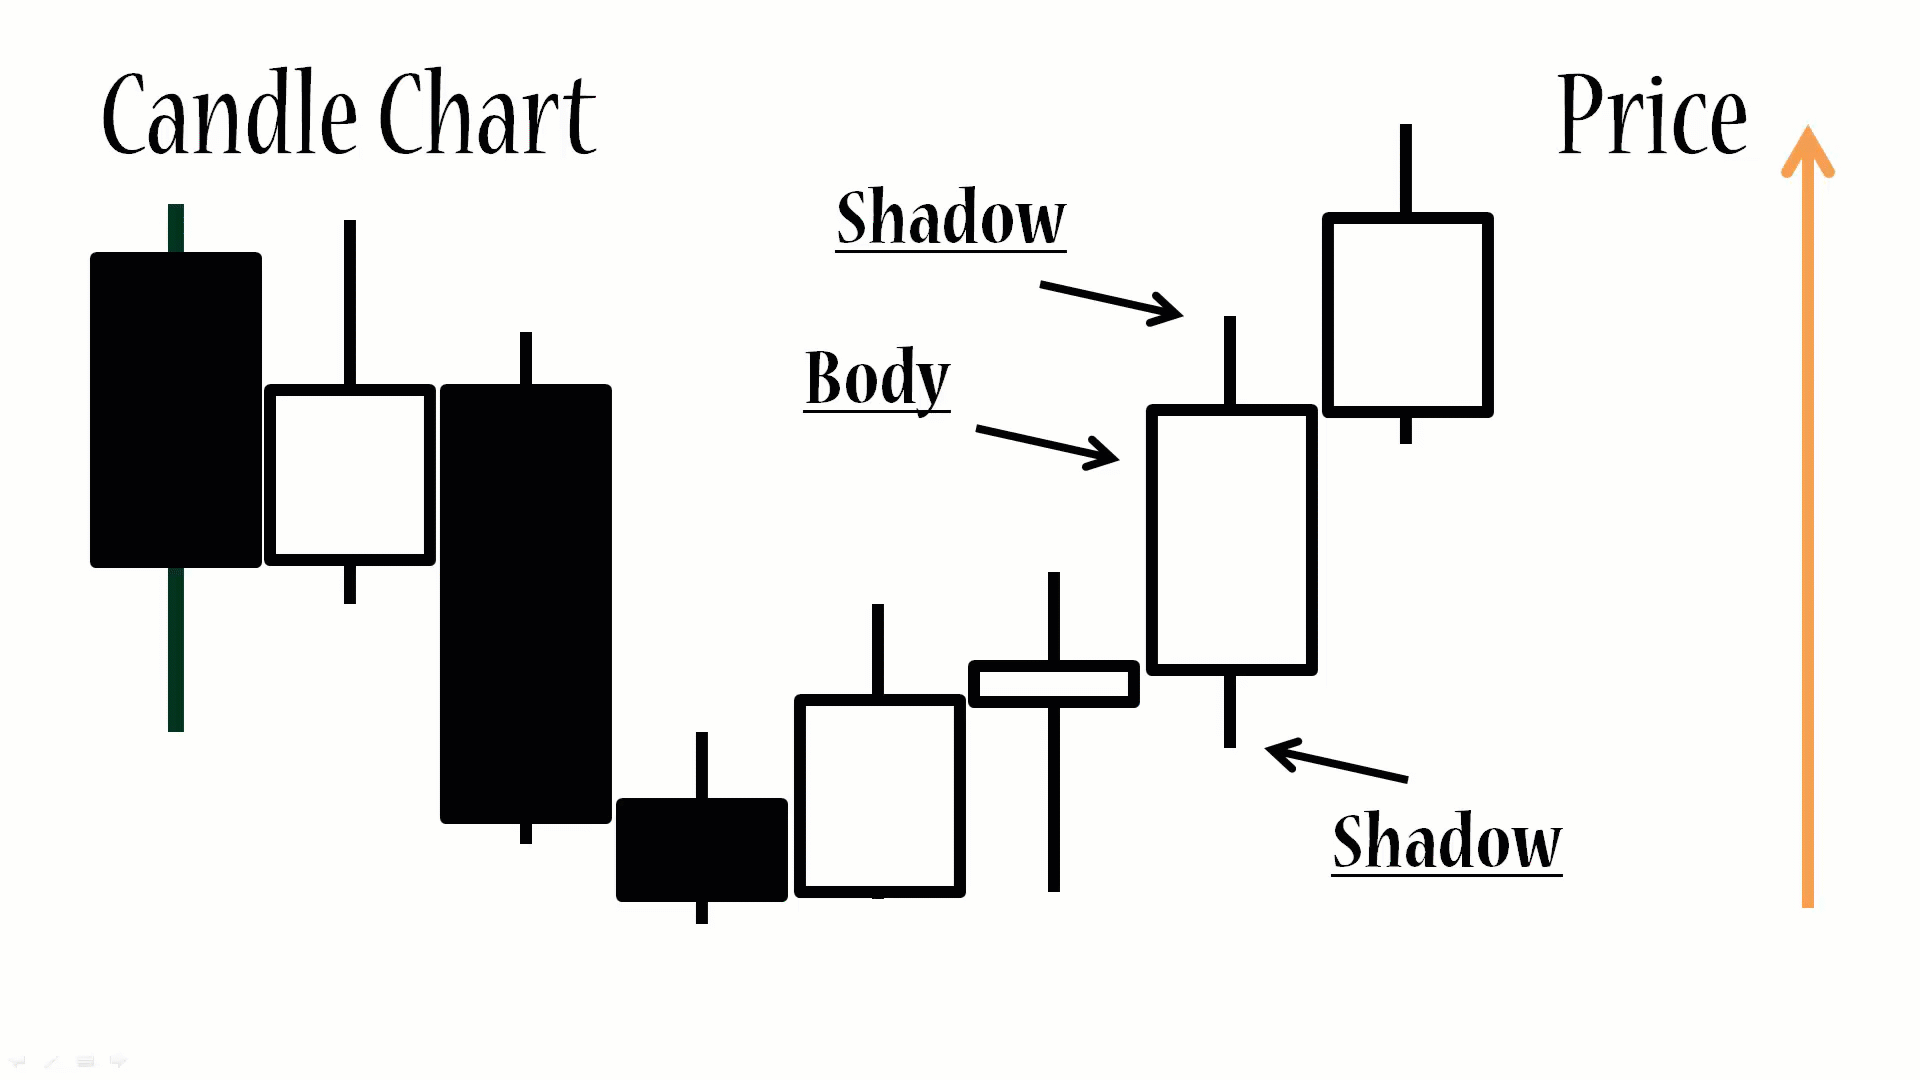
Anatomy of a Candlestick Chart
If the candlestick body is green or hollow (with the same color as the chart background), then it is bullish. On the other side, if the candle is red or “full”, then it is considered to be bearish.
Also, the candle usually has two lines attached: a shadow and a wick – the extremes of these extensions depict the highest and lowest price in a period.
Candlestick bars are also known as Japanese bars, due to their origin and because of the market theory that surrounds this type of chart. They are the most popular type of chart among Forex traders because candlesticks form patterns that can be interpreted as market signals to buy or sell a currency trade. Its massive adoption is mainly due to the information they can condense when being displayed.
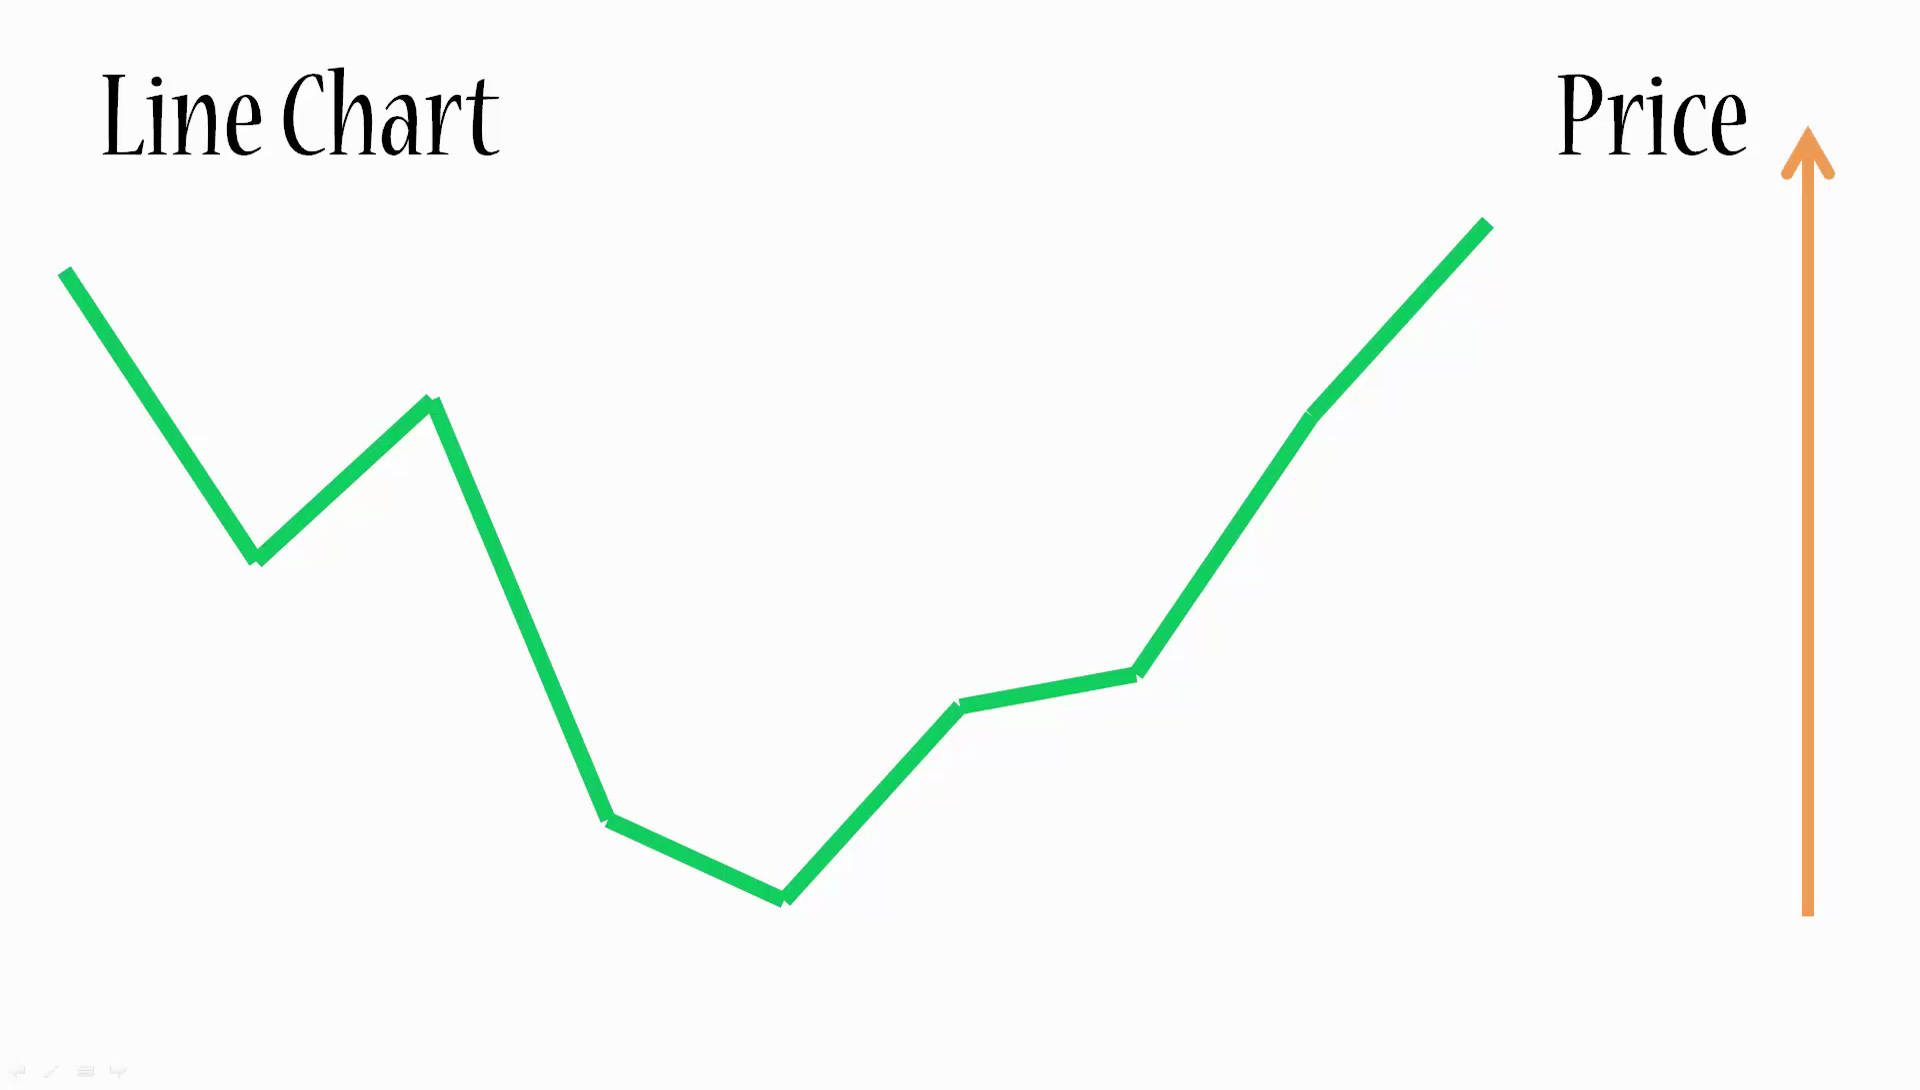
How to Read a Line Chart
Last but not least, we have the line chart, which is a simplified depiction of the price action in comparison to the bar and candlestick charts. The reason for this is that it only shows and connects closing prices of specific periods.
Anatomy of a Line Chart
Pros and Cons of each Chart Type
Let’s take a look at the main characteristics of the three main types of charts, their benefits and disadvantages:
| Chart Type | Pros | Cons |
|---|---|---|
| Bar Chart | It gives the trader a good representation of the price action and if there is a trend present. | It might be difficult to perform technical analysis and identify patterns that materialize into a trading strategy. |
| Candlestick Chart | It is the most robust representation of the price action, as it not only shows all the key levels for a specific period, but it also allows us to identify patterns and deploy technical analysis tools in a more effective way. | It can fall short when you are trying to assess the overall market trend. Different to bar charts, you depend on colors to identify if a bar is bullish or bearish. |
| Line Chart | Its simplicity allows the trader to identify or spot market trends easily. | You can miss important information about price action since the line chart is only based on closing prices. |
Chart Elements in MetaTrader 4
Chart Timeline:
The first element you can identify is the chart timeline: it is the X or horizontal axis located at the bottom of any chart and connects time periods depending on the timeframe you select to perform your market analysis (minutes, hours, weeks or months). It is important to mention that, when reading the timeline, the more to the left you go, the oldest the period you will see. In contrast, going to the right you will notice new periods.
Price Levels:
The price levels are depicted on a Y or vertical axis, on the right side of the chart. The values will depend on the currency pair you want to analyze. However, they all move in units called pips.
You should keep in mind prices increase from bottom to top. This has the following implications when you read the prices in conjunction with the timeline:
- If you notice prices in a chart (any type) increase from left to right, that illustrates an upward trend;
- but if there is a decrease, then you are probably watching a downward trend.
- Also, the market can show a sideways behavior or horizontal trend if prices fluctuate within a range of prices.
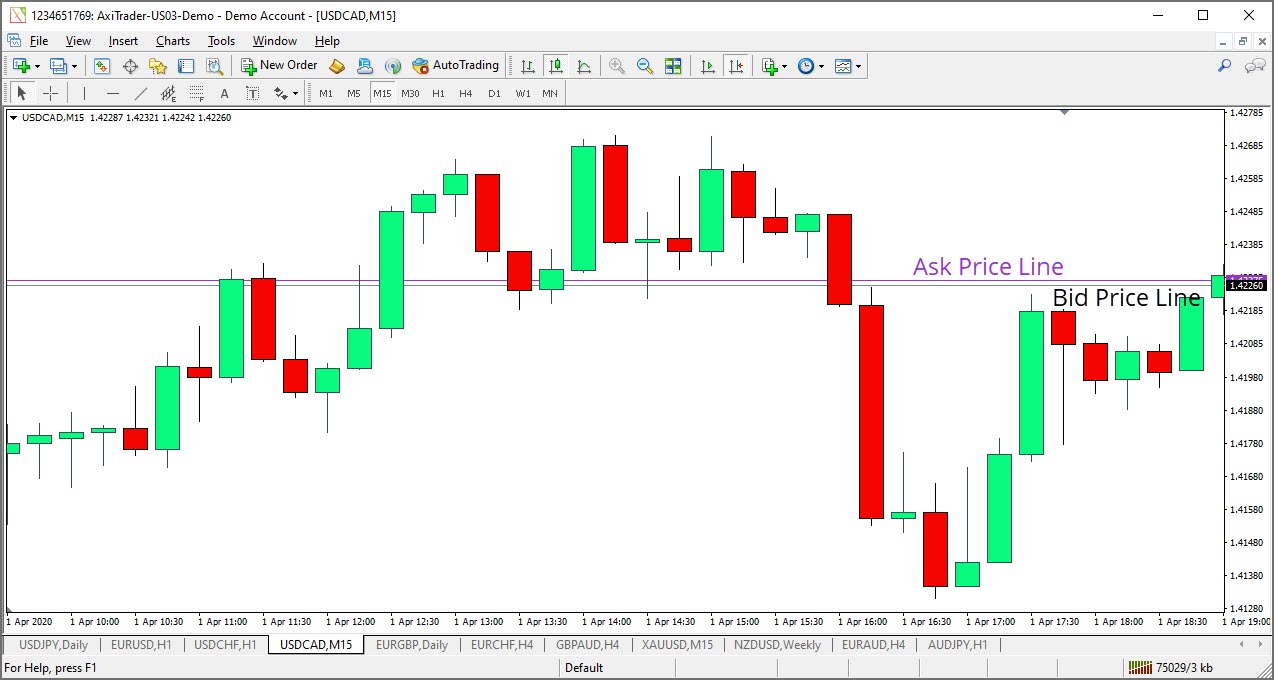
Current Price Line:
You will notice there is a line element in the chart that constantly moves and draws the price action as time passes by. This line is called the price line and it illustrates the current Bid price of a currency pair.
Also, it is key to clarify that, in Forex, you always have two types of prices: the Bid and the Ask. If you would like to buy a currency pair, you will be quoted at the Ask price. On the contrary, if you want to sell a currency pair, you will need to use the Bid price.
You can display both price lines in MetaTrader 4 by right-clicking a chart and selecting properties (or simply press F8). Then select the Common tab and check the Show Ask Line option and click OK.
The gap you will see between the Ask Line and the Bid Line is the spread, or the commission your broker makes for every trade you place. This gap will vary depending on the currency pair and its liquidity.
Identifying and Selecting Timeframes
There are different time frames you can select in a Forex chart. You will find the following options in MetaTrader 4:
- Minutes: 1 Minute (M1), 5 Minutes (M5) and 15 Minutes (M15)
- Hours: 1 hour (H1) and 4 hours (H4)
- Daily: D1
- Weekly: W1
- Monthly: Mn
To select or change the time frame of a chart, click the ![]() button located in the MT4 standard toolbox:
button located in the MT4 standard toolbox:
![]()
Alternatively, you can right-click the chart and select the period you want to display: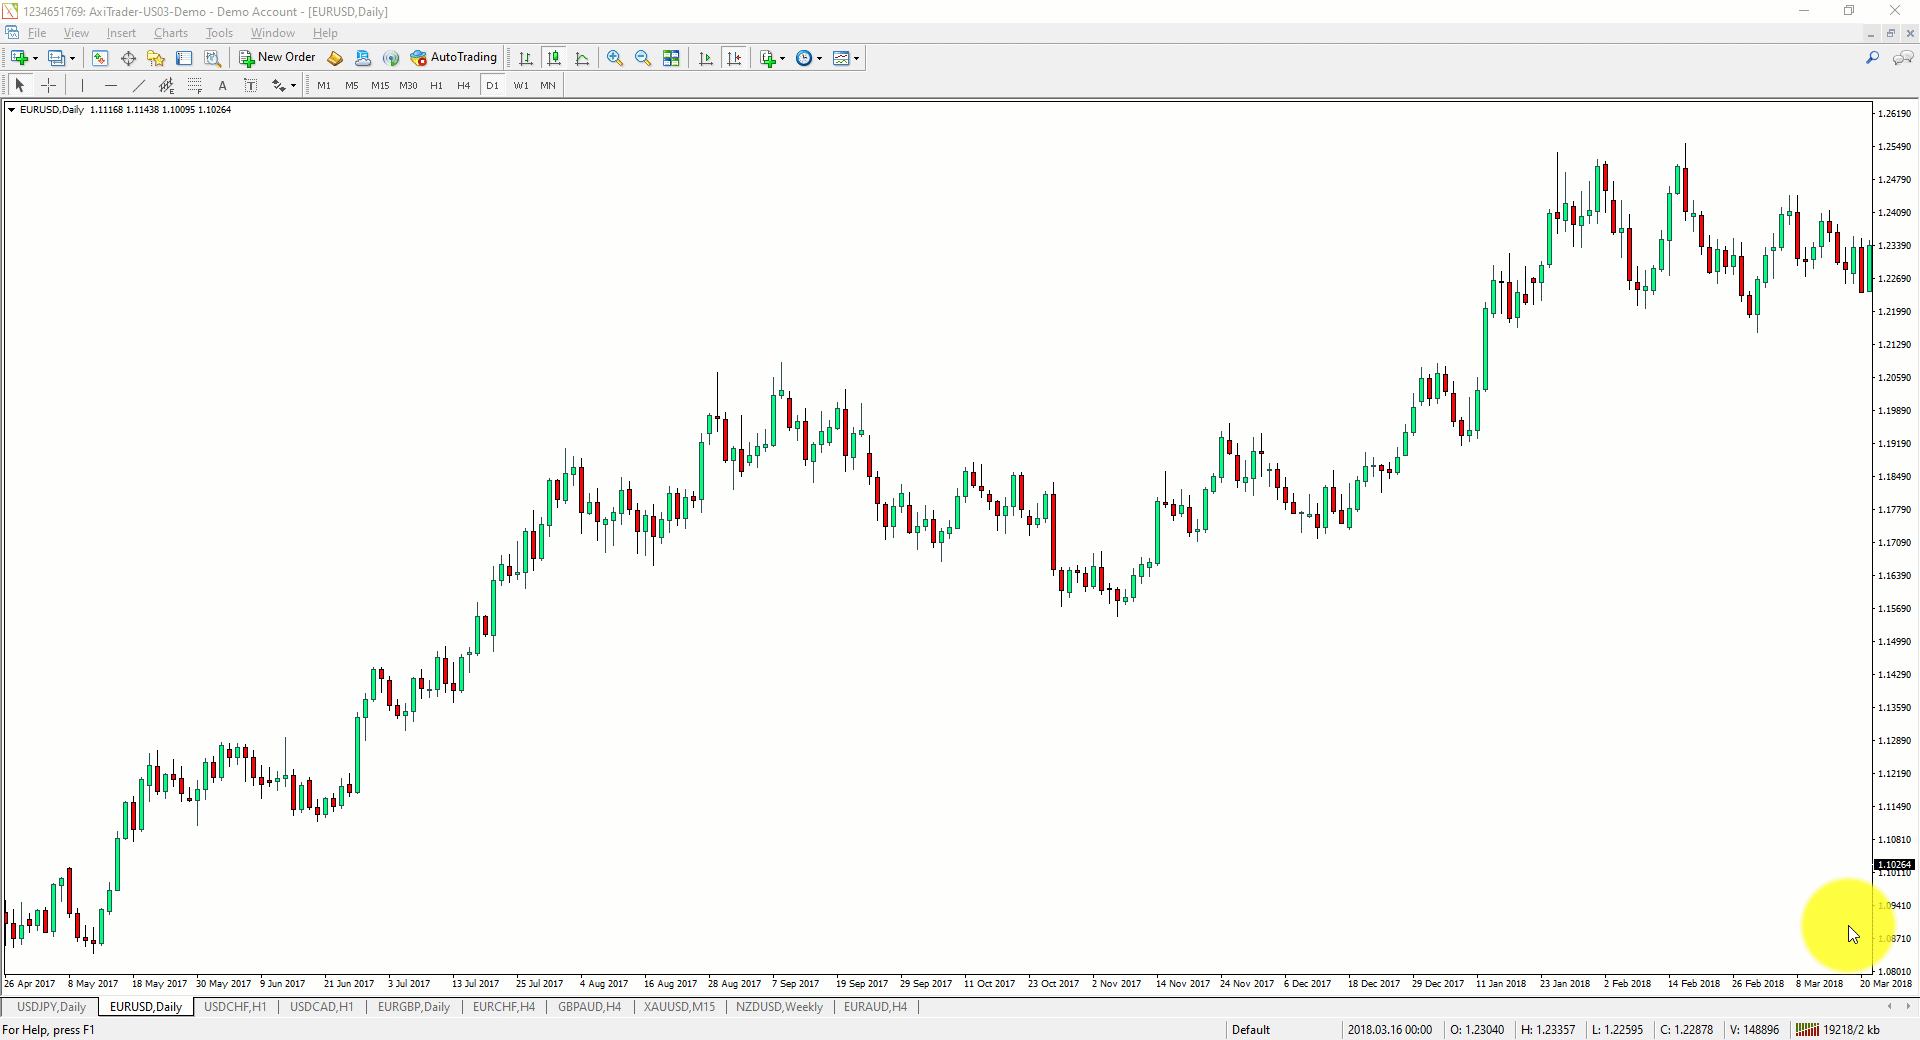
Timeframes and Trading Analysis
Using charts with different time frames can help you to build a more robust analysis of the market and gain a thorough perspective of the overall trend in a specific currency pair. This could be helpful before starting a trade.
For instance, if your technical analysis in an H1 chart signals you should place a buy or long order and, when checking the daily chart you see the overall trend of the currency pair is sideways, it means the downside movement could be limited.
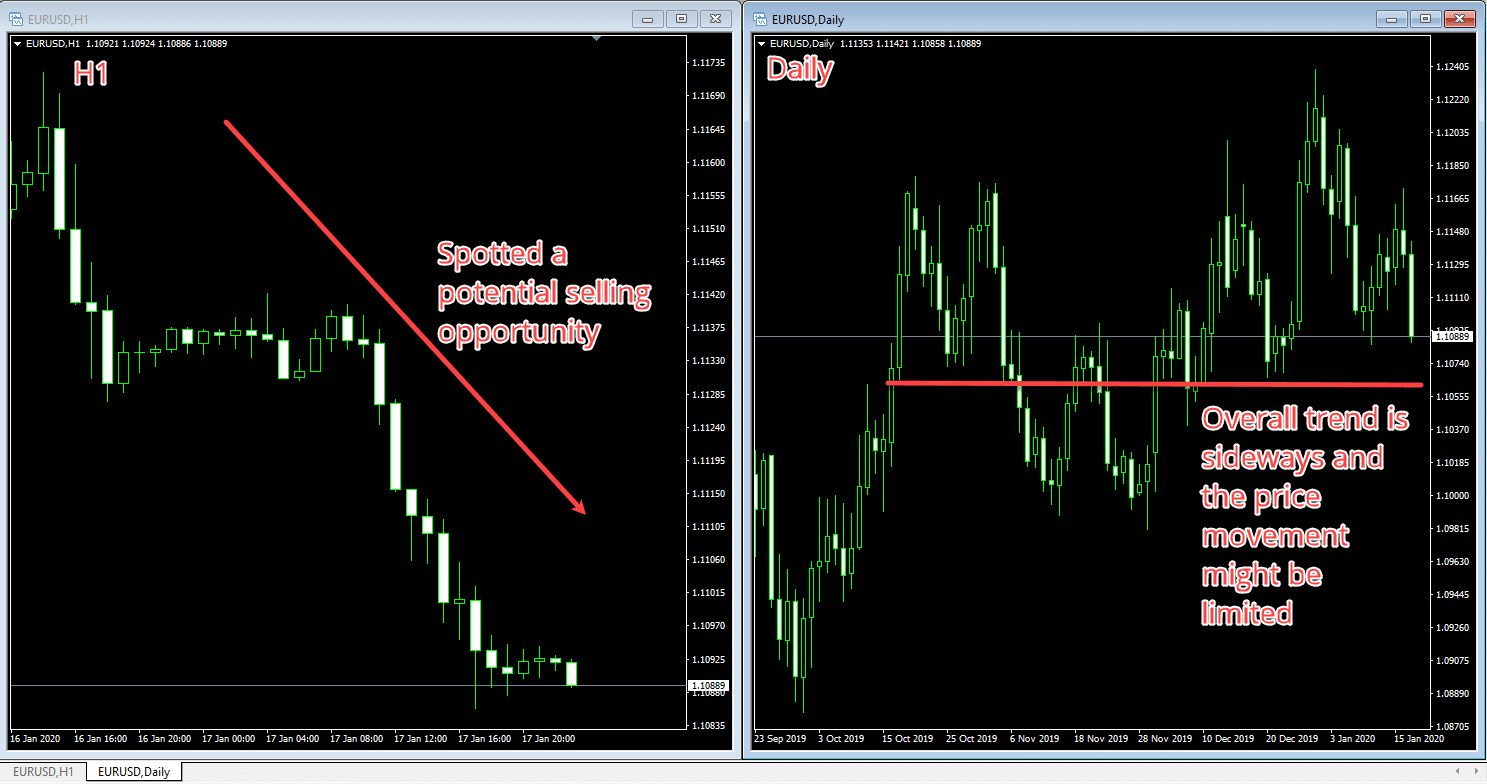
Analyzing Multiple Timeframes
Customizing your Forex Charts
When reading Forex charts, it can be handy to create your own chart templates that will allow you to save time in your analysis and fulfill your preferences. You can customize your charts in MetaTrader 4 by following these simple steps:
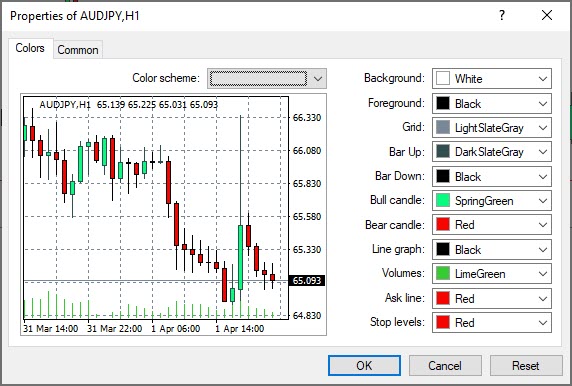
Right-click your chart and click on properties.
You will get the following window displayed, where you can adjust different chart elements:
Saving Chart Templates
You can save a chart template on MetaTrader 4 with your preferred settings by right-clicking the chart and selecting the save template option. Then, give it a name and click save.
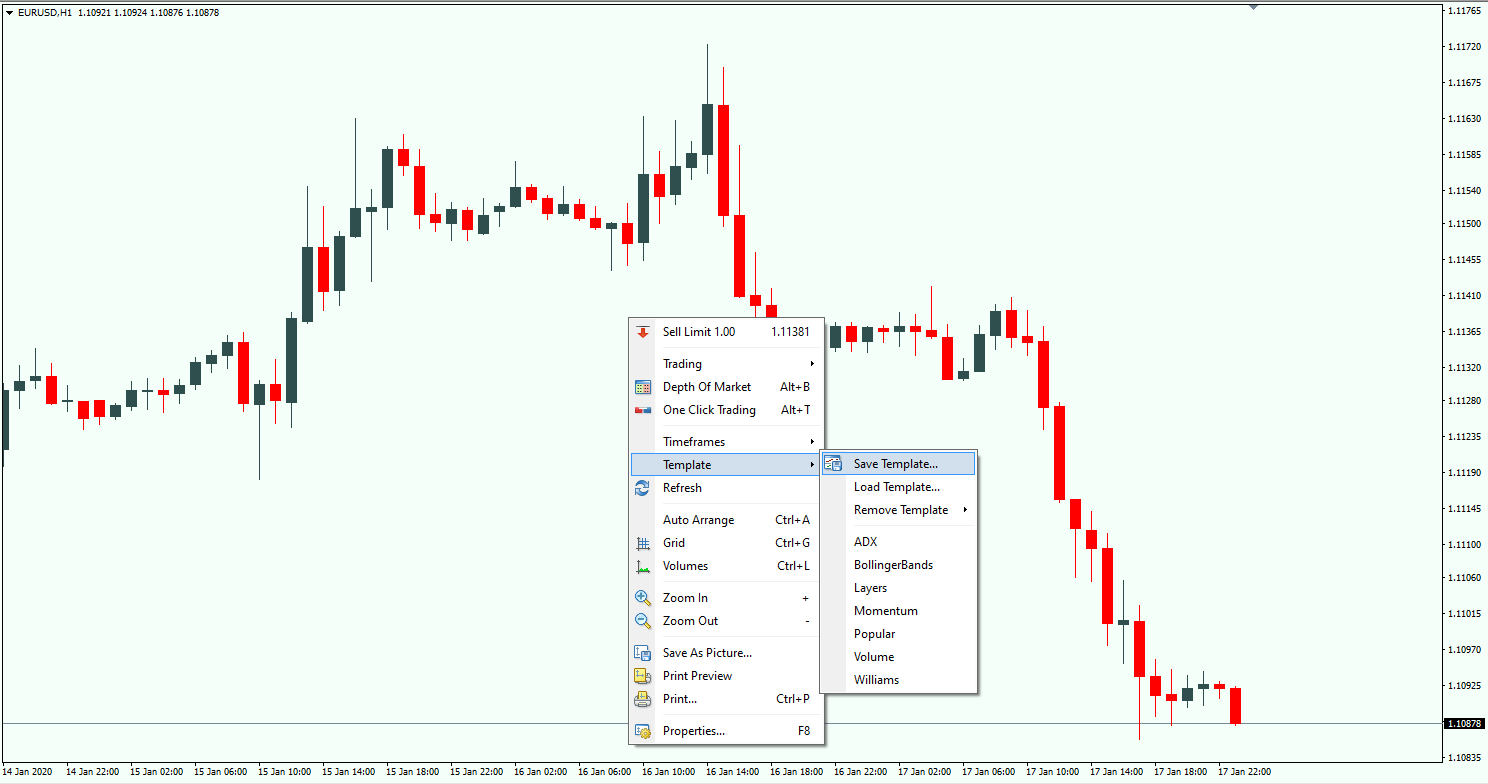
Saving a Chart Template in MetaTrader 4
Loading Chart Templates
To load your chart template with your preferences in a new Forex chart, open a new chart in MT4, then right-click it and select the load template option. Then choose your template.
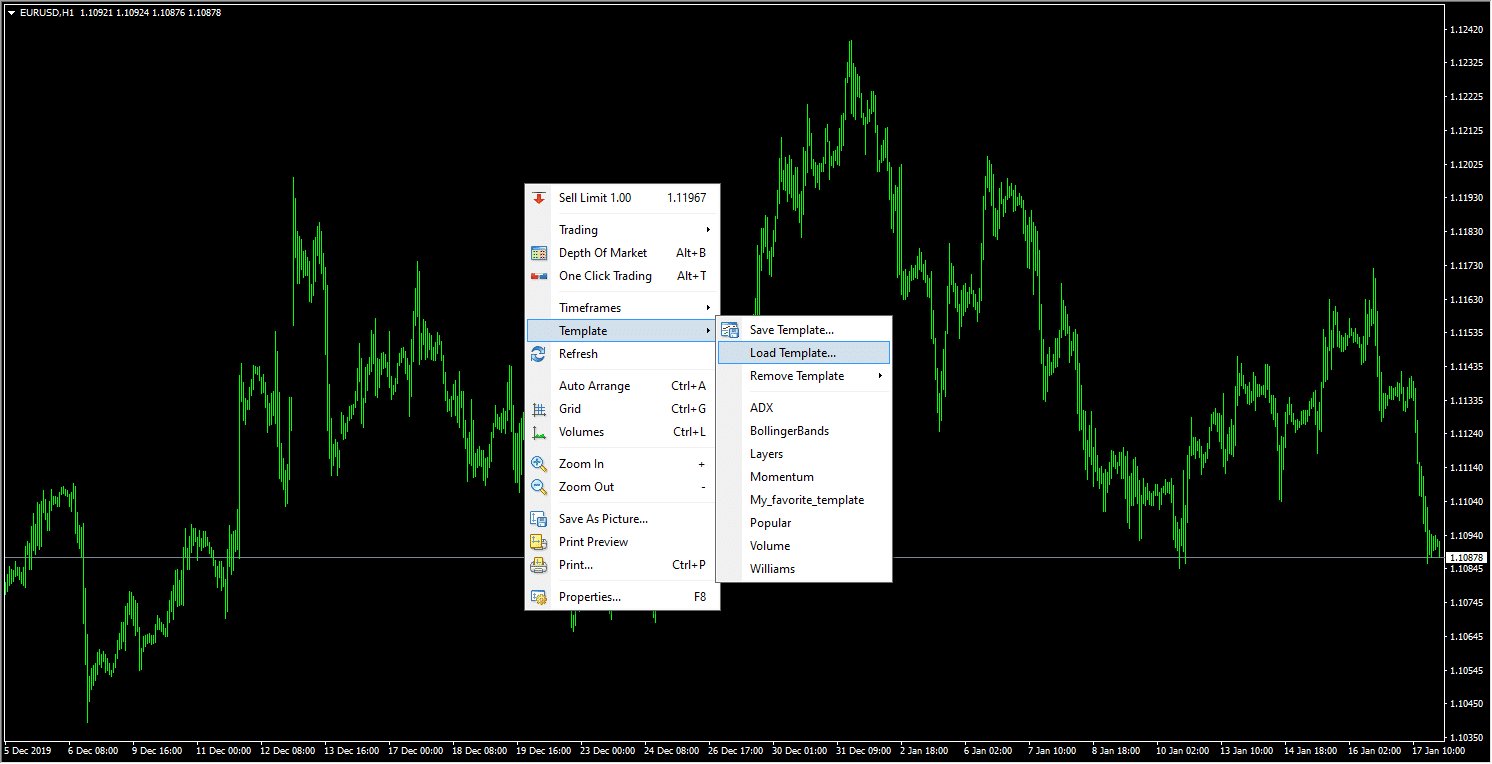
Loading a Chart Template in MetaTrader 4
Conclusion
We hope that this guide helped you to understand better how to read and customize Forex charts in MetaTrader 4. If you have any feedback or questions, please post them in the comments section.
Happy trading!


Leave a Reply