Spotting a trend reversal is the dream of every trader. It gives an early entry and offers a competitive advantage against conservative traders. As for reversal patterns, Forex traders have a plethora to choose from. Therefore, they focus on the most powerful reversal patterns and use them with a proper money management system.
There are at least two types of Forex traders:
- Conservative ones.
- Aggressive ones.
A conservative trader is most likely to use a trend trading strategy. He/she doesn’t like to take inutile risks.
As such, he/she waits for a new trend to turn. Then, looks for a pullback. Finally, takes a trade.
On the other hand, aggressive traders risk more. That is, they like to risk more than conservative ones.
Reversal patterns were invented by these types of traders. They’re like sharks. But, risking is one thing. Risking it as part of a money management system is another.
When dealing with reversal patterns, Forex traders use the same approach. If a pattern works on a time frame, it should work on any time frame. Right?
Moreover, if a pattern works on a currency pair, it should have the same results on any currency pair. That’s why it is called a pattern!
A pattern recognition approach offers multiple advantages:
- Keeps all things visual
- Allows traders to master trend reversal patterns
- Provides excellent risk-reward ratios
- Eliminates emotions, as the approach is the same.
- Works on all timeframes
This article aims to highlight the most powerful technical analysis reversal patterns. In doing that, we’ll use both the Western and the Japanese approach to the market.
It all starts with …a trend, of course!
Western Reversal Patterns
As you should know by now, technical analysis as we know it has two approaches. The classic one comes from the Western world.
Or, from the United States. That’s the birthplace of it. And, we inherited quite some powerful trend reversal patterns.
To start with, we must look at a trend. What makes it?
Here’s a series of things to look for:
- Consecutive lower highs or higher lows
- The market bounces/gets sold from support/resistance levels
- The market respects a trend line
But, how do we know when the trend ends? How to know when to stop buying the dip in a bullish trend? Or, the spike in a bearish one?
In time, traders noticed the market repeats itself. After all, if history repeats itself, the Forex market is the best place to challenge that saying.
The attention paid. For price does form reversal patterns at the end of a trend.
Hence, we can use them to trade the start of a new trend. As such, we’ll have an early start on the new trend.
Sometimes, when the reversal patterns Forex traders use, form on the bigger time frames, that’s quite something. The pips from the more significant timeframes make the difference in a trading account.
The Western approach to technical analysis left us with three major trend reversal patterns:
- Head and shoulders
- Rising and falling wedges
- Triangles as reversal patterns
The Head and Shoulders Trend Reversal Pattern
Perhaps the most famous Forex reversal patterns, the head and shoulders consist of:
- A head
- Two shoulders
- A neckline
- A measured move
The thing with this model is that you won’t know it forms. That is unless the head completes.
But, what makes the head of it? That’s simple.
A head has two major moves:
- One in the direction of the trend. A strong, powerful spike that is the last trend’s breath.
- Another one in the opposite direction. It is as violent, as powerful, and stops late bulls.
Next, a consolidation follows. Moreover, it continues the consolidation before the head move started.
You must imagine this pattern was discovered years ago. The Forex market didn’t exist.
Or, at least not the Forex market we know today. As such, in time, it changed.
Today, robots or trading algorithms make the market. They buy or sell and execute various orders automatically.
However, the rules to trade it remained the same. Moreover, the pattern works to this day, providing traders know how to deal with it.
How to Trade the Head and Shoulders Pattern
To start with, any technical book presenting the head and shoulders as a trend reversal pattern will show it on the horizontal. That’s very rare today in the Forex market.
A more accurate representation looks like below:
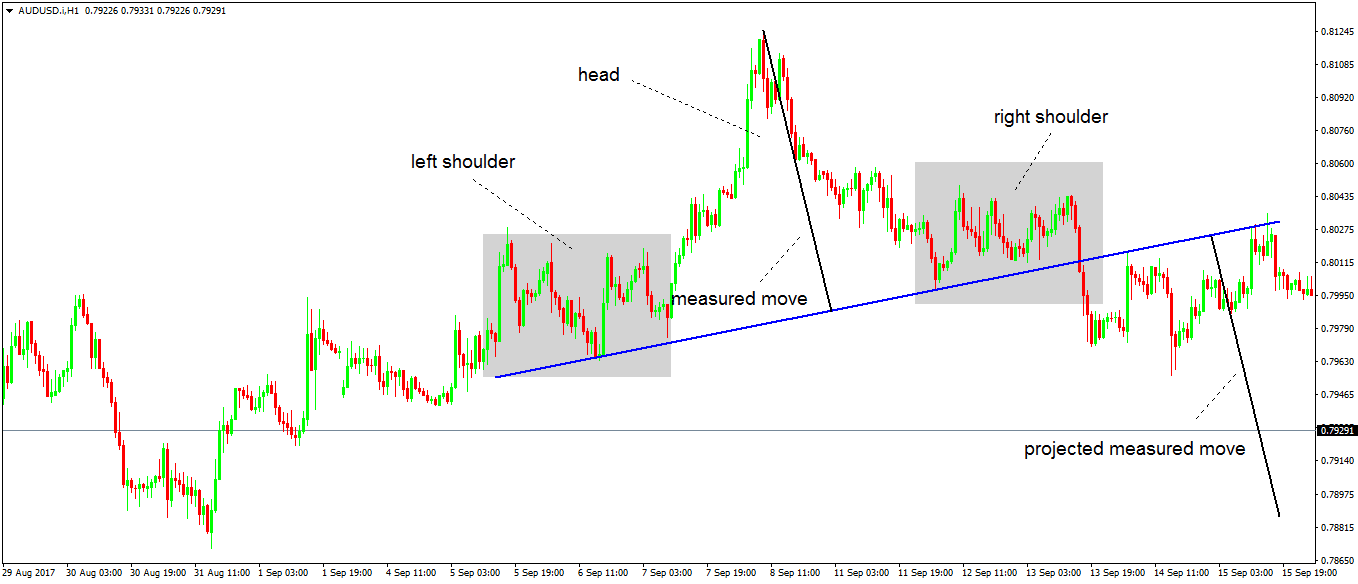
Starting from left to right, we have:
- A consolidation (first grey block). That’s the left shoulder.
- Suddenly, the market spikes higher, continuing the previous trend. That’s the first part of the head.
- An almost similar opposite move follows. That one completes the head.
- The market stops and continues the left shoulder’s consolidation. It essentially forms the right shoulder.
- The blue line is the neckline. Traders draw it to mark the support in the two areas that define the shoulders.
Conservative traders wait for the neckline to break. And, for the price to retest it.
Next, they enter. In this case, they sell short.
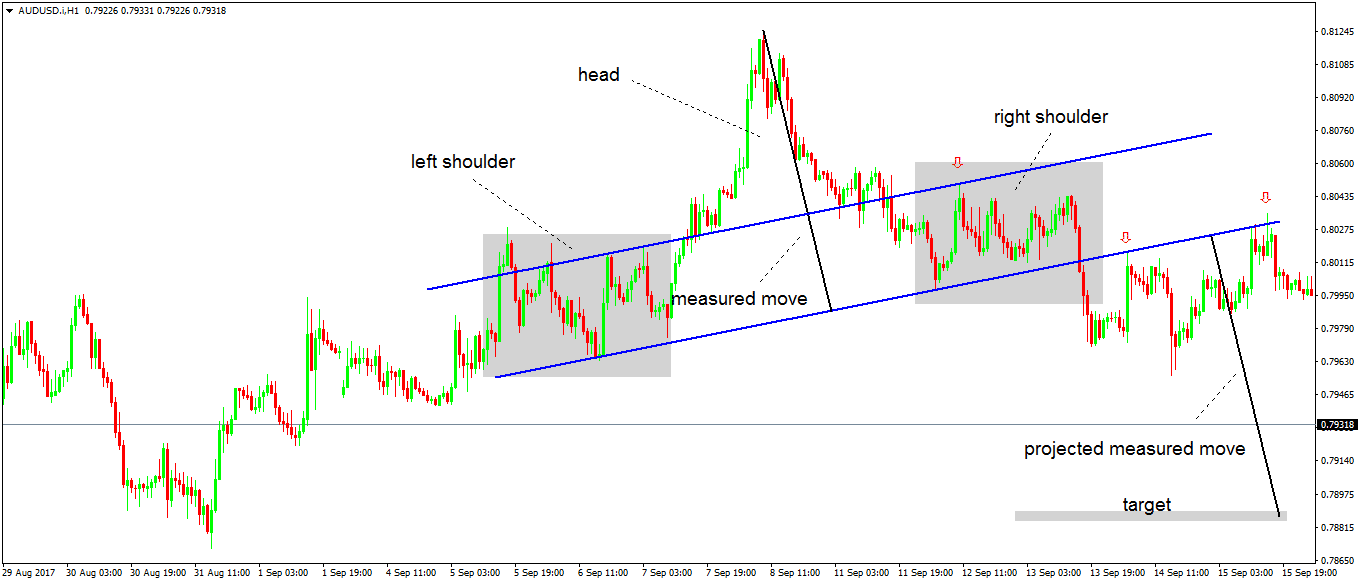
Moreover, they go for the measured move. But, aggressive traders will do something more:
- They’ll copy the neckline
- Project it from the left shoulder’s upper part
- Wait for price to reach it/almost reach it
- Short from there to have an early start
The aggressive approach may or may not work. But, even the conservative one may fail.
Check below:
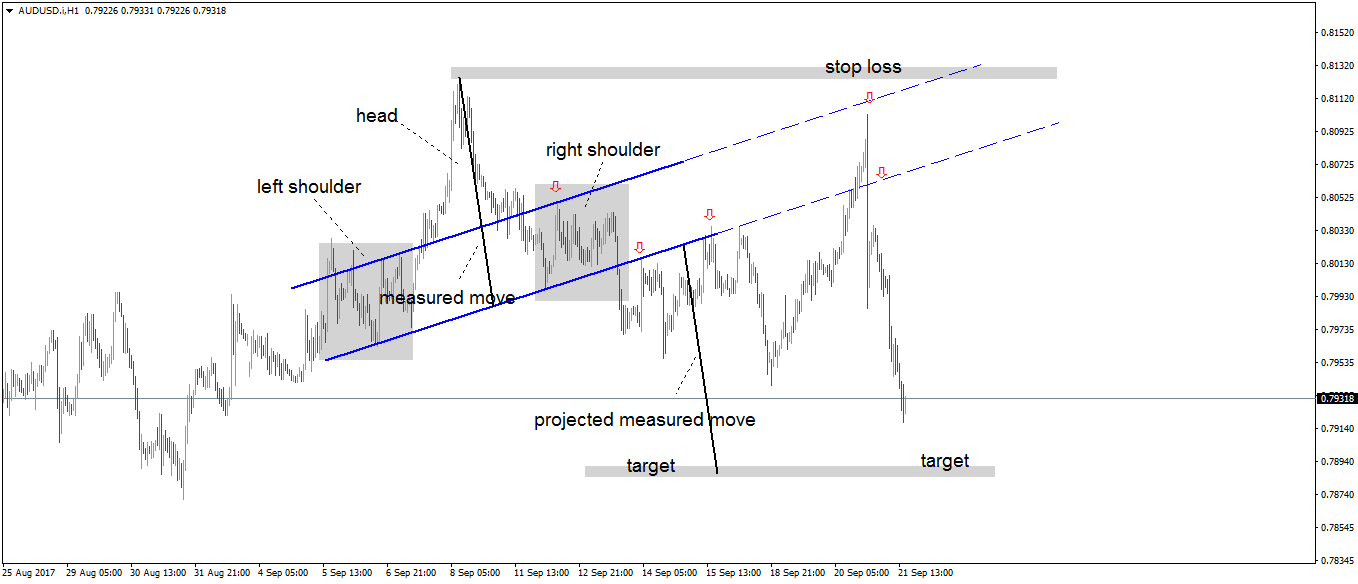
The measured move didn’t come. Moreover, the price reversed to the neckline. And, it continued to almost invalidation.
What’s the invalidation you say? The highest point of the head. That’s obvious.
In the end, reversal patterns like this one above work. But this example accurately shows the way it appears today in the Forex market.
Rising and Falling Wedges – Powerful Reversal Patterns
The head and shoulders pattern described above showed a bearish trend reversal. Namely, it appeared at the end of a bullish trend.
But, the same principles apply after a bearish trend. Only that the pattern will show a bullish trend reversal.
The same is valid for wedges. They are:
- Bullish – falling wedges
- Bearish – rising wedges
When a wedge forms, the traders expect the trend to turn. In fact, wedges are powerful reversal patterns Forex traders look for.
A wedge can even act as a Forex reversal trend indicator. How come?
Rarely a wedge breaks the other way. If still, it does, traders trade in the new direction and recover the loss.
However, a wedge rarely reaches the stop loss. What’s a proper one?
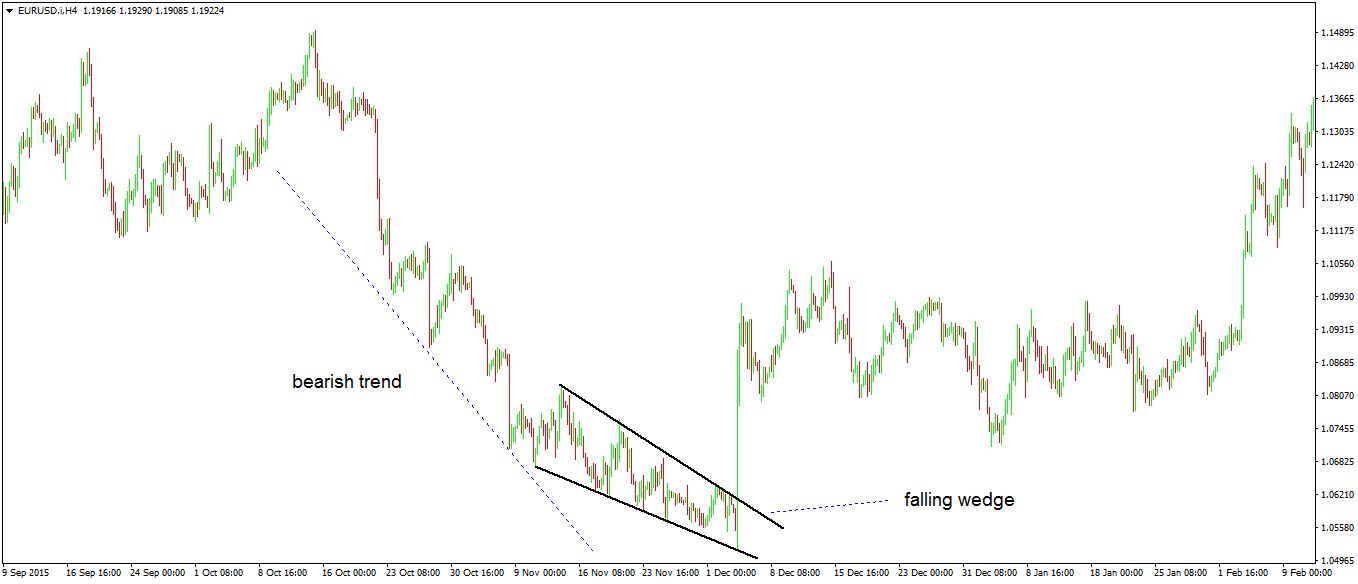
Above is a falling wedge. As mentioned earlier, the market reverses trend after the price breaks the upper trend line.
So it did! Traders set a stop loss at the lowest point of the wedge. And, the take profit respecting minimum 1:2.5 or above 1:3 as risk-reward ratio.
As a reminder, this is a standard ratio for the Forex market. Of course, the price may witness a powerful trend reversal. Bigger risk-reward ratios may work.
After all, if wedges are reversal patterns, the initial trend will turn. Right?
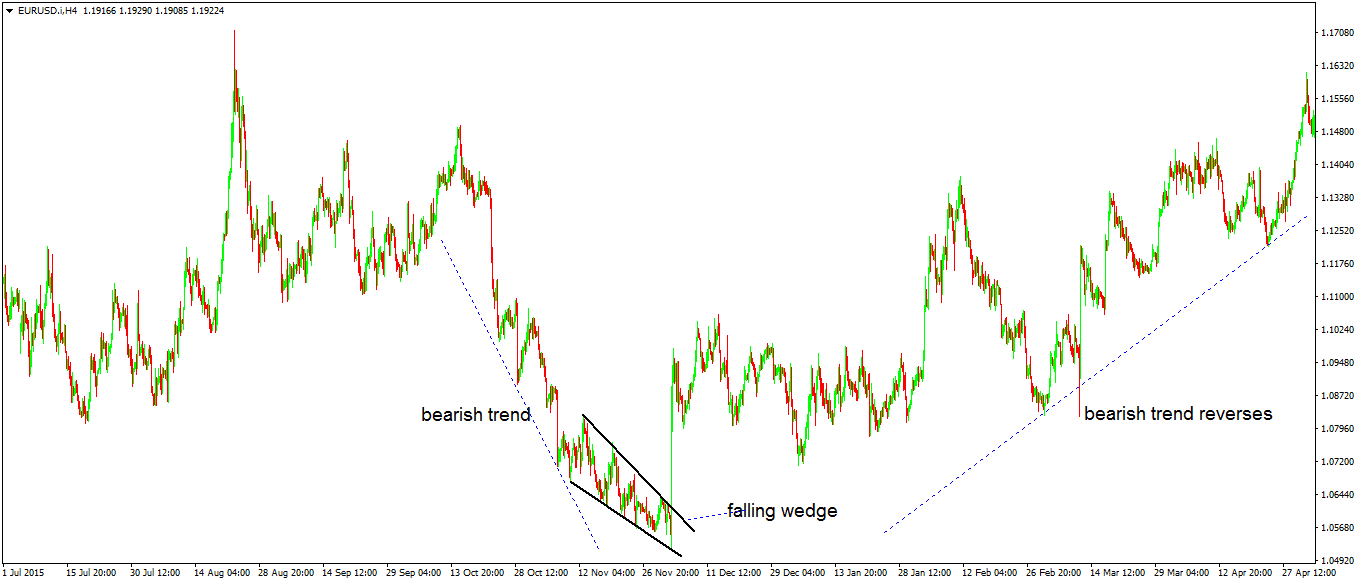
Indeed it turned! Check out the price action that followed, as the bullish trend reversal worked like a charm.
However, in general risking one pip to gain two and a half or three is more than enough to build a healthy money management system.
A rising wedge saw bearish conditions. It’ll reverse a bullish trend. As such, Forex traders treat it similarly.
Triangles as Reversal Patterns
Every technical trader heard of triangles. I mean, if there’s one pattern to form the most, that’s a triangle.
The problem is that most of the traders look for them to continue a trend. Or, in a healthy trend, the market pauses.
And, when it does that, it’ll consolidate in a triangle. As such, ascending (bullish) or descending (bearish) triangles appear on a chart.
Because traders aren’t familiar with triangles as reversal patterns, they form often. That’s especially true in Forex trading.
The Elliott Theory gives the best definition of a triangle. Let’s see what makes it a trend reversal pattern:
- It has five legs. No more, no less.
- Traders label it with letters. They signal corrective structures.
- When the price breaks the b-d trend line, the triangle is over.
As such, only look for the trend line to break. But, there’s a catch.
When dealing with such triangles as reversal patterns, Forex traders look for something. Better said, they look for clues.
What could be a clue in this case? Easy! The triangle forms at the end of a trend.
Or, in Elliott’s terms, at the end of a complex correction.
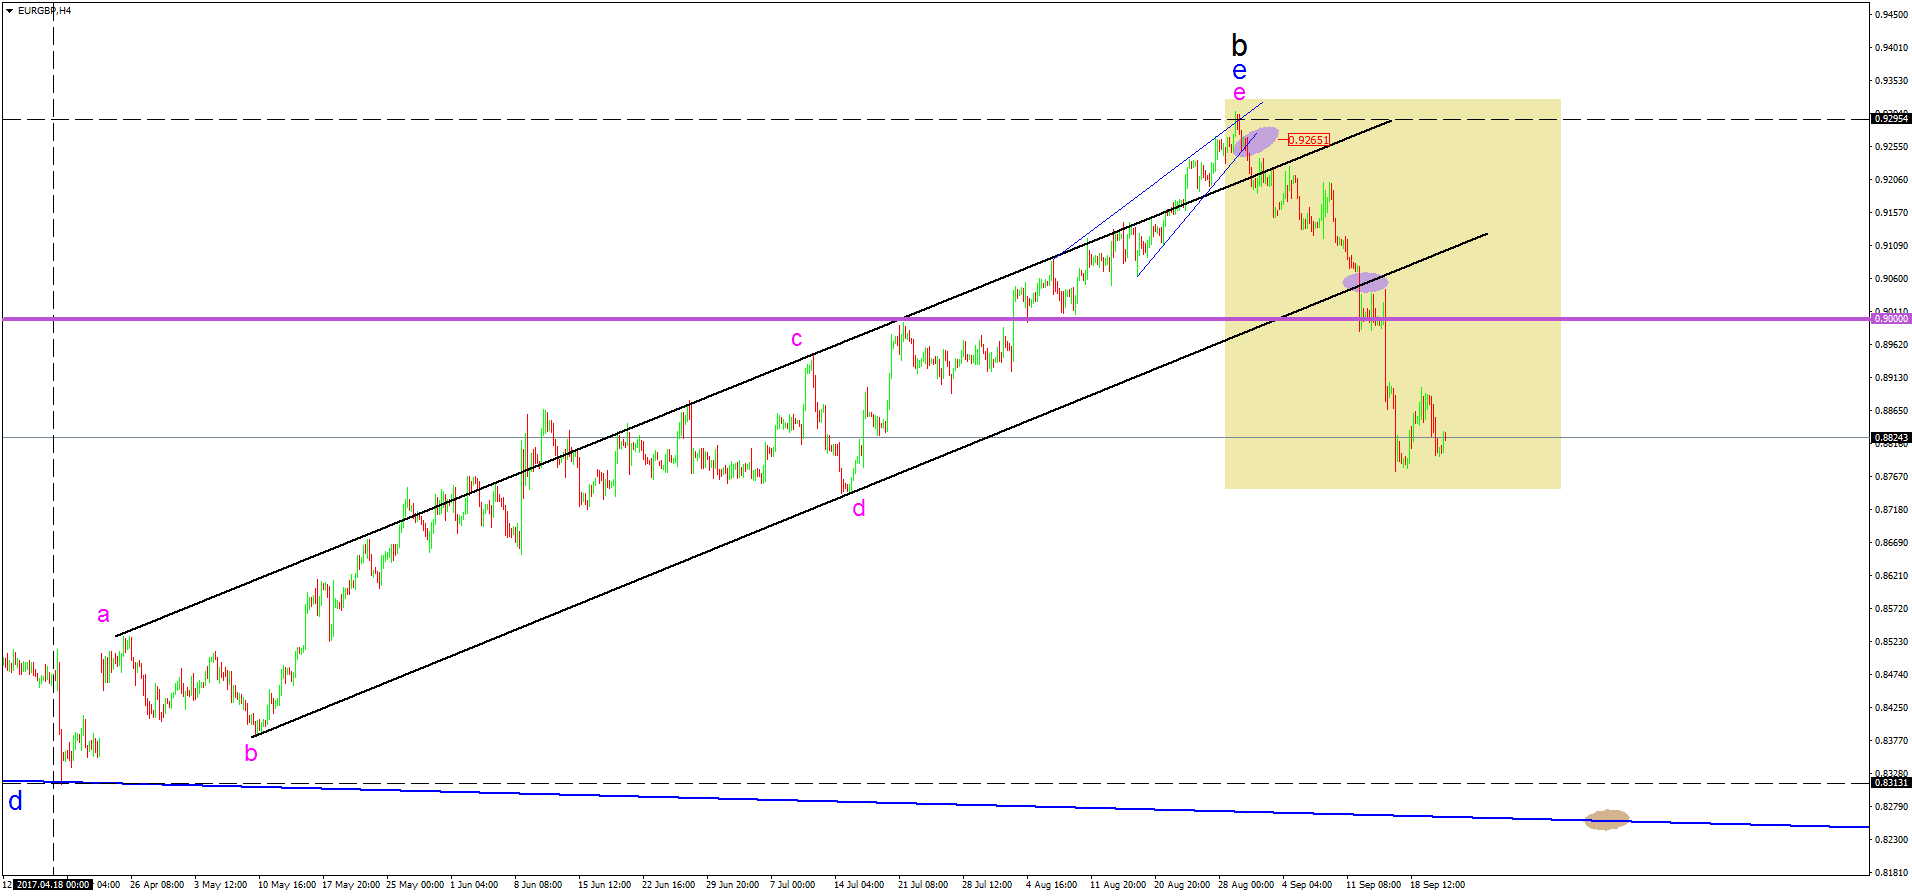
The chart above shows a triangle. Like it or not, it is.
That’s the Forex market today. It forms ugly patterns. However, the uglier, the better. How come?
Few traders notice it. As such, the crowd goes the other way. The smart traders know the triangle is a trend reversal one. And, they make money.
They go for the b-d trend line when the e-wave pierces the a-c one. And, add on a b-d break.
Japanese Reversal Patterns Forex Traders Use
Since they appeared in the Western world, the Japanese candlestick techniques were embraced wholeheartedly. That is, together with candlestick charts.
Today, a candlestick chart is the first option among retail Forex traders. Its penetration is simply amazing.
Why is that? Some reversal candlestick patterns in Forex have the answer.
The Japanese candlestick techniques appeal to traders because they are:
- Easy to spot
- Easy to set up a money management system
- Offer fabulous risk-reward ratios
- Give an early entry into the new trend. While keeping the risk under control!
As candlestick reversal patterns, Forex traders focus on:
- Morning and evening stars
- Piercing and dark-cloud cover to spot a trend reversal
- Bullish and bearish engulfing as reversal patterns
Nowadays, you can find a candlestick reversal patterns indicator mt4 platform uses. It’ll detect the patterns automatically. However, you must double check, and apply the money management rules on your own.
Morning and Evening Stars as Reversal Patterns
We must start with stars. They’re great trend reversal patterns to use.
Before going into details, think of the possibilities:
- They work on any candlestick chart
- These reversal patterns have only three candles to interpret
- As part of a money management system, traders wait for a pullback to enter.
So, we need three candles. For bullish reversal candlestick patterns, we look at a morning star.
That’s obvious. The name suggests the pattern reverses a bearish trend.
On the other hand, for bearish reversal candlestick patterns, we look for evening stars. Is it that easy? Yes.
The chart below shows an evening star as a trend reversal pattern. It has three candles, as follows:
- One green candle in the previous trend’s direction
- One small candle in the middle (ideally a doji candle or a shooting star – inverted hammer)
- A red candle that ends the pattern.
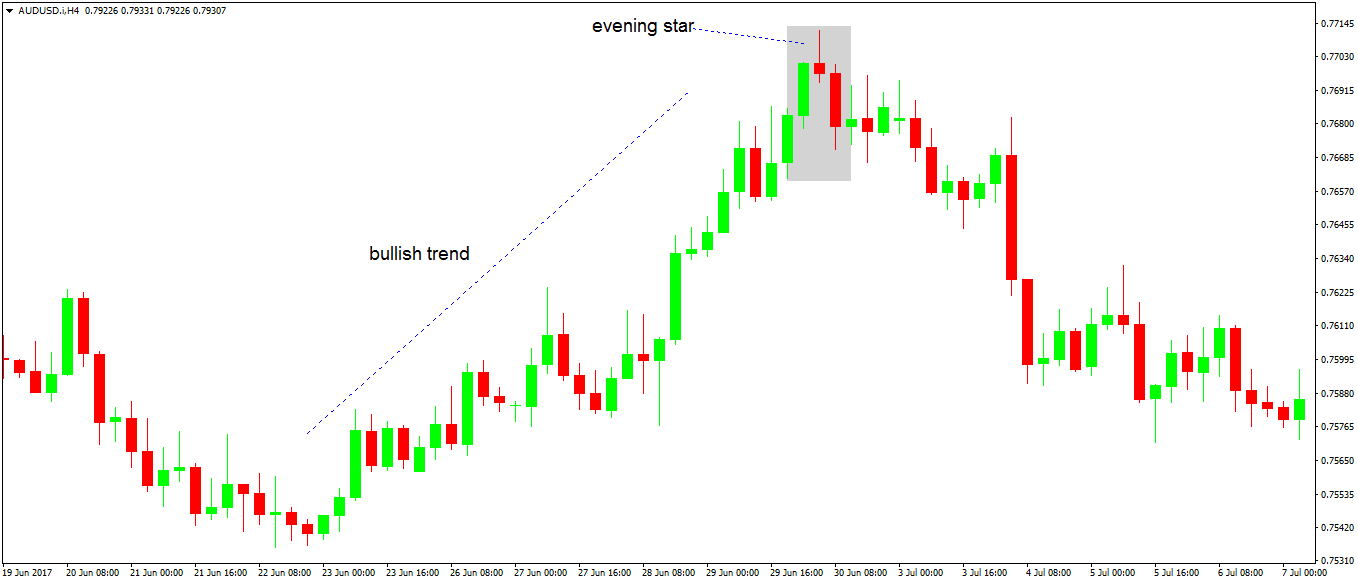
As such, the market formed a group of three candles at the end of a bullish trend. That’s one of the most powerful candlestick reversal patterns Forex traders use.
All rules get to be respected here:
- It forms after a bullish trend. Hence, it reverses it.
- It gives the new direction, acting like a real trend reversal
But, how to trade it? Smart traders must control risk. Here’s how.
How to Trade Stars as Trend Reversal Patterns
Before anything, we need to have a trading plan. This comes from the previous trend.
First, traders know what they’re up to. A trend reversal trading strategy is not an easy task. To go in, they need to know the risk.
And, of course, the potential reward. If there’s an appealing ratio, then why not?
Because the bullishness of the previous trend, bears must fight. Bulls won’t give up that easy.
As such, it is wise to wait for a pullback after the third candle. That helps to find a good entry.
So, the second step is to wait for the star to end. Then, directly measure it. Fibonacci comes to great help here. Last, entry on a 50%-61.8% retracement.
Once again, the golden ratio comes to help. How about the stop loss?
It is mandatory. We must control risk first, then look at the potential reward.
Therefore, the last step is to place a stop loss at the highs (after an evening star as reversal patterns). And, set a 1:2.5 or 1:3 risk-reward ratio.
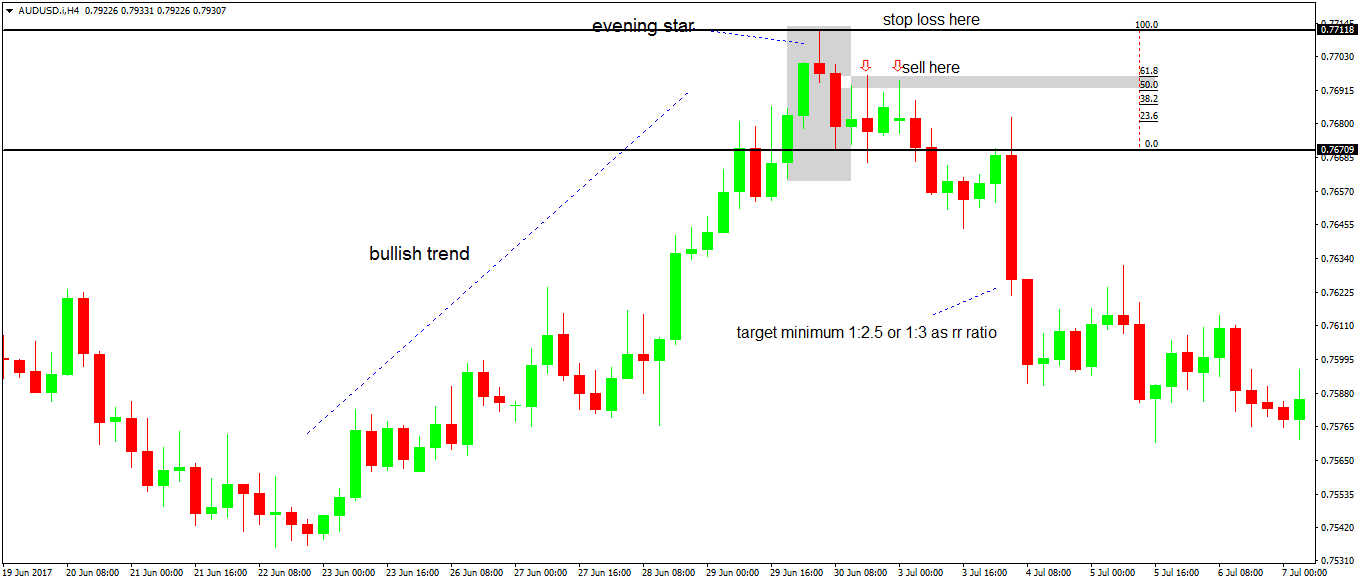
How about the chart above. Aren’t stars wonderful trend reversal patterns?
Piercing and Dark-Cloud Covers as Reversal Patterns Forex Traders Use
Just like a morning star, the piercing pattern is a bullish trend reversal pattern. And, the dark-cloud cover, is a bearish one.
But, there is a difference between these two reversal patterns. Stars have three candles. The piercing and the dark-cloud cover, only two.
That’s it. Other than that, the interpretation is similar.
In other words, only two candles make a trend reversal pattern? Yes, they do.
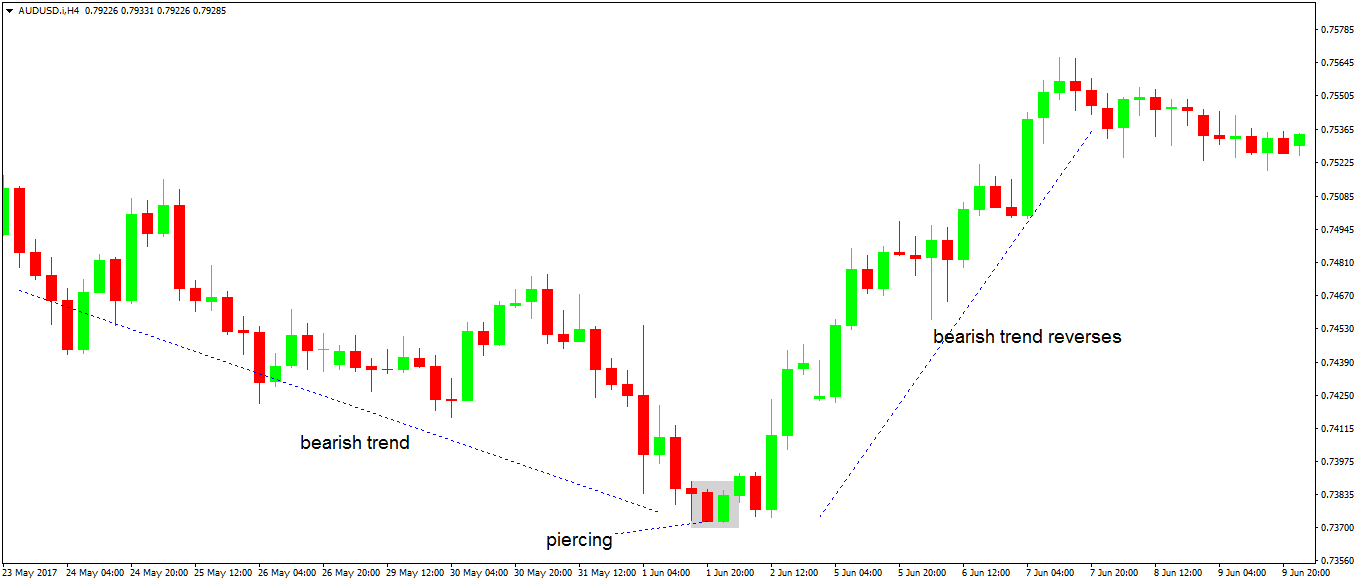
Here are some things to consider for the piercing pattern:
- A bearish trend must exist first.
- The first candle is a strong, red one.
- The second candle is a strong, green, bullish one.
Of course, there’s a catch here too. The second candle must:
- Retrace minimum 50% of the previous one.
- Not exceed 100% retracement of the first candle.
That’s the piercing pattern. And, the opposite is valid for the dark-cloud cover.
Only that, traders look to buy when a piercing appears, and sell in a dark-cloud cover trend reversal pattern. The same money management rules as in the stars example work here too.
But, what if the second candle exceeds 100% of the previous candle? When that happens, the market forms a bullish/bearish engulfing trend reversal pattern.
Bullish and Bearish Engulfing as Reversal Patterns
The exact nature of this pattern calls for the second candle to engulf the previous one totally. But, in the Forex market, that rarely happens.
Because the Forex market is extremely liquid, there’s no gap. Or, for the second candle to totally engulf the previous one, it needs to gap a bit.
However, the pattern works like a charm when trading other markets. And, it works in the Forex market too. But, only if you have a four-digit trading account. Which, is not recommended.
Conclusion
When trading with reversal patterns, Forex traders engage in a risky approach. However, they manage the risk properly.
As exemplified, a money management system gives fabulous returns with reversal patterns. The only thing traders need is a bit of patience for the market to retrace.
Between classic and Japanese reversal patterns, the first ones are more conservative. The Japanese approach belongs to aggressive traders.
However, both of them have the same outcome. The previous trend, no matter how high, will reverse.
Maybe the stop will get hit from time to time. But, if the risk-reward ratio of 1:2.5 or 1:3 is in place, the trading account will grow in time.
Isn’t it the aim when trading Forex?
START LEARNING FOREX TODAY!
- Best chart patterns
- Chart patterns
- Falling Wedge
- Forex candlestick patterns
- Forex Patterns
- Hammer candlestick pattern
- Hammer Reversal Candle Trade
- head and shoulders
- morning star candlestick
- reversal patterns
- Rising Wedge
- Technical Analysis
share This:


Leave a Reply